Note
Access to this page requires authorization. You can try signing in or changing directories.
Access to this page requires authorization. You can try changing directories.
APPLIES TO: All API Management tiers
Azure Monitor collects and aggregates metrics and logs from your system to monitor availability, performance, and resilience, and notify you of issues affecting your system. You can use the Azure portal, PowerShell, Azure CLI, REST API, or client libraries to set up and view monitoring data.
Different metrics and logs are available for different resource types. This article describes the types of monitoring data you can collect for this service and ways to analyze that data.
Collect data with Azure Monitor
This table describes how you can collect data to monitor your service, and what you can do with the data once collected:
| Data to collect | Description | How to collect and route the data | Where to view the data | Supported data |
|---|---|---|---|---|
| Metric data | Metrics are numerical values that describe an aspect of a system at a particular point in time. Metrics can be aggregated using algorithms, compared to other metrics, and analyzed for trends over time. | - Collected automatically at regular intervals. - You can route some platform metrics to a Log Analytics workspace to query with other data. Check the DS export setting for each metric to see if you can use a diagnostic setting to route the metric data. |
Metrics explorer | Azure API Management metrics supported by Azure Monitor |
| Resource log data | Logs are recorded system events with a timestamp. Logs can contain different types of data, and be structured or free-form text. You can route resource log data to Log Analytics workspaces for querying and analysis. | Create a diagnostic setting to collect and route resource log data. | Log Analytics | Azure API Management resource log data supported by Azure Monitor |
| Activity log data | The Azure Monitor activity log provides insight into subscription-level events. The activity log includes information like when a resource is modified or a virtual machine is started. | - Collected automatically. - Create a diagnostic setting to a Log Analytics workspace at no charge. |
Activity log |
For the list of all of the data supported by Azure Monitor, see:
Built in monitoring for API Management
Azure API management has the following built in monitoring features.
Get API analytics in Azure API Management
Azure API Management provides analytics for your APIs so that you can analyze their usage and performance. Use analytics for high-level monitoring and troubleshooting of your APIs. For other monitoring features, including near real-time metrics and resource logs for diagnostics and auditing, see Tutorial: Monitor published APIs.

Note
Currently, this feature isn't available in workspaces.
- API Management provides analytics using an Azure Monitor-based dashboard. The dashboard aggregates data in an Azure Log Analytics workspace.
- In the classic API Management service tiers, your API Management instance also includes legacy built-in analytics in the Azure portal, and analytics data can be accessed using the API Management REST API. Closely similar data is shown in the Azure Monitor-based dashboard and built-in analytics.
Important
- The Azure Monitor-based dashboard is the recommended way to access analytics data.
- Effective March 2027, the dashboard and reports associated with API Management built-in analytics in the classic tiers will be retired. We recommend transitioning to the Azure Monitor-based dashboard that replaces it.
With API analytics, analyze the usage and performance of the APIs in your API Management instance across several dimensions, including:
- Timeline
- Geography
- APIs
- API operations
- Products
- Subscriptions
- Users
- Requests
- Language models (for large language model APIs)
API analytics provides data on requests, including failed and unauthorized requests. Geography values are based on IP address mapping. There can be a delay in the availability of analytics data.
Azure Monitor-based dashboard
To use the Azure Monitor-based dashboard, you need a Log Analytics workspace as a data source for API Management gateway logs.
If you need to configure one, the following are brief steps to send gateway logs to a Log Analytics workspace. For more information, see Enable diagnostic setting for Azure Monitor logs, later in this article. This procedure is a one-time setup.
In the Azure portal, navigate to your API Management instance.
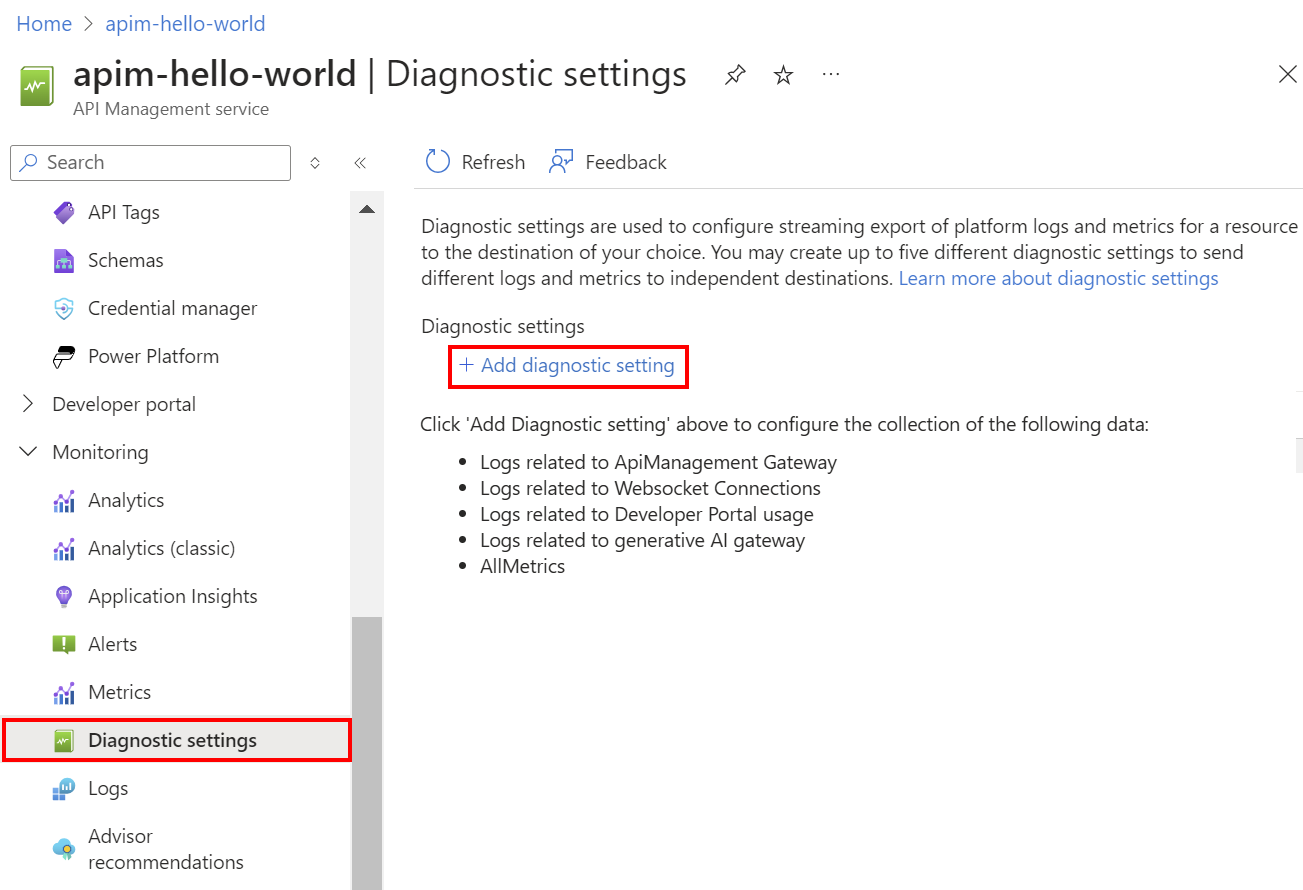
In the left-hand menu, under Monitoring, select Diagnostic settings > + Add diagnostic setting.
Enter a descriptive name for the diagnostic setting.
In Logs, select Logs related to ApiManagement Gateway.
Tip
To collect logs for large language model (LLM) APIs for display on the Azure Monitor-based dashboard, also select Logs related to generative AI gateway.
In Destination details, select Send to Log Analytics and select a Log Analytics workspace in the same or a different subscription. If you need to create a workspace, see Create a Log Analytics workspace.
Make sure Resource specific is selected as the destination table.
Select Save.
Important
A new Log Analytics workspace can take up to 2 hours to start receiving data. An existing workspace should start receiving data within approximately 15 minutes.
Access the dashboard
After a Log Analytics workspace is configured, access the Azure Monitor-based dashboard to analyze the usage and performance of your APIs.
- In the Azure portal, navigate to your API Management instance.
- In the left-hand menu, under Monitoring, select Analytics. The analytics dashboard opens.
- Select a time range for data.
- Select a report category for analytics data, such as Timeline, Geography, and so on.
Legacy built-in analytics
In certain API Management service tiers, built-in analytics (also called legacy analytics or classic analytics) is also available in the Azure portal, and analytics data can be accessed using the API Management REST API.
To access the built-in (classic) analytics in the Azure portal:
- In the Azure portal, navigate to your API Management instance.
- In the left-hand menu, under Monitoring, select Analytics (classic).
- Select a time range for data, or enter a custom time range.
- Select a report category for analytics data, such as Timeline, Geography, and so on.
- Optionally, filter the report by one or more other categories.
Use Reports operations in the API Management REST API to retrieve and filter analytics data for your API Management instance.
Available operations return report records by API, geography, API operations, product, request, subscription, time, or user.
Azure Monitor logs
This section shows you how to enable Azure Monitor logs for auditing and troubleshooting usage of different features of your API Management instance. By enabling a diagnostic setting, you can enable collection of one or more of the following categories of resource logs:
| Category | Description | Notes |
|---|---|---|
| API Management gateway | Requests processed by the API Management gateway, including HTTP methods, protocols, request and response bodies, headers, timings, error details, and cache involvement. | Adjust settings for all APIs, or override them for individual APIs. In API Management instances configured with workspaces, gateway logs can be collected individually for each workspace and aggregated for centralized access by the platform team. |
| WebSocket connections | Events for WebSocket API connections, starting from the handshake until the connection is terminated. | |
| Developer portal usage | Requests that are received and processed by the API Management developer portal, including user authentication actions, views of API details, and API testing in the interactive test console. | |
| Generative AI gateway | Requests processed by the API Management gateway for large language model (LLM) REST APIs such as Microsoft Foundry APIs, including token usage, models, and optionally details of request prompts and response completions. | Enable logging of request messages and/or response messages for specific LLM APIs. |
For more information, see API Management monitoring data reference.
Enable diagnostic setting for Azure Monitor logs
To configure a diagnostic setting for collection of resource logs:
In the Azure portal, navigate to your API Management instance.
In the left menu, under Monitoring, select Diagnostic settings > + Add diagnostic setting.
On the Diagnostic setting page, enter or select details for the setting:
- Diagnostic setting name: Enter a descriptive name.
- Category groups: Optionally make a selection for your scenario.
- Under Categories: Select one or more categories. For example, select Logs related to ApiManagement Gateway to collect logs for most requests to the API Management gateway.
- Under Destination details, select one or more options and specify details for the destination. For example, send logs to an Azure Log Analytics workspace, archive logs to a storage account, or stream them to an event hub. For more information, see Diagnostic settings in Azure Monitor.
- Select Save.
Tip
- To view API analytics in the Azure Monitor-based dashboard for API Management (Monitoring > Analytics blade), select an Azure Log Analytics workspace as the destination.
- If you select a Log Analytics workspace, you can choose to store the data in a resource-specific table (for example, an ApiManagementGatewayLogs table) or store in the general AzureDiagnostics table. We recommend using the resource-specific table for log destinations that support it. Learn more
After configuring details for the log destination or destinations, select Save.
Note
Adding a diagnostic setting object might result in a failure if the MinApiVersion property of your API Management service is set to any API version higher than 2022-09-01-preview.
Note
To enable diagnostic settings for API Management workspaces, see Create and manage a workspace.
View Azure Monitor log data
Depending on the log destination you choose, it can take a few minutes for data to appear.
View logs in Log Analytics workspace
If you enable collection of logs or metrics in a Log Analytics workspace, it can take a few minutes for data to appear in Azure Monitor and the Azure Monitor-based dashboard for API Management (Monitoring > Analytics blade).
To view the data:
In the Azure portal, navigate to your API Management instance.
In the left menu, under Monitoring, select Logs.
Run queries to view the data. Several sample queries are provided, or run your own. For example, the following query retrieves the most recent 24 hours of data from the ApiManagementGatewayLogs table:
ApiManagementGatewayLogs
| where TimeGenerated > ago(1d)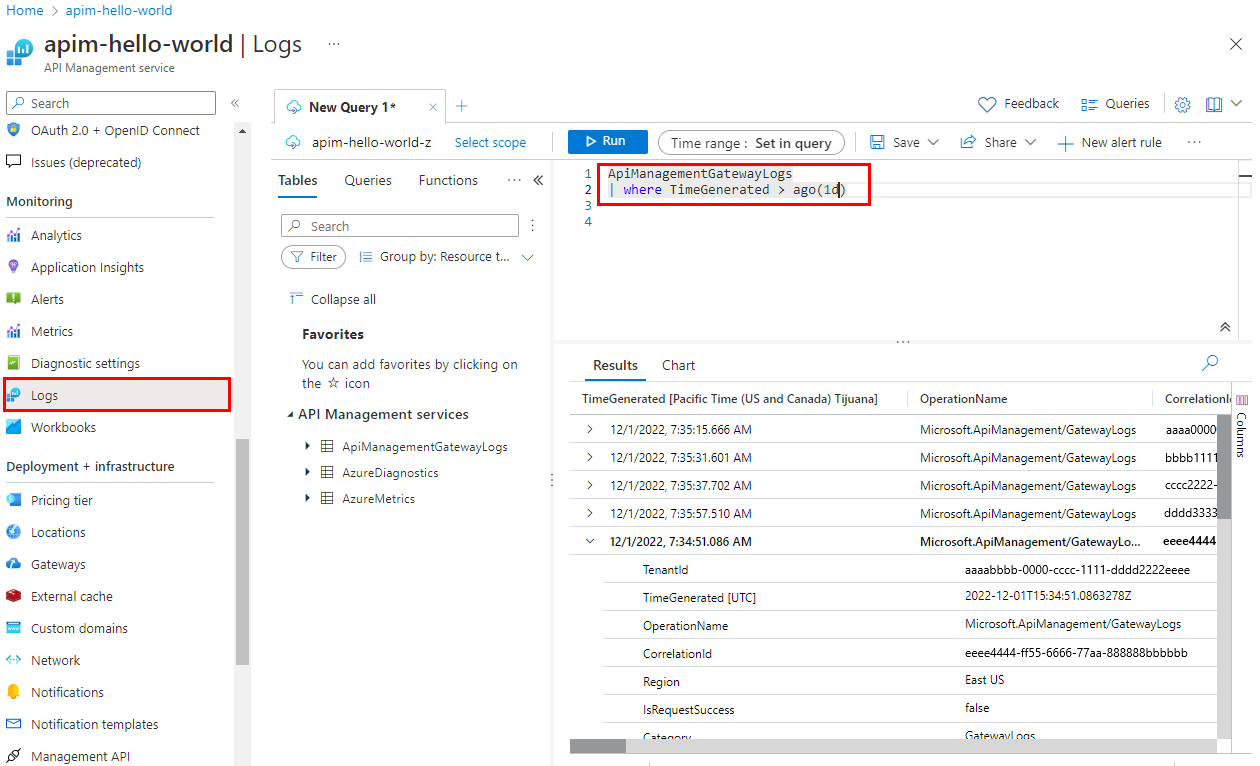

View logs in storage account
If you send logs to a storage account, you can access the data in the Azure portal and download it for analysis.
- In the Azure portal, navigate to the storage account destination.
- In the left menu, select Storage Browser.
- Under Blob containers, select a name for the log data, for example, insights-logs-developerportalauditlogs for developer portal usage logs.
- Navigate to the container for the logs in your API Management instance. The logs are partitioned in intervals of 1 hour.
- To retrieve the data for further analysis, select Download.
Modify API logging settings
When you use the portal to create a diagnostic setting to enable collection of API Management gateway or generative AI gateway (LLM) logs, logging is enabled with default settings. Default settings do not include details of requests or responses such as request or response bodies. You can adjust the logging settings for all APIs, or override them for individual APIs. For example, adjust the sampling rate or the verbosity of the gateway log data, enable logging of LLM request or response messages, or disable logging for some APIs.
For details about the logging settings, see the Diagnostic - Create or Update and the API diagnostic - Create or Update REST API reference pages.
To configure logging settings for all APIs:
- In the left menu of your API Management instance, select APIs > APIs > All APIs.
- Select the Settings tab from the top bar.
- Scroll down to the Diagnostic Logs section, and select the Azure Monitor tab.
- Review the settings and make changes if needed. Select Save.
To configure logging settings for a specific API:
- In the left menu of your API Management instance, select APIs > APIs and then the name of the API.
- Select the Settings tab from the top bar.
- Scroll down to the Diagnostic Logs section, and select the Azure Monitor tab.
- Review the settings and make changes if needed. Select Save.
Important
API Management enforces a 32 KB limit for the size of log entries sent to Azure Monitor. The behavior when a log entry exceeds the limit depends on the log category and the data attributes that are logged:
- API Management gateway logs - Logged request or response payloads in a log entry, if collected, can be up to 8,192 bytes each. If the combined size of all attributes in an entry exceeds 32 KB, API Management trims the entry by removing all body and trace content.
- Generative AI gateway logs - LLM request or response messages up to 32 KB in size, if collected, are sent in a single entry. Messages larger than 32 KB are split and logged in 32 KB chunks with sequence numbers for later reconstruction. Request messages and response messages can't exceed 2 MB each.
Use Azure Monitor tools to analyze the data
These Azure Monitor tools are available in the Azure portal to help you analyze monitoring data:
Some Azure services have a built-in monitoring dashboard in the Azure portal. These dashboards are called insights, and you can find them in the Insights section of Azure Monitor in the Azure portal.
Metrics explorer allows you to view and analyze metrics for Azure resources. For more information, see Analyze metrics with Azure Monitor metrics explorer.
Log Analytics allows you to query and analyze log data using the Kusto query language (KQL). For more information, see Get started with log queries in Azure Monitor.
The Azure portal has a user interface for viewing and basic searches of the activity log. To do more in-depth analysis, route the data to Azure Monitor logs and run more complex queries in Log Analytics.
Application Insights monitors the availability, performance, and usage of your web applications, so you can identify and diagnose errors without waiting for a user to report them.
Application Insights includes connection points to various development tools and integrates with Visual Studio to support your DevOps processes. For more information, see Application monitoring for App Service.
Tools that allow more complex visualization include:
- Dashboards that let you combine different kinds of data into a single pane in the Azure portal.
- Workbooks, customizable reports that you can create in the Azure portal. Workbooks can include text, metrics, and log queries.
- Grafana, an open platform tool that excels in operational dashboards. You can use Grafana to create dashboards that include data from multiple sources other than Azure Monitor.
- Power BI, a business analytics service that provides interactive visualizations across various data sources. You can configure Power BI to automatically import log data from Azure Monitor to take advantage of these visualizations.
Visualize API Management monitoring data using a Managed Grafana dashboard
You can use Azure Managed Grafana to visualize API Management monitoring data that is collected into a Log Analytics workspace. Use a prebuilt API Management dashboard for real-time visualization of logs and metrics collected from your API Management instance.
On your API Management instance:
To visualize resource logs and metrics for API Management, configure diagnostic settings to collect resource logs and send them to a Log Analytics workspace.
To visualize detailed data about requests to the API Management gateway, integrate your API Management instance with Application Insights.
Note
To visualize data in a single dashboard, configure the Log Analytics workspace for the diagnostic settings and the Application Insights instance in the same resource group as your API Management instance.
On your Managed Grafana workspace:
- To create a Managed Grafana instance and workspace, see the quickstart for the portal or the Azure CLI.
- The Managed Grafana instance must be in the same subscription as the API Management instance.
- When created, the Grafana workspace is automatically assigned a Microsoft Entra managed identity, which is assigned the Monitor Reader role on the subscription. This approach gives you immediate access to Azure Monitor from the new Grafana workspace without needing to set permissions manually. Learn more about configuring data sources for Managed Grafana.
First import the API Management dashboard to your Management Grafana workspace.
To import the dashboard:
- Go to your Azure Managed Grafana workspace. In the portal, on the Overview page of your Managed Grafana instance, select the Endpoint link.
- In the Managed Grafana workspace, go to Dashboards > Browse > Import.
- On the Import page, under Import via grafana.com, enter 16604 and select Load.
- Select an Azure Monitor data source, review or update the other options, and select Import.
To use the API Management dashboard:
- In the Managed Grafana workspace, go to Dashboards > Browse and select your API Management dashboard.
- In the dropdowns at the top, make selections for your API Management instance. If configured, select an Application Insights instance and a Log Analytics workspace.
Review the default visualizations on the dashboard, which appears similar to the following screenshot:

Export Azure Monitor data
You can export data out of Azure Monitor into other tools using:
Metrics: Use the REST API for metrics to extract metric data from the Azure Monitor metrics database. For more information, see Azure Monitor REST API reference.
Logs: Use the REST API or the associated client libraries.
To get started with the Azure Monitor REST API, see Azure monitoring REST API walkthrough.
Use Kusto queries to analyze log data
You can analyze Azure Monitor Log data using the Kusto query language (KQL). For more information, see Log queries in Azure Monitor.
Use Azure Monitor alerts to notify you of issues
Azure Monitor alerts allow you to identify and address issues in your system, and proactively notify you when specific conditions are found in your monitoring data before your customers notice them. You can alert on any metric or log data source in the Azure Monitor data platform. There are different types of Azure Monitor alerts depending on the services you're monitoring and the monitoring data you're collecting. See Choosing the right type of alert rule.
To see how to set up an alert rule in Azure API Management, see Set up an alert rule.
For examples of common alerts for Azure resources, see Sample log alert queries.
Implementing alerts at scale
For some services, you can monitor at scale by applying the same metric alert rule to multiple resources of the same type that exist in the same Azure region. Azure Monitor Baseline Alerts (AMBA) provides a semi-automated method of implementing important platform metric alerts, dashboards, and guidelines at scale.
Get personalized recommendations using Azure Advisor
For some services, if critical conditions or imminent changes occur during resource operations, an alert displays on the service Overview page in the portal. You can find more information and recommended fixes for the alert in Advisor recommendations under Monitoring in the left menu. During normal operations, no advisor recommendations display.
For more information on Azure Advisor, see Azure Advisor overview.