Azure Application Gateway monitoring data reference
This article contains all the monitoring reference information for this service.
See Monitor Azure Application Gateway for details on the data you can collect for Application Gateway and how to use it.
Metrics
This section lists all the automatically collected platform metrics for this service. These metrics are also part of the global list of all platform metrics supported in Azure Monitor.
For information on metric retention, see Azure Monitor Metrics overview.
Supported metrics for Microsoft.Network/applicationGateways
The following table lists the all metrics available for the Microsoft.Network/applicationGateways resource type. More description details for many metrics are included after this table.
- All columns might not be present in every table.
- Some columns might be beyond the viewing area of the page. Select Expand table to view all available columns.
Table headings
- Category - The metrics group or classification.
- Metric - The metric display name as it appears in the Azure portal.
- Name in REST API - The metric name as referred to in the REST API.
- Unit - Unit of measure.
- Aggregation - The default aggregation type. Valid values: Average (Avg), Minimum (Min), Maximum (Max), Total (Sum), Count.
- Dimensions - Dimensions available for the metric.
- Time Grains - Intervals at which the metric is sampled. For example,
PT1Mindicates that the metric is sampled every minute,PT30Mevery 30 minutes,PT1Hevery hour, and so on. - DS Export- Whether the metric is exportable to Azure Monitor Logs via diagnostic settings. For information on exporting metrics, see Create diagnostic settings in Azure Monitor.
| Metric | Name in REST API | Unit | Aggregation | Dimensions | Time Grains | DS Export |
|---|---|---|---|---|---|---|
| Application Gateway Total Time Time that it takes for a request to be processed and its response to be sent. This is the interval from the time when Application Gateway receives the first byte of an HTTP request to the time when the response send operation finishes. It's important to note that this usually includes the Application Gateway processing time, time that the request and response packets are traveling over the network and the time the backend server took to respond. |
ApplicationGatewayTotalTime |
MilliSeconds | Average, Maximum | Listener |
PT1M | No |
| Requests per minute per Healthy Host Average request count per minute per healthy backend host in a pool |
AvgRequestCountPerHealthyHost |
Count | Average | BackendSettingsPool |
PT1M | No |
| WAF Bot Protection Matches Matched Bot Rules |
AzwafBotProtection |
Count | Total (Sum) | Action, Category, Mode, CountryCode, PolicyName, PolicyScope |
PT1M | Yes |
| WAF Custom Rule Matches Matched Custom Rules |
AzwafCustomRule |
Count | Total (Sum) | Action, CustomRuleID, Mode, CountryCode, PolicyName, PolicyScope |
PT1M | Yes |
| WAF JS Challenge Request Count Total number of JS challenge requests evaluated by WAF |
AzWAFJSChallengeRequestCount |
Count | Total (Sum) | Action, PolicyName, Rule, PolicyScope |
PT1M | Yes |
| WAF Managed Rule Matches Matched Managed Rules |
AzwafSecRule |
Count | Total (Sum) | Action, Mode, RuleGroupID, RuleID, CountryCode, PolicyName, PolicyScope, RuleSetName |
PT1M | Yes |
| WAF Total Requests Total number of requests evaluated by WAF |
AzwafTotalRequests |
Count | Total (Sum) | Action, CountryCode, Method, Mode, PolicyName, PolicyScope |
PT1M | Yes |
| Backend Connect Time Time spent establishing a connection with a backend server |
BackendConnectTime |
MilliSeconds | Average, Maximum | Listener, BackendServer, BackendPool, BackendHttpSetting |
PT1M | No |
| Backend First Byte Response Time Time interval between start of establishing a connection to backend server and receiving the first byte of the response header, approximating processing time of backend server |
BackendFirstByteResponseTime |
MilliSeconds | Average, Maximum | Listener, BackendServer, BackendPool, BackendHttpSetting |
PT1M | No |
| Backend Last Byte Response Time Time interval between start of establishing a connection to backend server and receiving the last byte of the response body |
BackendLastByteResponseTime |
MilliSeconds | Average, Maximum | Listener, BackendServer, BackendPool, BackendHttpSetting |
PT1M | No |
| Backend Response Status The number of HTTP response codes generated by the backend members. This does not include any response codes generated by the Application Gateway. |
BackendResponseStatus |
Count | Total (Sum) | BackendServer, BackendPool, BackendHttpSetting, HttpStatusGroup |
PT1M | Yes |
| Web Application Firewall Blocked Requests Rule Distribution Web Application Firewall blocked requests rule distribution |
BlockedCount |
Count | Total (Sum) | RuleGroup, RuleId |
PT1M | Yes |
| Bytes Received The total number of bytes received by the Application Gateway from the clients |
BytesReceived |
Bytes | Total (Sum) | Listener |
PT1M | Yes |
| Bytes Sent The total number of bytes sent by the Application Gateway to the clients |
BytesSent |
Bytes | Total (Sum) | Listener |
PT1M | Yes |
| Current Capacity Units Capacity Units consumed |
CapacityUnits |
Count | Average | <none> | PT1M | No |
| Client RTT Round trip time between clients and Application Gateway. This metric indicates how long it takes to establish connections and return acknowledgements |
ClientRtt |
MilliSeconds | Average, Maximum | Listener |
PT1M | No |
| Current Compute Units Compute Units consumed |
ComputeUnits |
Count | Average | <none> | PT1M | No |
| CPU Utilization Current CPU utilization of the Application Gateway |
CpuUtilization |
Percent | Average | <none> | PT1M | No |
| Current Connections Count of current connections established with Application Gateway |
CurrentConnections |
Count | Total (Sum) | <none> | PT1M | Yes |
| Estimated Billed Capacity Units Estimated capacity units that will be charged |
EstimatedBilledCapacityUnits |
Count | Average | <none> | PT1M | No |
| Failed Requests Count of failed requests that Application Gateway has served |
FailedRequests |
Count | Total (Sum) | BackendSettingsPool |
PT1M | Yes |
| Fixed Billable Capacity Units Minimum capacity units that will be charged |
FixedBillableCapacityUnits |
Count | Average | <none> | PT1M | No |
| Healthy Host Count Number of healthy backend hosts |
HealthyHostCount |
Count | Average | BackendSettingsPool |
PT1M | Yes |
| Web Application Firewall Total Rule Distribution Web Application Firewall Total Rule Distribution for the incoming traffic |
MatchedCount |
Count | Total (Sum) | RuleGroup, RuleId |
PT1M | Yes |
| New connections per second New connections per second established with Application Gateway |
NewConnectionsPerSecond |
CountPerSecond | Average | <none> | PT1M | No |
| Response Status Http response status returned by Application Gateway |
ResponseStatus |
Count | Total (Sum) | HttpStatusGroup |
PT1M | Yes |
| Throughput Number of bytes per second the Application Gateway has served |
Throughput |
BytesPerSecond | Average | <none> | PT1M | No |
| Client TLS Protocol The number of TLS and non-TLS requests initiated by the client that established connection with the Application Gateway. To view TLS protocol distribution, filter by the dimension TLS Protocol. |
TlsProtocol |
Count | Total (Sum) | Listener, TlsProtocol |
PT1M | Yes |
| Total Requests Count of successful requests that Application Gateway has served |
TotalRequests |
Count | Total (Sum) | BackendSettingsPool |
PT1M | Yes |
| Unhealthy Host Count Number of unhealthy backend hosts |
UnhealthyHostCount |
Count | Average | BackendSettingsPool |
PT1M | Yes |
For available Web Application Firewall (WAF) metrics, see Application Gateway WAF v2 metrics and Application Gateway WAF v1 metrics.
Timing metrics for Application Gateway v2 SKU
Application Gateway v2 SKU provides many built‑in timing metrics related to the request and response, which are all measured in milliseconds. What follows is expanded descriptions of the timing metrics already listed in the previous metrics table.
- Backend connect time. This value includes the network latency and the time taken by the backend server's TCP stack to establish new connections. For TLS, it also includes the time spent on handshake.
- Backend first byte response time. This value approximates the sum of Backend connect time, time taken by the request to reach the backend from Application Gateway, time taken by backend application to respond, which is the time the server takes to generate content and potentially fetch database queries, and the time taken by first byte of the response to reach the Application Gateway from the backend.
- Backend last byte response time. This value approximates the sum of backend first byte response time and data transfer time. This number varies greatly depending on the size of objects requested and the latency of the server network.
- Application gateway total time. This interval is the time from Application Gateway receives the first byte of the HTTP request to the time when the last response byte was sent to the client.
- Client RTT. Average round-trip time between clients and Application Gateway.
Metrics for Application Gateway v2 SKU
For Application Gateway v2 SKU, the following metrics are available. What follows is expanded descriptions of the metrics already listed in the previous metrics table.
- Bytes received. This metric accounts for only the Request content size observed by the Application Gateway. It doesn't include data transfers such as TLS header negotiations, TCP/IP packet headers, or retransmissions.
- Bytes sent. This metric accounts for only the Response Content size served by the Application Gateway. It doesn't include data transfers such as TCP/IP packet headers or retransmissions.
- Client TLS protocol. Count of TLS and non-TLS requests.
- Current capacity units. There are three determinants to capacity unit: compute unit, persistent connections, and throughput. Each capacity unit is composed of at most one compute unit, or 2500 persistent connections, or 2.22-Mbps throughput.
- Current compute units. Factors affecting compute unit are TLS connections/sec, URL Rewrite computations, and WAF rule processing.
- Current connections. The total number of concurrent connections active from clients to the Application Gateway.
- Estimated Billed Capacity units. With the v2 SKU, consumption drives the pricing model. Capacity units measure consumption-based cost that is charged in addition to the fixed cost. *Estimated Billed Capacity units indicate the number of capacity units using which the billing is estimated. This amount is calculated as the greater value between Current capacity units (capacity units required to load balance the traffic) and Fixed billable capacity units (minimum capacity units kept provisioned).
- Failed Requests. This value includes the 5xx codes that are generated from the Application Gateway and the 5xx codes that are generated from the backend. The request count can be further filtered to show count per each/specific backend pool-http setting combination.
- Fixed Billable Capacity Units. The minimum number of capacity units kept provisioned as per the Minimum scale units setting in the Application Gateway configuration. One instance translates to 10 capacity units.
- New connections per second. The average number of new TCP connections per second established from clients to the Application Gateway and from the Application Gateway to the backend members.
- Response Status. The response status code distribution can be further categorized to show responses in 2xx, 3xx, 4xx, and 5xx categories.
- Throughput. This metric accounts for only the Content size served by the Application Gateway. It doesn't include data transfers such as TLS header negotiations, TCP/IP packet headers, or retransmissions.
- Total Requests. Successful requests that Application Gateway served. The request count can be filtered to show count per each/specific backend pool-http setting combination.
Backend metrics for Application Gateway v2 SKU
For Application Gateway v2 SKU, the following backend metrics are available. What follows is expanded descriptions of the backend metrics already listed in the previous metrics table.
- Backend response status. Count of HTTP response status codes returned by the backends, not including any response codes generated by the Application Gateway. The response status code distribution can be categorized to show responses in 2xx, 3xx, 4xx, and 5xx categories.|
- Healthy host count. The number of hosts that are determined healthy by the health probe. You can filter on a per backend pool basis to show the number of healthy hosts in a specific backend pool.
- Unhealthy host count. The number of hosts that are determined unhealthy by the health probe. You can filter on a per backend pool basis to show the number of unhealthy hosts in a specific backend pool.
- Requests per minute per Healthy Host. The average number of requests received by each healthy member in a backend pool in a minute. Specify the backend pool using the BackendPool HttpSettings dimension.
Metrics for Application Gateway v1 SKU
For Application Gateway v1 SKU, the following metrics are available. What follows is expanded descriptions of the metrics already listed in the previous metrics table.
CPU Utilization. Displays the utilization of the CPUs allocated to the Application Gateway. Under normal conditions, CPU usage shouldn't regularly exceed 90%, because that situation might cause latency in the websites hosted behind the Application Gateway and disrupt the client experience. You can indirectly control or improve CPU utilization by modifying the configuration of the Application Gateway by increasing the instance count or by moving to a larger SKU size, or doing both.
Current connections. Count of current connections established with Application Gateway.
Failed Requests. Number of requests that failed due to connection issues. This count includes requests that failed due to exceeding the "Request time-out" HTTP setting and requests that failed due to connection issues between Application gateway and backend. This count doesn't include failures due to no healthy backend being available. 4xx and 5xx responses from the backend are also not considered as part of this metric.
Response Status. HTTP response status returned by Application Gateway. The response status code distribution can be further categorized to show responses in 2xx, 3xx, 4xx, and 5xx categories.
Throughput. Number of bytes per second the Application Gateway served.
Total Requests. Count of successful requests that Application Gateway has served. The request count can be further filtered to show count per each/specific backend pool-http setting combination.
Backend metrics for Application Gateway v1 SKU
For Application Gateway v1 SKU, the following backend metrics are available. What follows is expanded descriptions of the backend metrics already listed in the previous metrics table.
Healthy host count. The number of backends that are determined healthy by the health probe. You can filter on a per backend pool basis to show the number of healthy hosts in a specific backend pool.
Unhealthy host count. The number of backends that are determined unhealthy by the health probe. You can filter on a per backend pool basis to show the number of unhealthy hosts in a specific backend pool.
Backend health API
See Application Gateways - Backend Health for details of the API call to retrieve the backend health of an application gateway.
Sample Request:
POST
https://management.azure.com/subscriptions/subid/resourceGroups/rg/providers/Microsoft.Network/
applicationGateways/appgw/backendhealth?api-version=2021-08-01
After sending this POST request, you should see an HTTP 202 Accepted response. In the response headers, find the Location header and send a new GET request using that URL.
GET
https://management.azure.com/subscriptions/subid/providers/Microsoft.Network/locations/region-name/operationResults/GUID?api-version=2021-08-01
TLS/TCP proxy metrics
Application Gateway supports TLS/TCP proxy monitoring. With layer 4 proxy feature now available with Application Gateway, there are some Common metrics that apply to both layer 7 and layer 4. There are some layer 4 specific metrics. The following list summarizes the metrics are the applicable for layer 4 usage.
- Current Connections
- New Connections per second
- Throughput
- Healthy host count
- Unhealthy host count
- Client RTT
- Backend Connect Time
- Backend First Byte Response Time.
BackendHttpSettingdimension includes both layer 7 and layer 4 backend settings.
For more information, see previous descriptions and the metrics table.
These metrics apply to layer 4 only.
- Backend Session Duration. The total time of a backend connection. The average time duration from the start of a new connection to its termination.
BackendHttpSettingdimension includes both layer 7 and layer 4 backend settings. - Connection Lifetime. The total time of a client connection to application gateway. The average time duration from the start of a new connection to its termination in milliseconds.
TLS/TCP proxy backend health
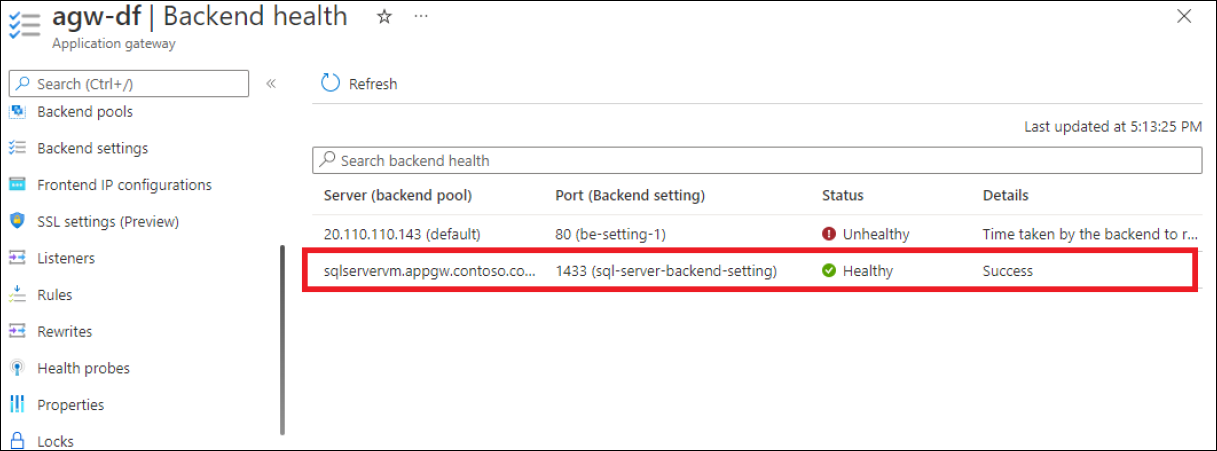
Application Gateway's layer 4 proxy provides the capability to monitor the health of individual members of the backend pools through the portal and REST API.
Metric dimensions
For information about what metric dimensions are, see Multi-dimensional metrics.
This service has the following dimensions associated with its metrics.
- Action
- BackendHttpSetting
- BackendPool
- BackendServer
- BackendSettingsPool
- Category
- CountryCode
- CustomRuleID
- HttpStatusGroup
- Listener
- Method
- Mode
- PolicyName
- PolicyScope
- RuleGroup
- RuleGroupID
- RuleId
- RuleSetName
- TlsProtocol
Note
If the Application Gateway has more than one listener, then always filter by the Listener dimension while comparing different latency metrics to get more meaningful inference.
Resource logs
This section lists the types of resource logs you can collect for this service. The section pulls from the list of all resource logs category types supported in Azure Monitor.
Supported resource log categories for Microsoft.Network/applicationGateways
| Category | Category display name | Log table | Supports basic log plan | Supports ingestion-time transformation | Example queries | Costs to export |
|---|---|---|---|---|---|---|
ApplicationGatewayAccessLog |
Application Gateway Access Log | AGWAccessLogs Contains all the log to view Application Gateway access patterns and analyze important information. This includes the caller's IP, requested URL, response latency, return code, and bytes in and out. |
Yes | No | No | |
ApplicationGatewayFirewallLog |
Application Gateway Firewall Log | AGWFirewallLogs Contains all the logs to view the requests that are logged through either detection or prevention mode of an application gateway that is configured with the web application firewall. |
Yes | No | No | |
ApplicationGatewayPerformanceLog |
Application Gateway Performance Log | AGWPerformanceLogs Contains all the logs to view how Application Gateway instances are performing. This log captures performance information for each instance, including total requests served, throughput in bytes, total requests served, failed request count, and healthy and unhealthy backend instance count.The Performance log is available only for the v1 SKU. |
Yes | No | No |
Access log. You can use the Access log to view Application Gateway access patterns and analyze important information. This information includes the caller's IP, requested URL, response latency, return code, and bytes in and out. An access log is collected every 60 seconds. This log contains one record per instance of Application Gateway. The
instanceIdproperty identifies the Application Gateway instance.Firewall log. You can use the Firewall log to view the requests that are logged through either detection or prevention mode of an application gateway that is configured with the web application firewall. Firewall logs are collected every 60 seconds.
Performance log. You can use the Performance log to view how Application Gateway instances are performing. This log captures performance information for each instance, including total requests served, throughput in bytes, total requests served, failed request count, and healthy and unhealthy backend instance count. A performance log is collected every 60 seconds.
Note
The Performance log is available only for the v1 SKU. For the v2 SKU, use Metrics for performance data.
Access log category
The access log is generated only if you enable it on each Application Gateway instance, as detailed in Enable logging. The data is stored in the storage account that you specified when you enabled the logging. Each access of Application Gateway is logged in JSON format as shown.
Note
For TLS/TCP proxy related information, visit data reference.
For Application Gateway and WAF v2 SKU:
| Value | Description |
|---|---|
| instanceId | Application Gateway instance that served the request. |
| clientIP | IP of the immediate client of Application Gateway. If another proxy fronts your application gateway, this value displays the IP of that fronting proxy. |
| httpMethod | HTTP method used by the request. |
| requestUri | URI of the received request. |
| UserAgent | User agent from the HTTP request header. |
| httpStatus | HTTP status code returned to the client from Application Gateway. |
| httpVersion | HTTP version of the request. |
| receivedBytes | Size of packet received, in bytes. |
| sentBytes | Size of packet sent, in bytes. |
| clientResponseTime | Time difference (in seconds) between the first byte and the last byte application gateway sent to the client. Helpful in gauging Application Gateway's processing time for responses or slow clients. |
| timeTaken | Length of time (in seconds) that it takes for the first byte of a client request to be processed and its last-byte sent in the response to the client. It's important to note that the Time-Taken field usually includes the time that the request and response packets are traveling over the network. |
| WAFEvaluationTime | Length of time (in seconds) that it takes for the request to be processed by the WAF. |
| WAFMode | Value can be either Detection or Prevention. |
| transactionId | Unique identifier to correlate the request received from the client. |
| sslEnabled | Whether communication to the backend pools used TLS. Valid values are on and off. |
| sslCipher | Cipher suite being used for TLS communication (if TLS is enabled). |
| sslProtocol | SSL/TLS protocol being used (if TLS is enabled). |
| sslClientVerify | Shows the result of client certificate verification as SUCCESS or FAILED. Failed status will include error information. |
| sslClientCertificateFingerprint | The SHA1 thumbprint of the client certificate for an established TLS connection. |
| sslClientCertificateIssuerName | The issuer DN string of the client certificate for an established TLS connection. |
| serverRouted | The backend server that application gateway routes the request to. |
| serverStatus | HTTP status code of the backend server. |
| serverResponseLatency | Latency of the response (in seconds) from the backend server. |
| host | Address listed in the host header of the request. If rewritten using header rewrite, this field contains the updated host name. |
| originalRequestUriWithArgs | This field contains the original request URL. |
| requestUri | This field contains the URL after the rewrite operation on Application Gateway. |
| upstreamSourcePort | The source port used by Application Gateway when initiating a connection to the backend target. |
| originalHost | This field contains the original request host name. |
| error_info | The reason for the 4xx and 5xx error. Displays an error code for a failed request. More details in the error code tables in this article. |
| contentType | The type of content or data that is being processed or delivered by the application gateway. |
{
    "timeStamp": "2021-10-14T22:17:11+00:00",
    "resourceId": "/SUBSCRIPTIONS/{subscriptionId}/RESOURCEGROUPS/{resourceGroupName}/PROVIDERS/MICROSOFT.NETWORK/APPLICATIONGATEWAYS/{applicationGatewayName}",
    "listenerName": "HTTP-Listener",
    "ruleName": "Storage-Static-Rule",
    "backendPoolName": "StaticStorageAccount",
    "backendSettingName": "StorageStatic-HTTPS-Setting",
    "operationName": "ApplicationGatewayAccess",
    "category": "ApplicationGatewayAccessLog",
    "properties": {
        "instanceId": "appgw_2",
        "clientIP": "185.42.129.24",
        "clientPort": 45057,
        "httpMethod": "GET",
        "originalRequestUriWithArgs": "\/",
        "requestUri": "\/",
        "requestQuery": "",
        "userAgent": "Mozilla\/5.0 (Windows NT 6.1; WOW64) AppleWebKit\/537.36 (KHTML, like Gecko) Chrome\/52.0.2743.116 Safari\/537.36",
        "httpStatus": 200,
        "httpVersion": "HTTP\/1.1",
        "receivedBytes": 184,
        "sentBytes": 466,
        "clientResponseTime": 0,
        "timeTaken": 0.034,
        "WAFEvaluationTime": "0.000",
        "WAFMode": "Detection",
        "transactionId": "592d1649f75a8d480a3c4dc6a975309d",
        "sslEnabled": "on",
        "sslCipher": "ECDHE-RSA-AES256-GCM-SHA384",
        "sslProtocol": "TLSv1.2",
        "sslClientVerify": "NONE",
        "sslClientCertificateFingerprint": "",
        "sslClientCertificateIssuerName": "",
        "serverRouted": "52.239.221.65:443",
        "serverStatus": "200",
        "serverResponseLatency": "0.028",
        "upstreamSourcePort": "21564",
        "originalHost": "20.110.30.194",
        "host": "20.110.30.194",
        "error_info":"ERRORINFO_NO_ERROR",
        "contentType":"application/json"
    }
}
Note
Access logs with clientIP value 127.0.0.1 originate from an internal security process running on the application gateway instances. You can safely ignore these log entries.
For Application Gateway Standard and WAF SKU (v1):
| Value | Description |
|---|---|
| instanceId | Application Gateway instance that served the request. |
| clientIP | Originating IP for the request. |
| clientPort | Originating port for the request. |
| httpMethod | HTTP method used by the request. |
| requestUri | URI of the received request. |
| RequestQuery | Server-Routed: Backend pool instance that was sent the request. X-AzureApplicationGateway-LOG-ID: Correlation ID used for the request. It can be used to troubleshoot traffic issues on the backend servers. SERVER-STATUS: HTTP response code that Application Gateway received from the back end. |
| UserAgent | User agent from the HTTP request header. |
| httpStatus | HTTP status code returned to the client from Application Gateway. |
| httpVersion | HTTP version of the request. |
| receivedBytes | Size of packet received, in bytes. |
| sentBytes | Size of packet sent, in bytes. |
| timeTaken | Length of time (in milliseconds) that it takes for a request to be processed and its response to be sent. This value is calculated as the interval from the time when Application Gateway receives the first byte of an HTTP request to the time when the response send operation finishes. It's important to note that the Time-Taken field usually includes the time that the request and response packets are traveling over the network. |
| sslEnabled | Whether communication to the backend pools used TLS/SSL. Valid values are on and off. |
| host | The hostname for which the request has been sent to the backend server. If backend hostname is being overridden, this name reflects that. |
| originalHost | The hostname for which the request was received by the Application Gateway from the client. |
{
    "resourceId": "/SUBSCRIPTIONS/{subscriptionId}/RESOURCEGROUPS/PEERINGTEST/PROVIDERS/MICROSOFT.NETWORK/APPLICATIONGATEWAYS/{applicationGatewayName}",
    "operationName": "ApplicationGatewayAccess",
    "time": "2017-04-26T19:27:38Z",
    "category": "ApplicationGatewayAccessLog",
    "properties": {
        "instanceId": "ApplicationGatewayRole_IN_0",
        "clientIP": "203.0.113.97",
        "clientPort": 46886,
        "httpMethod": "GET",
        "requestUri": "/phpmyadmin/scripts/setup.php",
        "requestQuery": "X-AzureApplicationGateway-CACHE-HIT=0&SERVER-ROUTED=10.4.0.4&X-AzureApplicationGateway-LOG-ID=aaaa0000-bb11-2222-33cc-444444dddddd&SERVER-STATUS=404",
        "userAgent": "-",
        "httpStatus": 404,
        "httpVersion": "HTTP/1.0",
        "receivedBytes": 65,
        "sentBytes": 553,
        "timeTaken": 205,
        "sslEnabled": "off",
        "host": "www.contoso.com",
        "originalHost": "www.contoso.com"
    }
}
If the application gateway can't complete the request, it stores one of the following reason codes in the error_info field of the access log.
| 4XX Errors | The 4xx error codes indicate that there was an issue with the client's request, and the Application Gateway can't fulfill it. |
|---|---|
| ERRORINFO_INVALID_METHOD | The client sent a request that is non-RFC compliant. Possible reasons: client using HTTP method not supported by server, misspelled method, incompatible HTTP protocol version etc. |
| ERRORINFO_INVALID_REQUEST | The server can't fulfill the request because of incorrect syntax. |
| ERRORINFO_INVALID_VERSION | The application gateway received a request with an invalid or unsupported HTTP version. |
| ERRORINFO_INVALID_09_METHOD | The client sent request with HTTP Protocol version 0.9. |
| ERRORINFO_INVALID_HOST | The value provided in the "Host" header is either missing, improperly formatted, or doesn't match the expected host value. For example, when there's no Basic listener, and none of the hostnames of Multisite listeners match with the host. |
| ERRORINFO_INVALID_CONTENT_LENGTH | The length of the content specified by the client in the content-Length header doesn't match the actual length of the content in the request. |
| ERRORINFO_INVALID_METHOD_TRACE | The client sent HTTP TRACE method, which the application gateway doesn't support. |
| ERRORINFO_CLIENT_CLOSED_REQUEST | The client closed the connection with the application gateway before the idle timeout period elapsed. Check whether the client timeout period is greater than the idle timeout period for the application gateway. |
| ERRORINFO_REQUEST_URI_INVALID | Indicates issue with the Uniform Resource Identifier (URI) provided in the client's request. |
| ERRORINFO_HTTP_NO_HOST_HEADER | Client sent a request without Host header. |
| ERRORINFO_HTTP_TO_HTTPS_PORT | The client sent a plain HTTP request to an HTTPS port. |
| ERRORINFO_HTTPS_NO_CERT | Indicates client isn't sending a valid and properly configured TLS certificate during Mutual TLS authentication. |
| 5XX Errors | Description |
|---|---|
| ERRORINFO_UPSTREAM_NO_LIVE | The application gateway is unable to find any active or reachable backend servers to handle incoming requests. |
| ERRORINFO_UPSTREAM_CLOSED_CONNECTION | The backend server closed the connection unexpectedly or before the request was fully processed. This condition could happen due to backend server reaching its limits, crashing etc. |
| ERRORINFO_UPSTREAM_TIMED_OUT | The established TCP connection with the server was closed as the connection took longer than the configured timeout value. |
Firewall log category
The firewall log is generated only if you enable it for each application gateway, as detailed in Enable logging. This log also requires that the web application firewall is configured on an application gateway. The data is stored in the storage account that you specified when you enabled the logging. The following data is logged:
| Value | Description |
|---|---|
| instanceId | Application Gateway instance for which firewall data is being generated. For a multiple-instance application gateway, there's one row per instance. |
| clientIp | Originating IP for the request. |
| clientPort | Originating port for the request. |
| requestUri | URL of the received request. |
| ruleSetType | Rule set type. The available value is OWASP. |
| ruleSetVersion | Rule set version used. Available values are 2.2.9 and 3.0. |
| ruleId | Rule ID of the triggering event. |
| message | User-friendly message for the triggering event. More details are provided in the details section. |
| action | Action taken on the request. Available values are Blocked and Allowed (for custom rules), Matched (when a rule matches a part of the request), and Detected and Blocked (these values are both for mandatory rules, depending on if the WAF is in detection or prevention mode). |
| site | Site for which the log was generated. Currently, only Global is listed because rules are global. |
| details | Details of the triggering event. |
| details.message | Description of the rule. |
| details.data | Specific data found in request that matched the rule. |
| details.file | Configuration file that contained the rule. |
| details.line | Line number in the configuration file that triggered the event. |
| hostname | Hostname or IP address of the Application Gateway. |
| transactionId | Unique ID for a given transaction, which helps group multiple rule violations that occurred within the same request. |
{
    "timeStamp": "2021-10-14T22:17:11+00:00",
    "resourceId": "/SUBSCRIPTIONS/{subscriptionId}/RESOURCEGROUPS/{resourceGroupName}/PROVIDERS/MICROSOFT.NETWORK/APPLICATIONGATEWAYS/{applicationGatewayName}",
    "operationName": "ApplicationGatewayFirewall",
    "category": "ApplicationGatewayFirewallLog",
    "properties": {
        "instanceId": "appgw_2",
        "clientIp": "185.42.129.24",
        "clientPort": "",
        "requestUri": "\/",
        "ruleSetType": "OWASP_CRS",
        "ruleSetVersion": "3.0.0",
        "ruleId": "920350",
        "message": "Host header is a numeric IP address",
        "action": "Matched",
        "site": "Global",
        "details": {
            "message": "Warning. Pattern match \\\"^[\\\\d.:]+$\\\" at REQUEST_HEADERS:Host .... ",
            "data": "20.110.30.194:80",
            "file": "rules\/REQUEST-920-PROTOCOL-ENFORCEMENT.conf",
            "line": "791"
        },
        "hostname": "20.110.30.194:80",
        "transactionId": "592d1649f75a8d480a3c4dc6a975309d",
        "policyId": "default",
        "policyScope": "Global",
        "policyScopeName": "Global"
    }
}
Performance log category
The performance log is generated only if you enable it on each Application Gateway instance, as detailed in Enable logging. The data is stored in the storage account that you specified when you enabled the logging. The performance log data is generated in 1-minute intervals. It's available only for the v1 SKU. For the v2 SKU, use Metrics for performance data. The following data is logged:
| Value | Description |
|---|---|
| instanceId | Application Gateway instance for which performance data is being generated. For a multiple-instance application gateway, there's one row per instance. |
| healthyHostCount | Number of healthy hosts in the backend pool. |
| unHealthyHostCount | Number of unhealthy hosts in the backend pool. |
| requestCount | Number of requests served. |
| latency | Average latency (in milliseconds) of requests from the instance to the back end that serves the requests. |
| failedRequestCount | Number of failed requests. |
| throughput | Average throughput since the last log, measured in bytes per second. |
{
    "resourceId": "/SUBSCRIPTIONS/{subscriptionId}/RESOURCEGROUPS/{resourceGroupName}/PROVIDERS/MICROSOFT.NETWORK/APPLICATIONGATEWAYS/{applicationGatewayName}",
    "operationName": "ApplicationGatewayPerformance",
    "time": "2016-04-09T00:00:00Z",
    "category": "ApplicationGatewayPerformanceLog",
    "properties":
    {
        "instanceId":"ApplicationGatewayRole_IN_1",
        "healthyHostCount":"4",
        "unHealthyHostCount":"0",
        "requestCount":"185",
        "latency":"0",
        "failedRequestCount":"0",
        "throughput":"119427"
    }
}
Note
Latency is calculated from the time when the first byte of the HTTP request is received to the time when the last byte of the HTTP response is sent. It's the sum of the Application Gateway processing time plus the network cost to the back end, plus the time that the back end takes to process the request.
Azure Monitor Logs and Log Analytics Tables
Azure Application Gateway uses the Azure Diagnostics table to store resource log information. The following columns are relevant.
| Property | Description |
|---|---|
| requestUri_s | The URI of the client request. |
| Message | Informational messages such as "SQL Injection Attack" |
| userAgent_s | User agent details of the client request |
| ruleName_s | Request routing rule that is used to serve this request |
| httpMethod_s | HTTP method of the client request |
| instanceId_s | The Appgw instance to which the client request is routed to for evaluation |
| httpVersion_s | HTTP version of the client request |
| clientIP_s | IP from which is request is made |
| host_s | Host header of the client request |
| requestQuery_s | Query string as part of the client request |
| sslEnabled_s | Does the client request have SSL enabled |
Azure Monitor Logs tables
This section lists the Azure Monitor Logs tables relevant to this service, which are available for query by Log Analytics using Kusto queries. The tables contain resource log data and possibly more depending on what is collected and routed to them.
Application Gateway Microsoft.Network/applicationGateways
TLS/TCP proxy logs
Application Gateway's Layer 4 proxy provides log data through access logs. These logs are only generated and published if they're configured in the diagnostic settings of your gateway. Also see: Supported categories for Azure Monitor resource logs.
Note
The columns with Mutual Authentication details for a TLS listener are currently available only through the AzureDiagnostics table.
| Category | Resource log category |
|---|---|
| ResourceGroup | The resource group to which the application gateway resource belongs. |
| SubscriptionId | The subscription ID of the application gateway resource. |
| ResourceProvider | This value is MICROSOFT.NETWORK for application gateway. |
| Resource | The name of the application gateway resource. |
| ResourceType | This value is APPLICATIONGATEWAYS. |
| ruleName | The name of the routing rule that served the connection request. |
| instanceId | Application Gateway instance that served the request. |
| clientIP | Originating IP for the request. |
| receivedBytes | Data received from client to gateway, in bytes. |
| sentBytes | Data sent from gateway to client, in bytes. |
| listenerName | The name of the listener that established the frontend connection with client. |
| backendSettingName | The name of the backend setting used for the backend connection. |
| backendPoolName | The name of the backend pool from which a target server was selected to establish the backend connection. |
| protocol | TCP (Irrespective of it being TCP or TLS, the protocol value is always TCP). |
| sessionTime | Session duration, in seconds (this value is for the client->appgw session). |
| upstreamSentBytes | Data sent to backend server, in bytes. |
| upstreamReceivedBytes | Data received from backend server, in bytes. |
| upstreamSessionTime | Session duration, in seconds (this value is for the appgw->backend session). |
| sslCipher | Cipher suite being used for TLS communication (for TLS protocol listeners). |
| sslProtocol | SSL/TLS protocol being used (for TLS protocol listeners). |
| serverRouted | The backend server IP and port number to which the traffic was routed. |
| serverStatus | 200 - session completed successfully. 400 - client data couldn't be parsed. 500 - internal server error. 502 - bad gateway. For example, when an upstream server couldn't be reached. 503 - service unavailable. For example, if access is limited by the number of connections. |
| ResourceId | Application Gateway resource URI. |
Activity log
The linked table lists the operations that can be recorded in the activity log for this service. These operations are a subset of all the possible resource provider operations in the activity log.
For more information on the schema of activity log entries, see Activity Log schema.
You can use Azure activity logs to view all operations that are submitted to your Azure subscription, and their status. Activity log entries are collected by default. You can view them in the Azure portal. Azure activity logs were formerly known as operational logs and audit logs.
Azure generates activity logs by default. The logs are preserved for 90 days in the Azure event logs store. Learn more about these logs by reading the View events and activity log article.
Related content
- See Monitor Azure Application Gateway for a description of monitoring Application Gateway.
- See Monitor Azure resources with Azure Monitor for details on monitoring Azure resources.