Management and monitoring for Azure Arc-enabled SQL Managed Instance
This article provides key design considerations and recommendations for managing and monitoring Azure Arc-enabled SQL Managed Instance clusters to help you understand and design solutions for operational excellence. Use the guidance in this article, and in other critical design information that it references, to better understand the considerations and recommendations.
Architecture
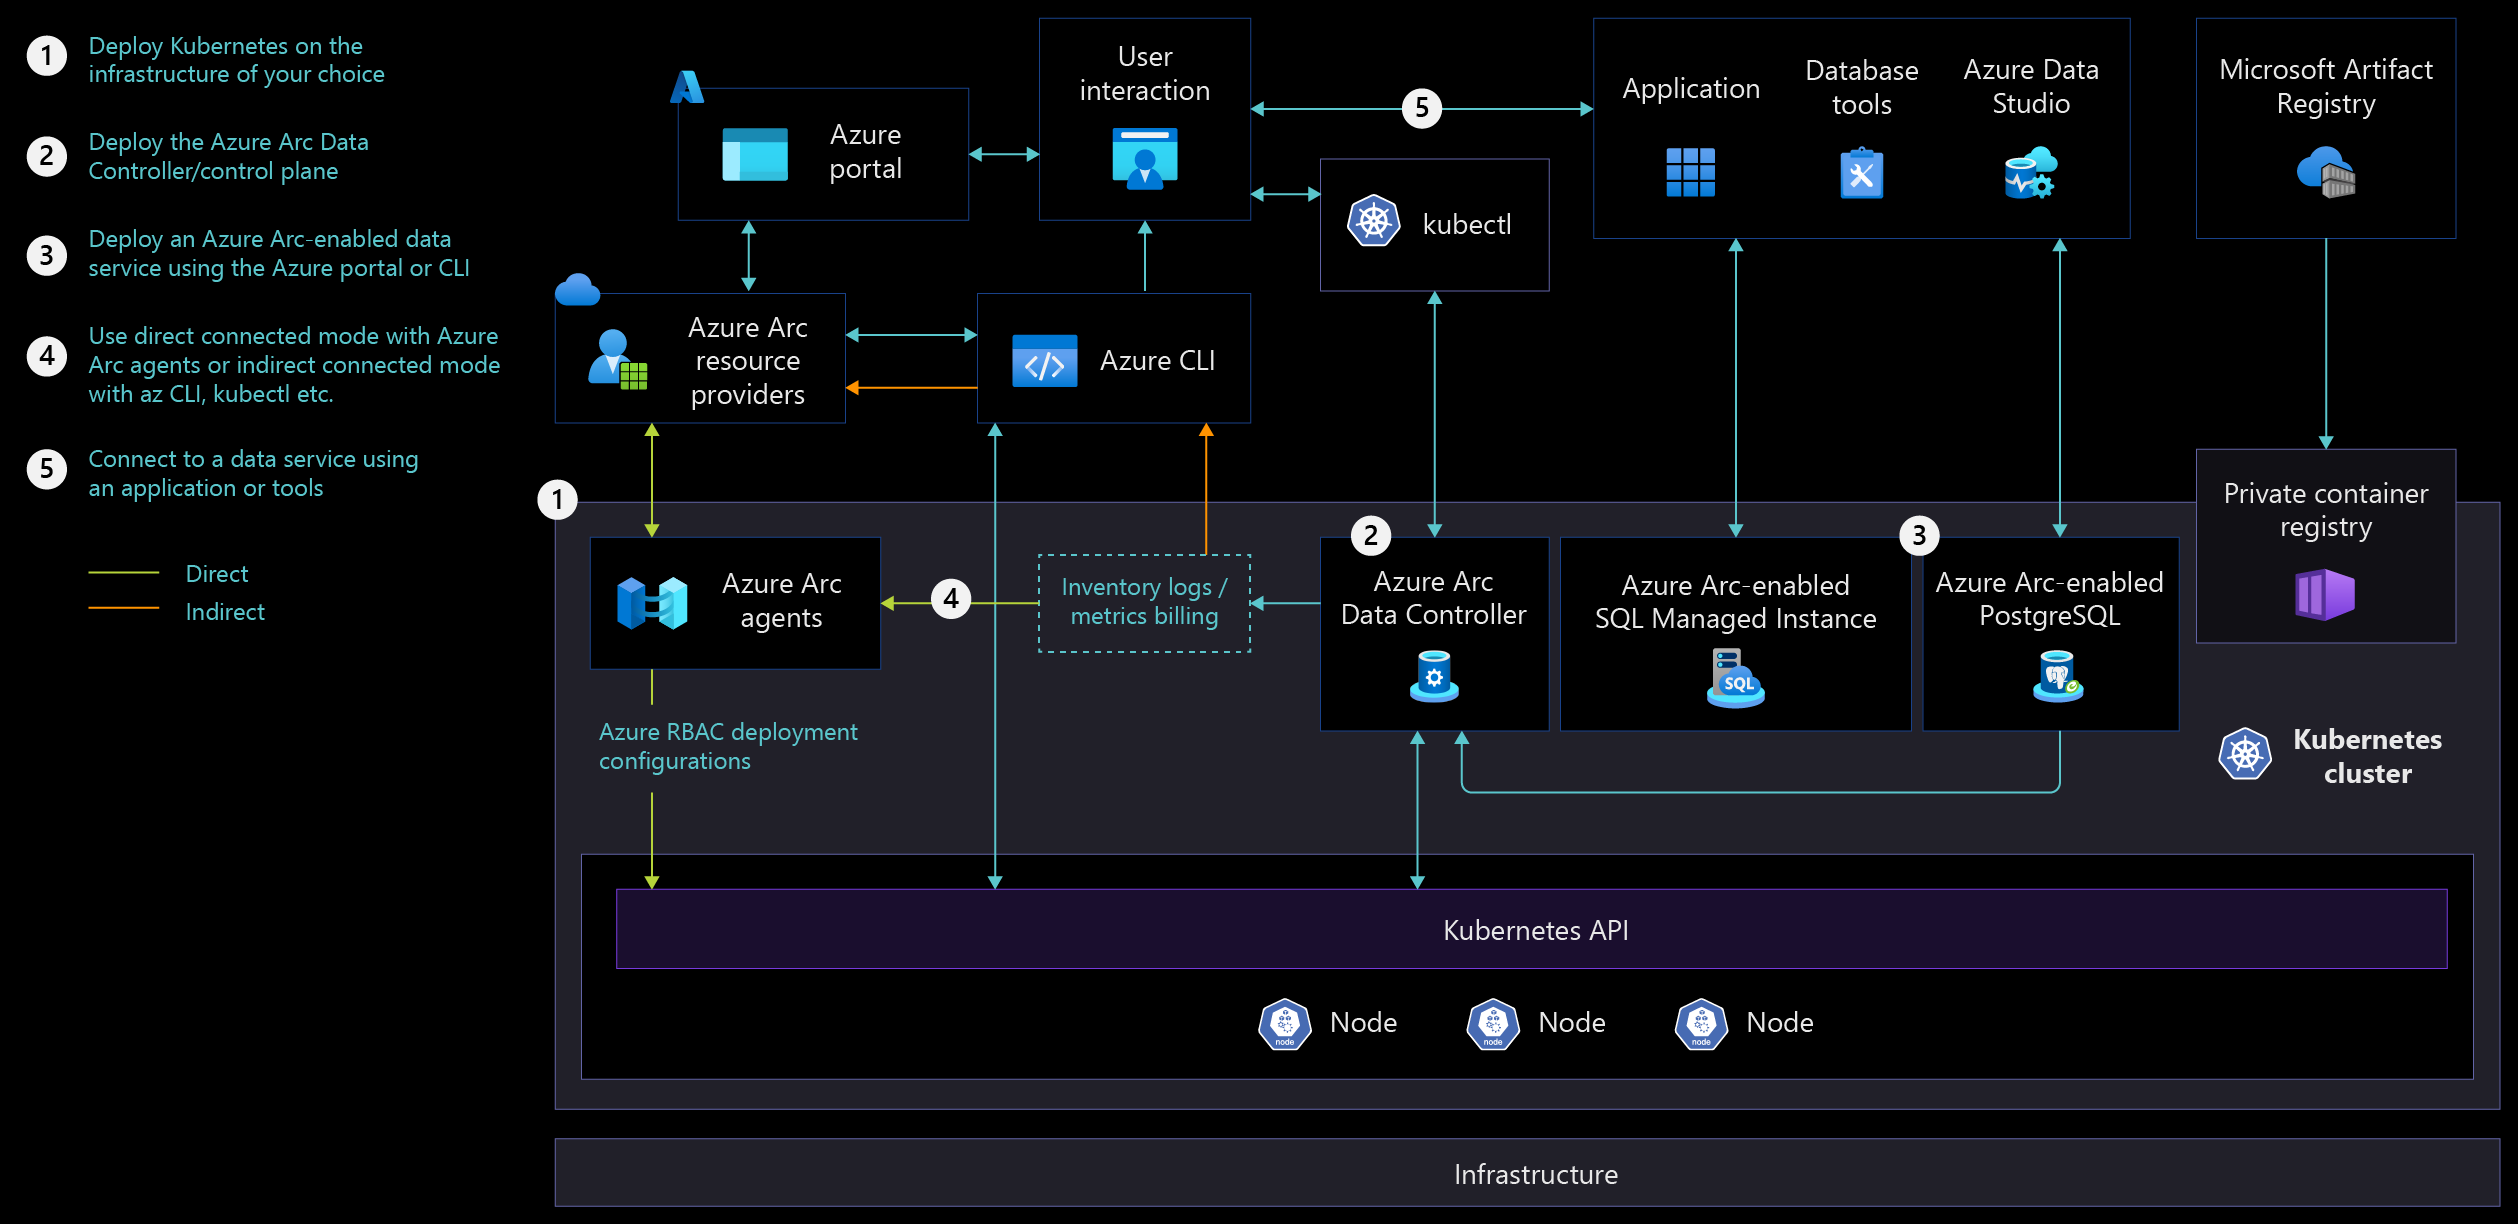
To build the right architecture for your organization to onboard Kubernetes clusters on-premises or in the public cloud, you need a broad understanding of Azure Arc-enabled Kubernetes network architecture and network connectivity for Azure Arc-enabled data services, specifically concerning the two connectivity modes.
Cluster management
To understand cluster management principles for the underlying Kubernetes cluster, review the Cloud Adoption Framework (CAF) design considerations and recommendations for Azure Arc-enabled Kubernetes before you deploy Azure Arc-enabled SQL Managed Instance.
Cluster monitoring
Azure Arc-enabled data services provide two connectivity modes: directly connected and indirectly connected. In either mode, you can integrate Grafana and Kibana, two open-source tools, into the cluster for monitoring. Directly connected mode supports using the dashboards of both Grafana and Kibana, in addition to Azure Monitor.
To understand the connectivity modes, see Network connectivity for Azure Arc-enabled SQL Managed Instance.
Design considerations
To understand the role of Azure Arc-enabled Kubernetes on your overall management design, and the considerations and recommendations for the design of landing zones, see Design area: Management for Azure environments.
Cluster monitoring
Consider your organization's preferred monitoring tools when evaluating how to monitor your deployment.
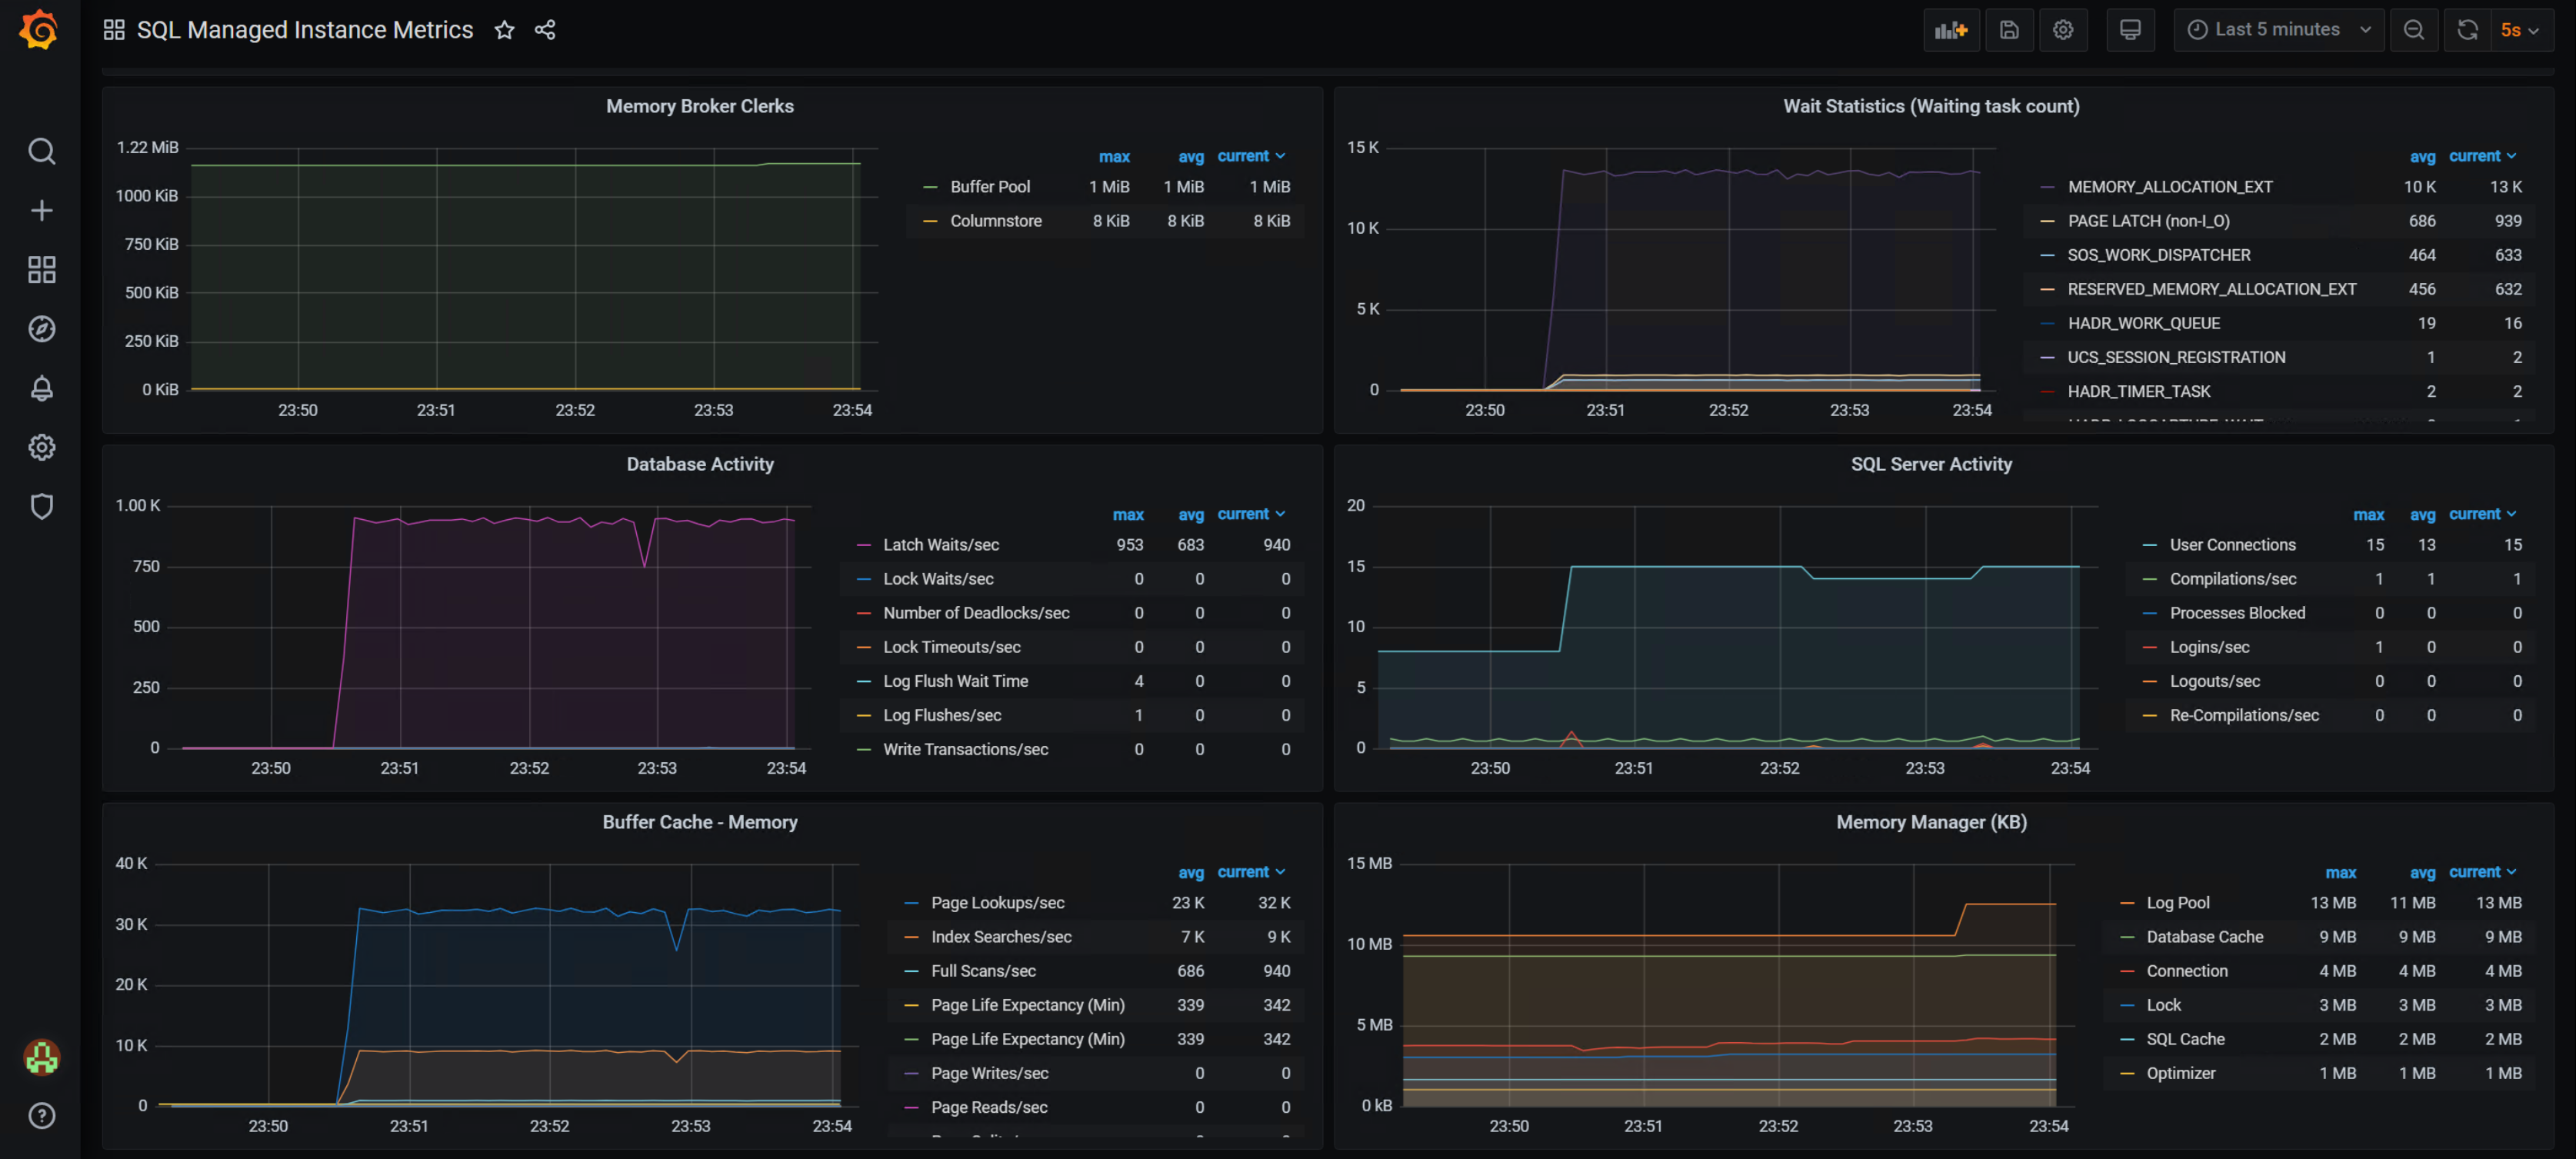
Azure Arc-enabled SQL Managed Instance offers integration with popular open-source monitoring tools, like Grafana and Kibana. In addition, metrics and logs are visible within Azure Monitor.
Grafana and Kibana are installed and configured automatically, which can provide easier deployment and reduced effort for your organization.
For cluster-level monitoring within Azure Monitor, you can use Azure Policy to deploy Container insights. Consider how Azure Policy factors into your organization's deployments.
Directly connected mode
When you deploy Azure Arc-enabled SQL Managed Instance in directly connected mode, Azure automatically receives metadata about your cluster for inventory and billing purposes.
All traffic is initiated from the cluster, and the firewall requires no inbound rules to facilitate this.
During deployment of Azure Arc Data Controller, you can have logs and metrics automatically uploaded to an Azure Log Analytics workspace by providing the workspace ID and access key. After deployment, you can retain or disable this functionality.
Indirectly connected mode
When you deploy Arc-enabled SQL Managed Instance indirectly connected mode, there's no direct connection to Azure.
When you when plan to deploy an instance in indirectly connected mode, consider how to upload logs and metadata about the instance from the cluster to Azure. Consider how to automate this process. For more information, see Upload logs to Azure Monitor.
At least once per month, you must upload metadata about the instance to Azure for inventory and billing purposes. For more information about this, see Azure Arc data services data collection and reporting.
Design recommendations
Wherever possible, use the directly connected mode, because it makes monitoring through Azure easier. However, directly connected mode isn't suitable for all scenarios. For more information, see Connectivity modes and requirements.
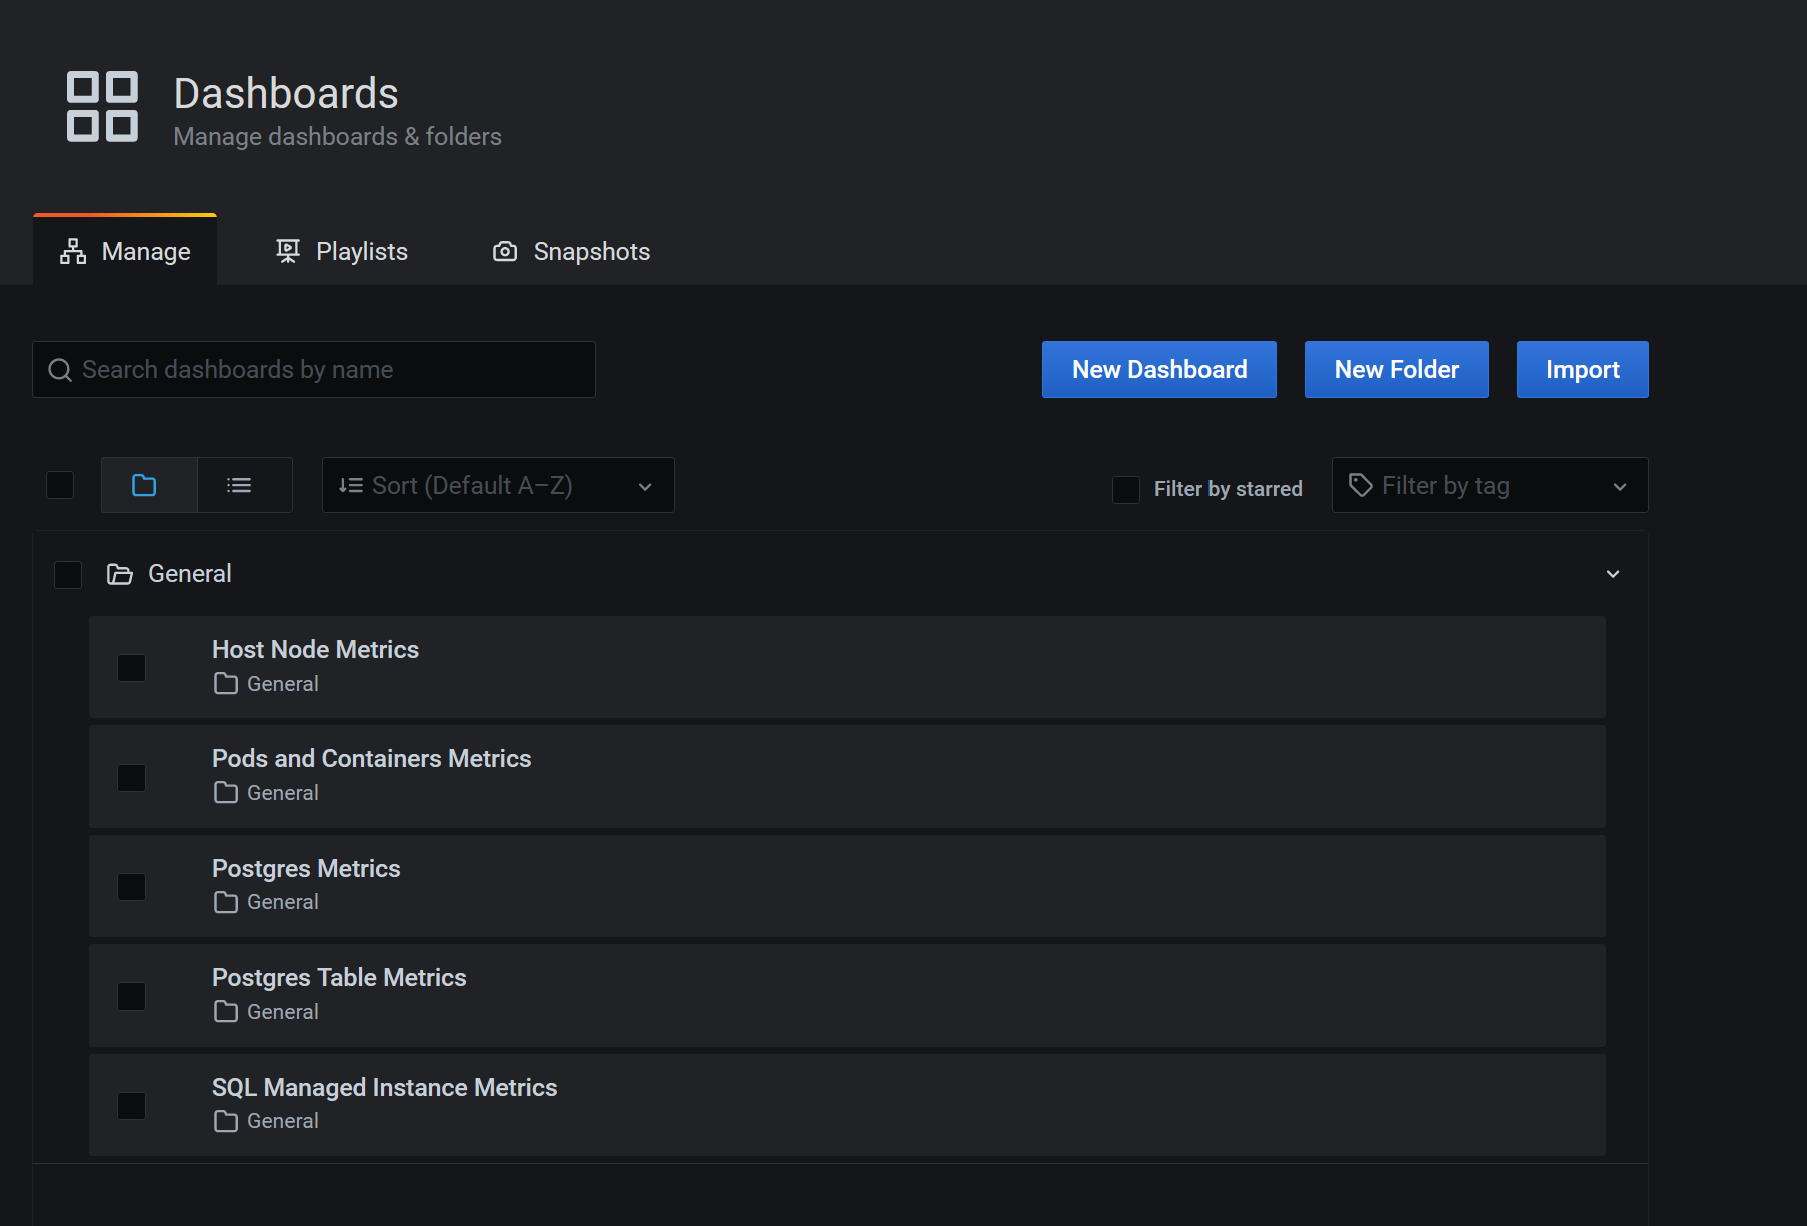
Use Grafana and Kibana if your organization already uses these tools. Grafana and Kibana are open-source tools that are automatically deployed and integrated with deployments of Azure Arc-enabled SQL Managed Instance.
Collect logs and metrics by using Azure Monitor Container insights for Azure Arc-enabled Kubernetes clusters. Use these logs and metrics to create dashboards and generate alerts for cluster-related issues.
To receive notifications from Azure Monitor about the cluster, enable recommended metric alerts from Container insights.
Use Azure Policy to ensure that Container Insights is deployed automatically.
For an easy, out-of-the-box experience for monitoring, use the workbooks that are available in Container insights to view performance and health information about your cluster and components such as nodes, pods, and persistent volumes. When you're familiar with the workbooks, design a custom workbook that illustrates the data in a way that's most useful to your operations. For more information about workbooks, see Reports in Container insights.
Review the included Grafana dashboards to see what's provided out-of-the-box to avoid duplication of effort.
To monitor cluster health and raise alerts, use Azure Resource Graph or Log Analytics queries.
To strategize how best to organize Log Analytics workspaces based on business needs and organization, see Design a Log Analytics workspace architecture.
Because of the importance of storage on the various components in a deployment of Azure Arc-enabled SQL Managed Instance, establish dashboards and alerts on the health and capacity of local and remote storage. For more information about storage, see Storage disciplines for Azure Arc-enabled SQL Managed Instance.
Review considerations and recommendations for managing upgrades in Upgradeability disciplines for Azure Arc-enabled SQL Managed Instance.
If your deployment uses indirectly connected mode, implement an automated mechanism, such as a cron job, to upload usage data, logs, and metrics on a daily basis. Uploading logs and metrics are optional, but doing so is required to be able to use Azure Monitor to monitor your environment.
Implement a process to verify that usage and billing data is uploaded at least once per month to ensure that the ability to create new instances isn't disabled.
Next steps
For more information about your hybrid and multicloud cloud journey, see the following articles:
- Connectivity modes and requirements
- Azure Data Studio dashboards to view information about your Azure Arc resources
- Azure Arc Jumpstart for automated scenarios with Azure Arc Jumpstart
- Bring Azure innovation to your hybrid environments with Azure Arc, a learning path from Microsoft Learn


