Note
Access to this page requires authorization. You can try signing in or changing directories.
Access to this page requires authorization. You can try changing directories.
Alerts in Azure Monitor proactively identify issues related to the health and performance of your Azure resources. This article describes how to enable and edit a set of recommended metric alert rules that are predefined for your Kubernetes clusters.
Enable recommended alert rules
Use one of the following methods to enable the recommended alert rules for your cluster. You can enable both Prometheus and platform metric alert rules for the same cluster.
Note
Recommended alerts for Arc-enabled Kubernetes clusters are in Preview and do not support Platform metric alert rules.
Using the Azure portal, the Prometheus rule group will be created in the same region as the cluster.
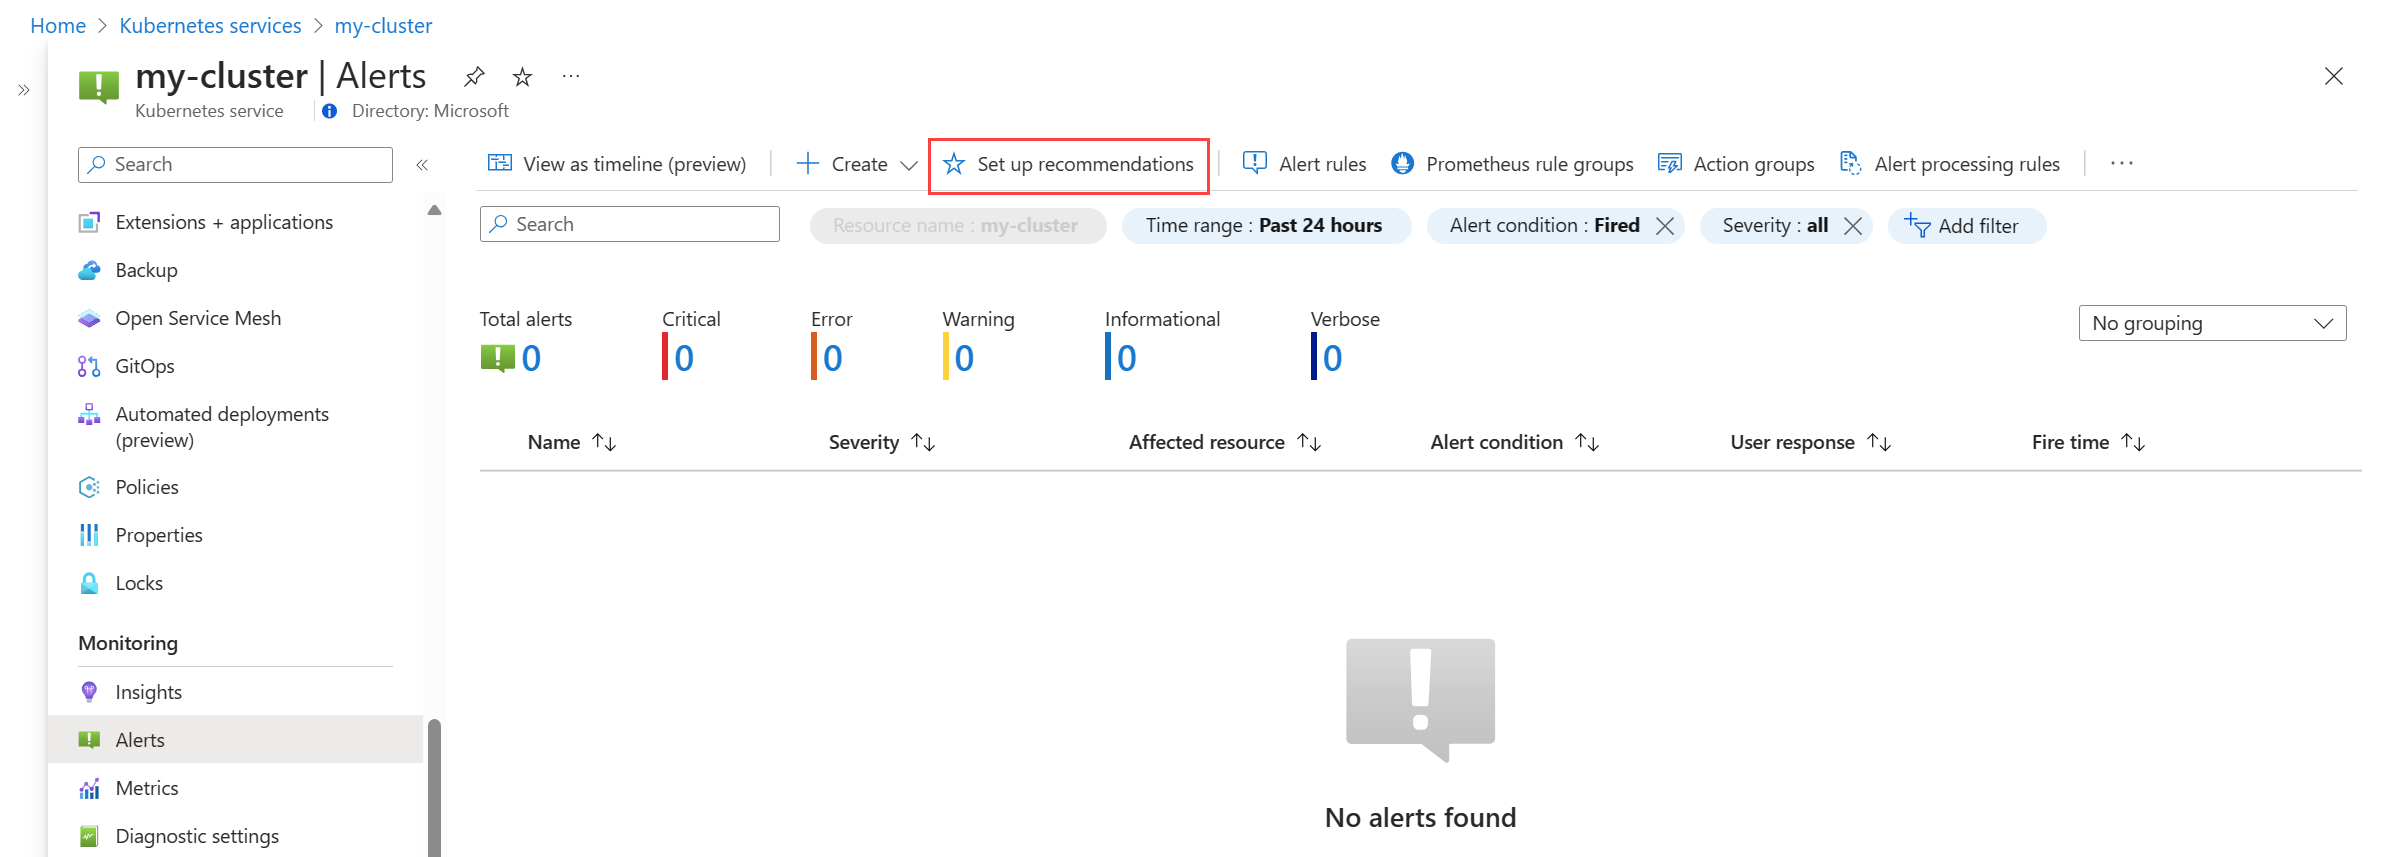
From the Alerts menu for your cluster, select Set up recommendations.
The available Prometheus and platform alert rules are displayed with the Prometheus rules organized by pod, cluster, and node level. Toggle a group of Prometheus rules to enable that set of rules. Expand the group to see the individual rules. You can leave the defaults or disable individual rules and edit their name and severity.
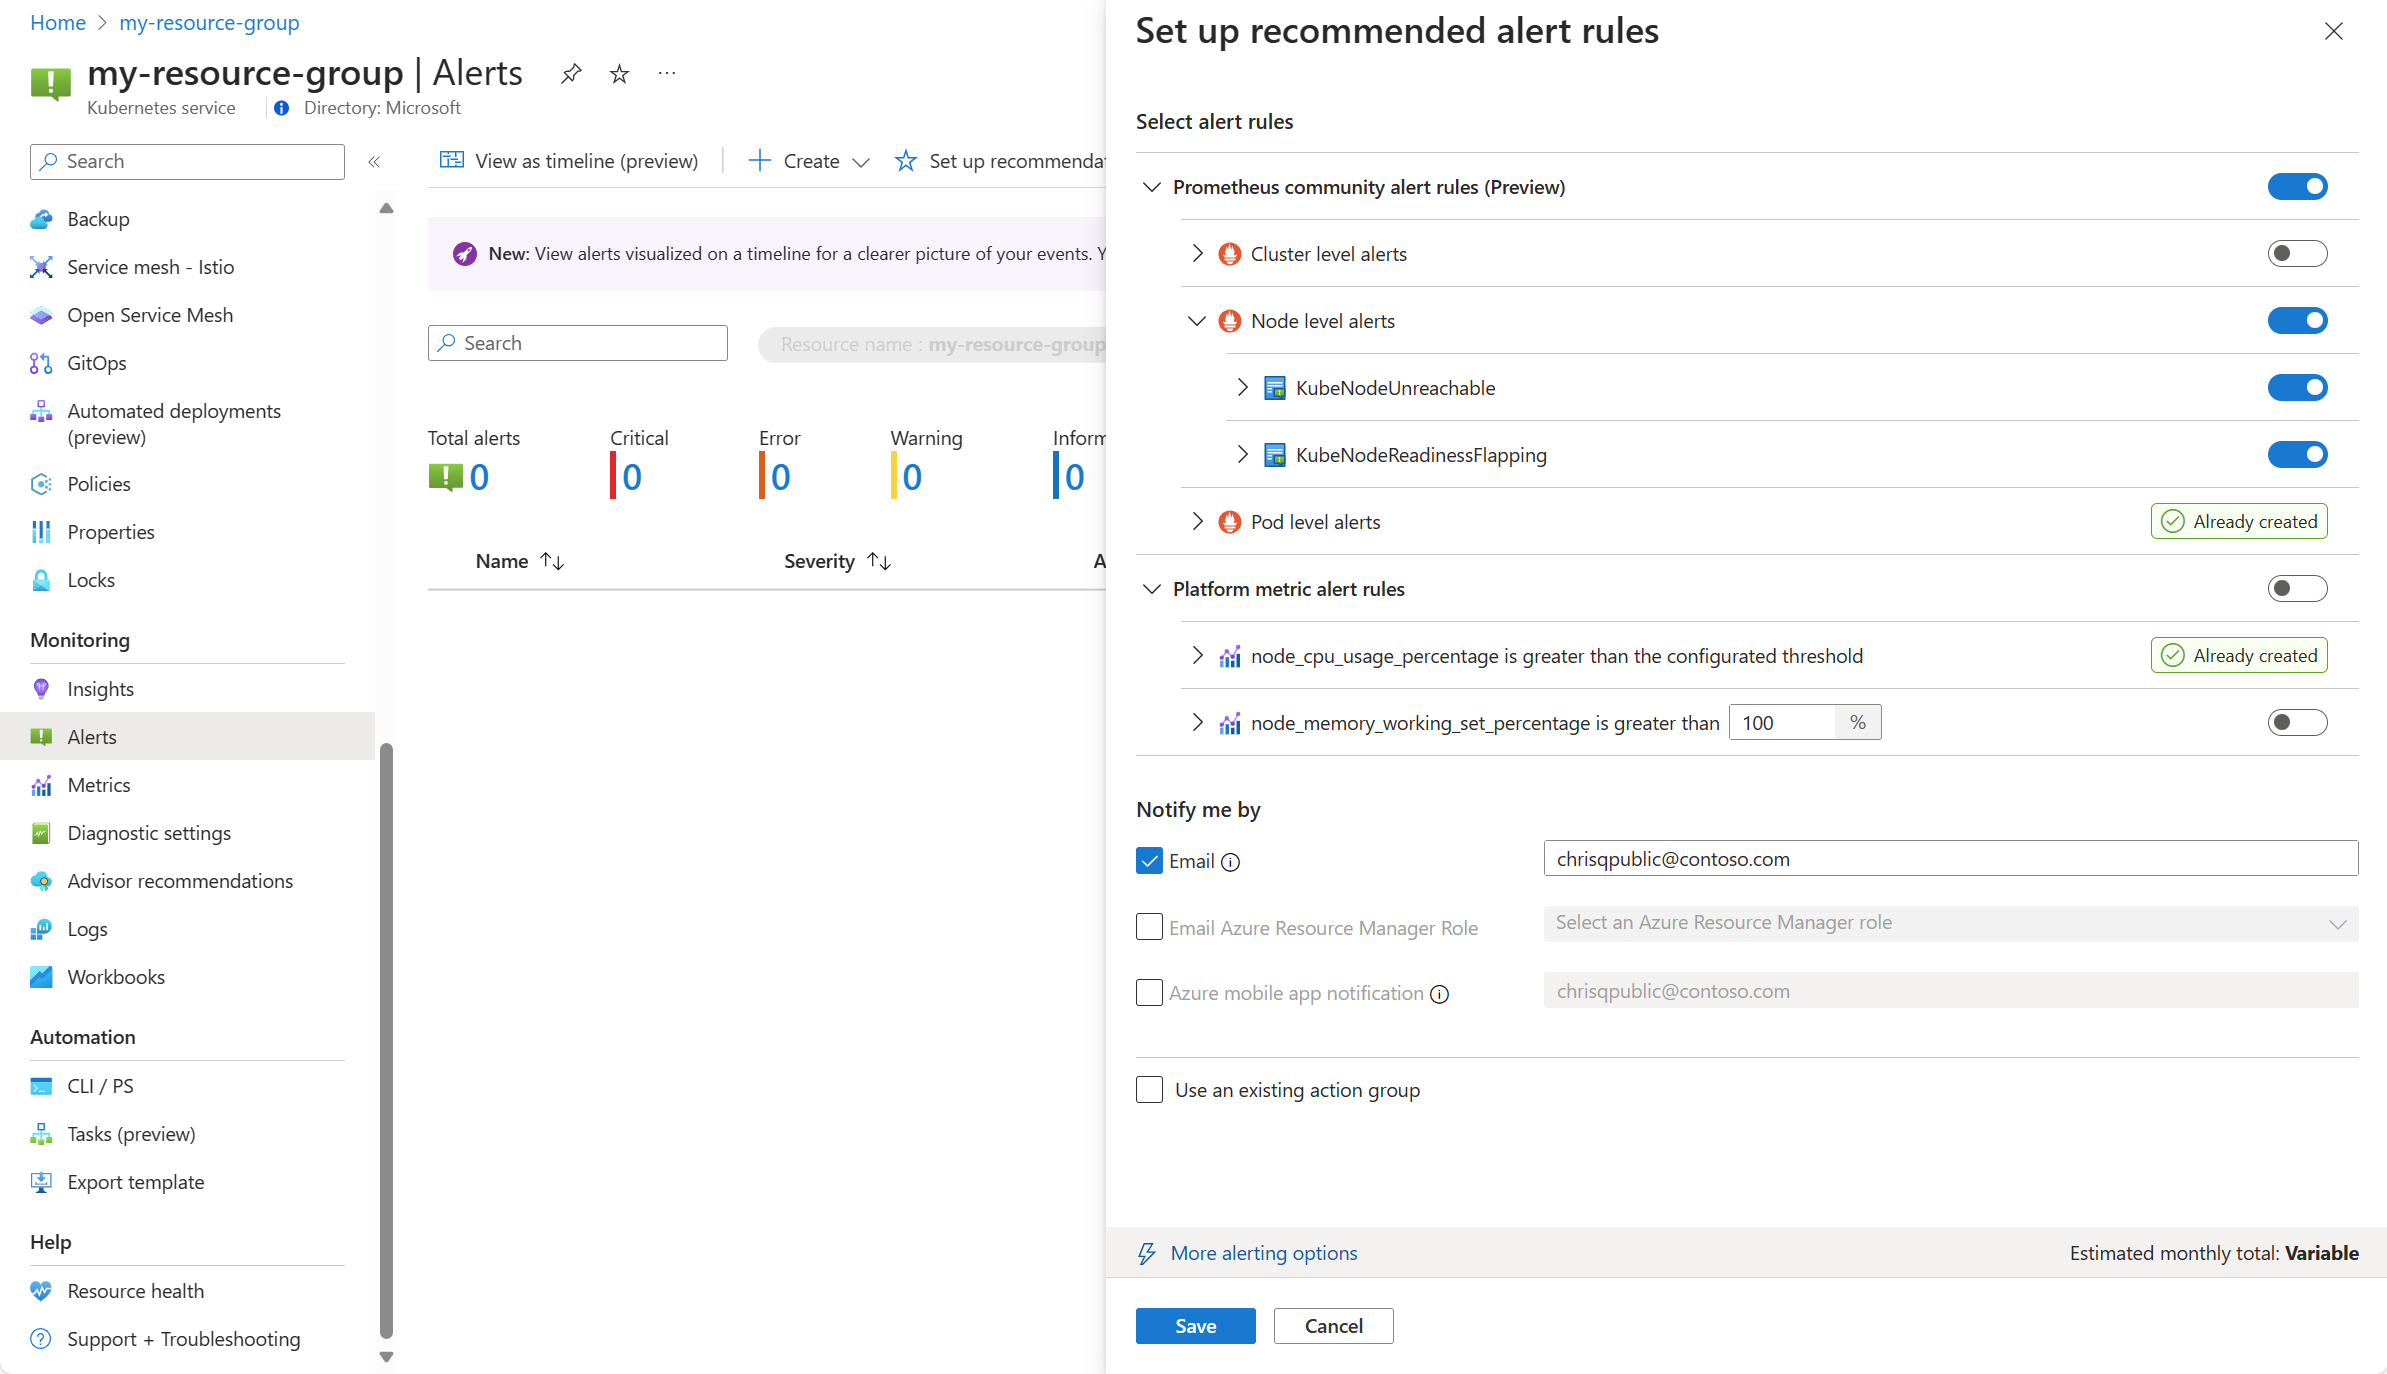
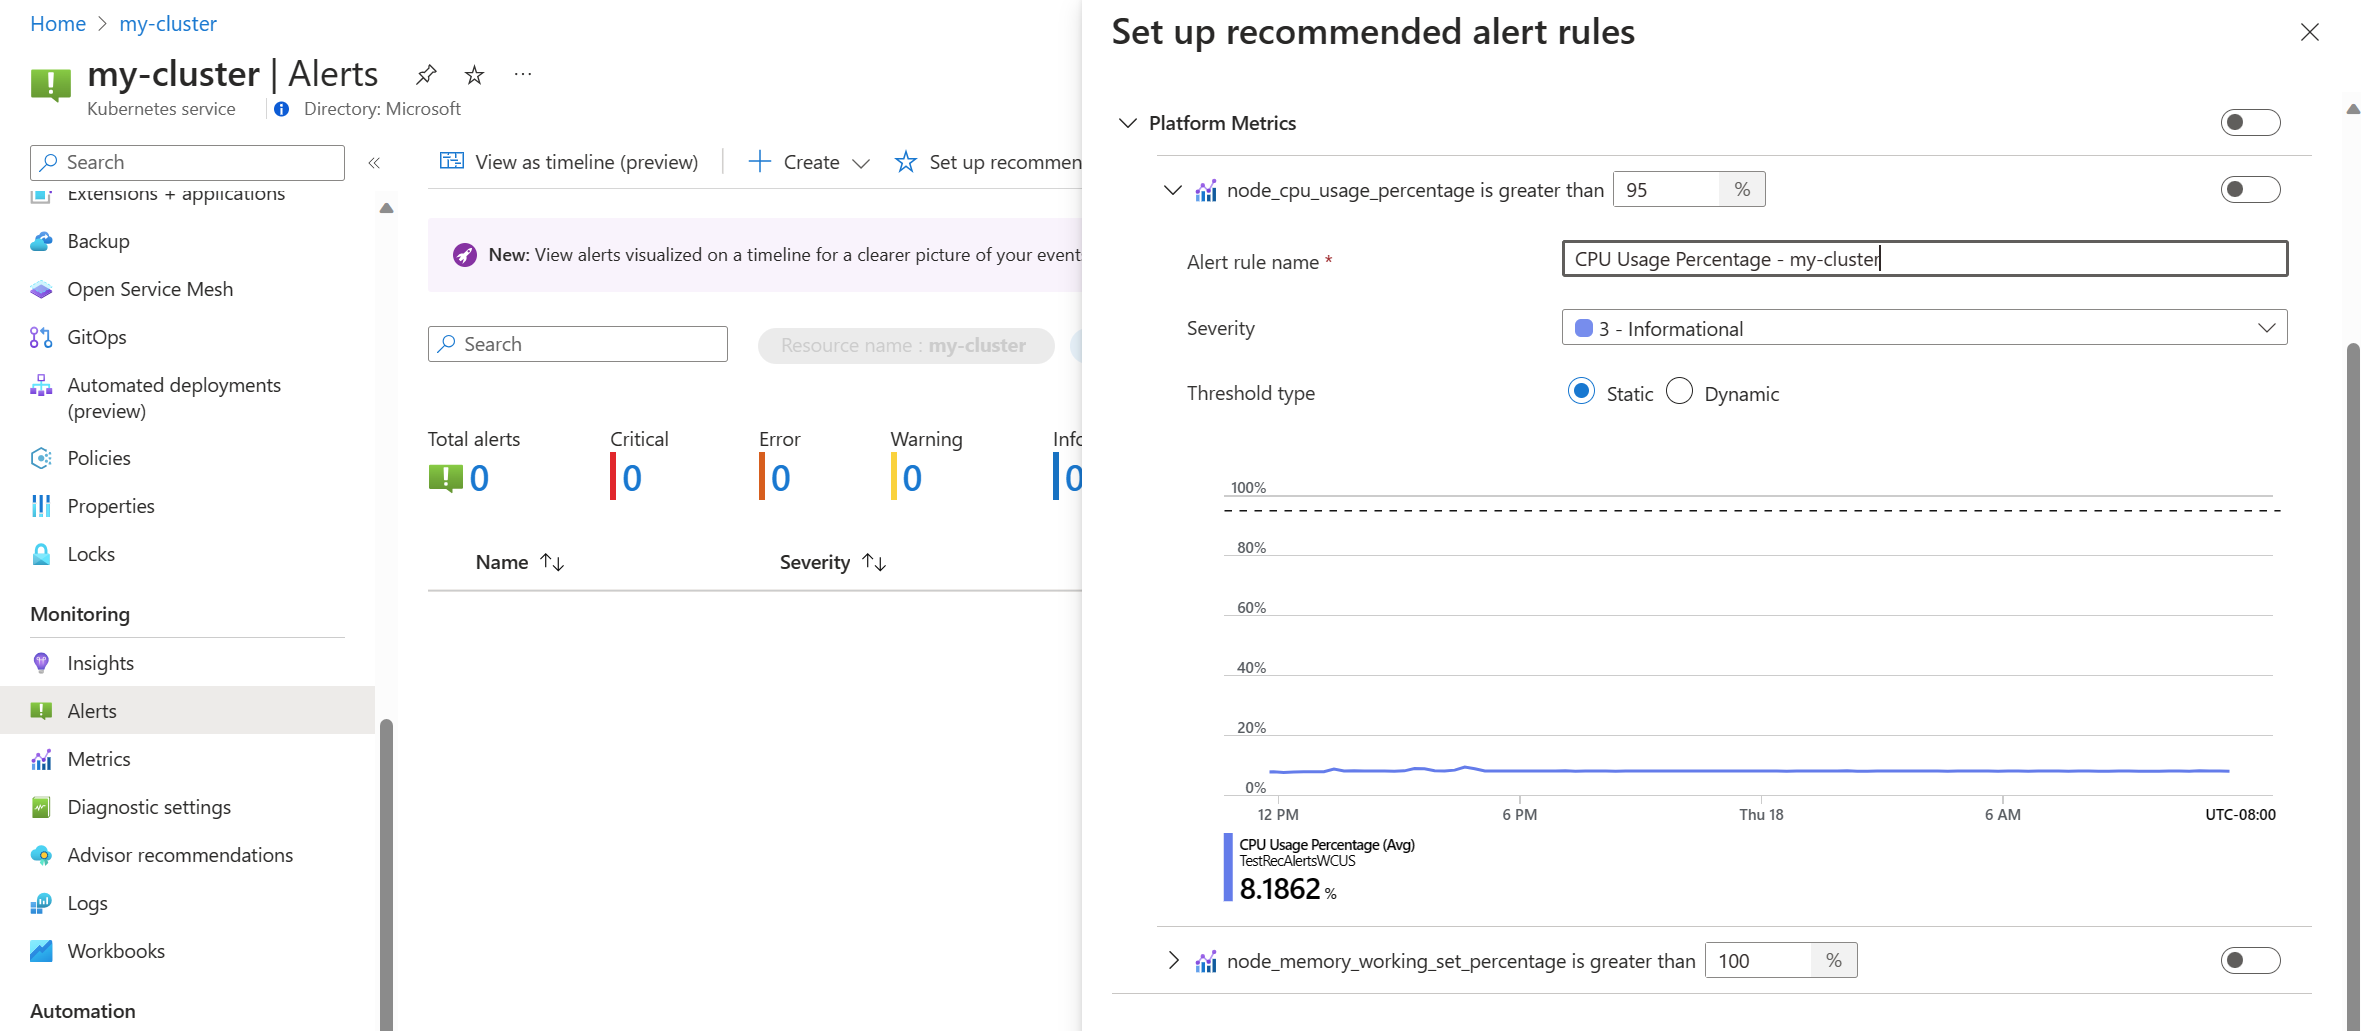
Toggle a platform metric rule to enable that rule. You can expand the rule to modify its details such as the name, severity, and threshold.
Either select one or more notification methods to create a new action group, or select an existing action group with the notification details for this set of alert rules.
Click Save to save the rule group.


Edit recommended alert rules
Once the rule group has been created, you can't use the same page in the portal to edit the rules. For Prometheus metrics, you must edit the rule group to modify any rules in it, including enabling any rules that weren't already enabled. For platform metrics, you can edit each alert rule.
From the Alerts menu for your cluster, select Set up recommendations. Any rules or rule groups that have already been created will be labeled as Already created.
Expand the rule or rule group. Click on View rule group for Prometheus and View alert rule for platform metrics.

For Prometheus rule groups:
select Rules to view the alert rules in the group.
Click the Edit icon next a rule that you want to modify. Use the guidance in Create an alert rule to modify the rule.

When you're done editing rules in the group, click Save to save the rule group.
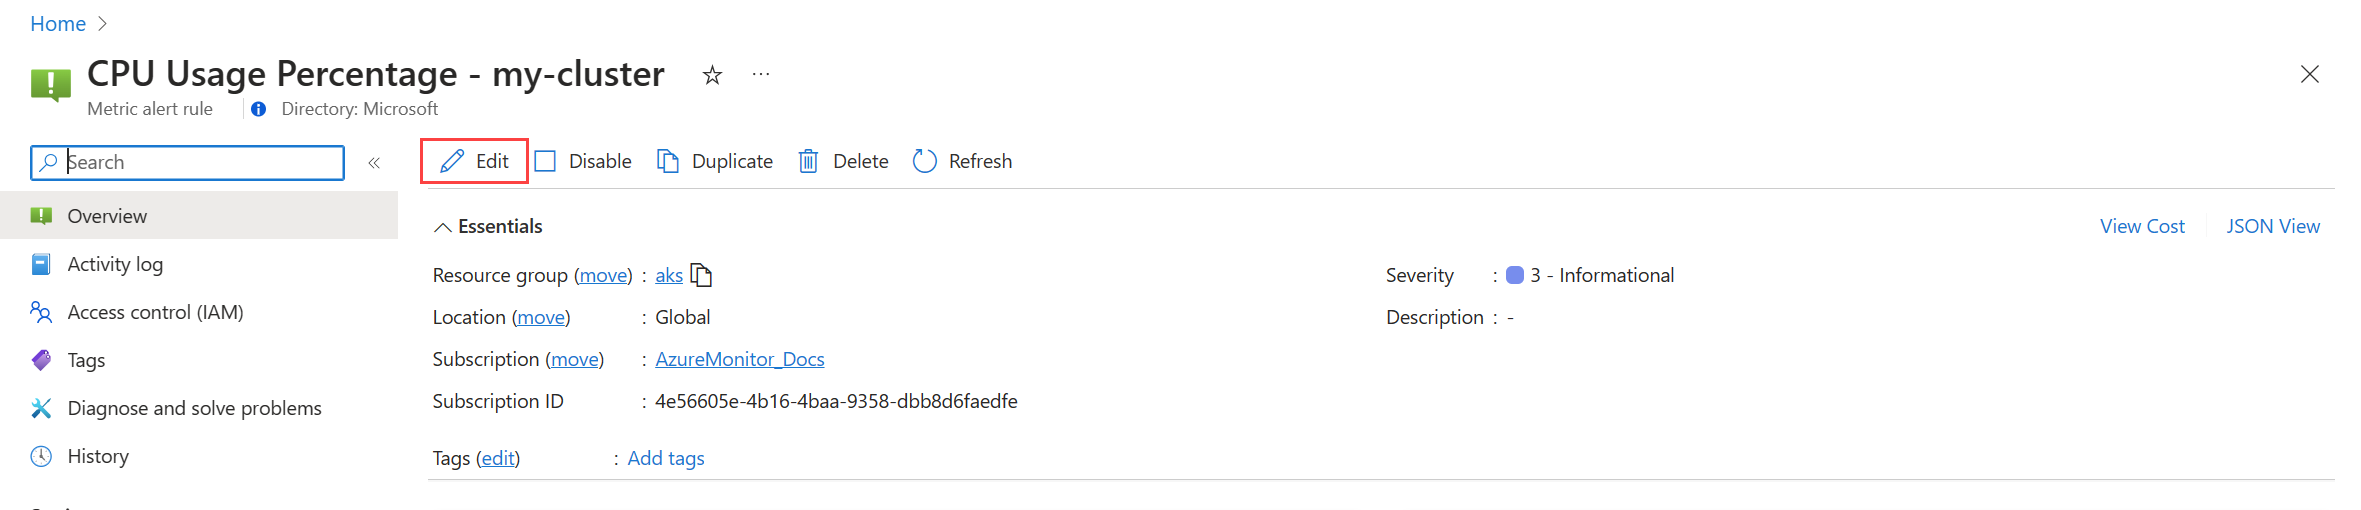
For platform metrics:
click Edit to open the details for the alert rule. Use the guidance in Create an alert rule to modify the rule.


Disable alert rule group
Disable the rule group to stop receiving alerts from the rules in it.
View the Prometheus alert rule group or platform metric alert rule as described in Edit recommended alert rules.
From the Overview menu, select Disable.


Recommended alert rule details
The following tables list the details of each recommended alert rule. Source code for each is available in GitHub along with troubleshooting guides from the Prometheus community.
Prometheus community alert rules
Cluster level alerts
| Alert name | Description | Default threshold | Timeframe (minutes) |
|---|---|---|---|
| KubeCPUQuotaOvercommit | The CPU resource quota allocated to namespaces exceeds the available CPU resources on the cluster's nodes by more than 50% for the last 5 minutes. | >1.5 | 5 |
| KubeMemoryQuotaOvercommit | The memory resource quota allocated to namespaces exceeds the available memory resources on the cluster's nodes by more than 50% for the last 5 minutes. | >1.5 | 5 |
| KubeContainerOOMKilledCount | One or more containers within pods have been killed due to out-of-memory (OOM) events for the last 5 minutes. | >0 | 5 |
| KubeClientErrors | The rate of client errors (HTTP status codes starting with 5xx) in Kubernetes API requests exceeds 1% of the total API request rate for the last 15 minutes. | >0.01 | 15 |
| KubePersistentVolumeFillingUp | The persistent volume is filling up and is expected to run out of available space evaluated on the available space ratio, used space, and predicted linear trend of available space over the last 6 hours. These conditions are evaluated over the last 60 minutes. | N/A | 60 |
| KubePersistentVolumeInodesFillingUp | Less than 3% of the inodes within a persistent volume are available for the last 15 minutes. | <0.03 | 15 |
| KubePersistentVolumeErrors | One or more persistent volumes are in a failed or pending phase for the last 5 minutes. | >0 | 5 |
| KubeContainerWaiting | One or more containers within Kubernetes pods are in a waiting state for the last 60 minutes. | >0 | 60 |
| KubeDaemonSetNotScheduled | One or more pods are not scheduled on any node for the last 15 minutes. | >0 | 15 |
| KubeDaemonSetMisScheduled | One or more pods are misscheduled within the cluster for the last 15 minutes. | >0 | 15 |
| KubeQuotaAlmostFull | The utilization of Kubernetes resource quotas is between 90% and 100% of the hard limits for the last 15 minutes. | >0.9 <1 | 15 |
Node level alerts
| Alert name | Description | Default threshold | Timeframe (minutes) |
|---|---|---|---|
| KubeNodeUnreachable | A node has been unreachable for the last 15 minutes. | 1 | 15 |
| KubeNodeReadinessFlapping | The readiness status of a node has changed more than 2 times for the last 15 minutes. | 2 | 15 |
Pod level alerts
| Alert name | Description | Default threshold | Timeframe (minutes) |
|---|---|---|---|
| KubePVUsageHigh | The average usage of Persistent Volumes (PVs) on pod exceeds 80% for the last 15 minutes. | >0.8 | 15 |
| KubeDeploymentReplicasMismatch | There is a mismatch between the desired number of replicas and the number of available replicas for the last 10 minutes. | N/A | 10 |
| KubeStatefulSetReplicasMismatch | The number of ready replicas in the StatefulSet does not match the total number of replicas in the StatefulSet for the last 15 minutes. | N/A | 15 |
| KubeHpaReplicasMismatch | The Horizontal Pod Autoscaler in the cluster has not matched the desired number of replicas for the last 15 minutes. | N/A | 15 |
| KubeHpaMaxedOut | The Horizontal Pod Autoscaler (HPA) in the cluster has been running at the maximum replicas for the last 15 minutes. | N/A | 15 |
| KubePodCrashLooping | One or more pods is in a CrashLoopBackOff condition, where the pod continuously crashes after startup and fails to recover successfully for the last 15 minutes. | >=1 | 15 |
| KubeJobStale | At least one Job instance did not complete successfully for the last 6 hours. | >0 | 360 |
| KubePodContainerRestart | One or more containers within pods in the Kubernetes cluster have been restarted at least once within the last hour. | >0 | 15 |
| KubePodReadyStateLow | The percentage of pods in a ready state falls below 80% for any deployment or daemonset in the Kubernetes cluster for the last 5 minutes. | <0.8 | 5 |
| KubePodFailedState | One or more pods is in a failed state for the last 5 minutes. | >0 | 5 |
| KubePodNotReadyByController | One or more pods are not in a ready state (i.e., in the "Pending" or "Unknown" phase) for the last 15 minutes. | >0 | 15 |
| KubeStatefulSetGenerationMismatch | The observed generation of a Kubernetes StatefulSet does not match its metadata generation for the last 15 minutes. | N/A | 15 |
| KubeJobFailed | One or more Kubernetes jobs have failed within the last 15 minutes. | >0 | 15 |
| KubeContainerAverageCPUHigh | The average CPU usage per container exceeds 95% for the last 5 minutes. | >0.95 | 5 |
| KubeContainerAverageMemoryHigh | The average memory usage per container exceeds 95% for the last 5 minutes. | >0.95 | 10 |
| KubeletPodStartUpLatencyHigh | The 99th percentile of the pod startup latency exceeds 60 seconds for the last 10 minutes. | >60 | 10 |
Platform metric alert rules
| Alert name | Description | Default threshold | Timeframe (minutes) |
|---|---|---|---|
| Node cpu percentage is greater than 95% | The node CPU percentage is greater than 95% for the last 5 minutes. | 95 | 5 |
| Node memory working set percentage is greater than 100% | The node memory working set percentage is greater than 100% for the last 5 minutes. | 100 | 5 |
Legacy Container insights metric alerts (preview)
Metric rules in Container insights were retired on May 31, 2024. These rules were in public preview but were retired without reaching general availability since the new recommended metric alerts described in this article are now available.
If you already enabled these legacy alert rules, you should disable them and enable the new experience.
Disable metric alert rules
- From the Insights menu for your cluster, select Recommended alerts (preview).
- Change the status for each alert rule to Disabled.
Legacy alert mapping
The following table maps each of the legacy Container insights metric alerts to its equivalent recommended Prometheus metric alerts.
| Custom metric recommended alert | Equivalent Prometheus/Platform metric recommended alert | Condition |
|---|---|---|
| Completed job count | KubeJobStale (Pod level alerts) | At least one Job instance did not complete successfully for the last 6 hours. |
| Container CPU % | KubeContainerAverageCPUHigh (Pod level alerts) | The average CPU usage per container exceeds 95% for the last 5 minutes. |
| Container working set memory % | KubeContainerAverageMemoryHigh (Pod level alerts) | The average memory usage per container exceeds 95% for the last 5 minutes. |
| Failed Pod counts | KubePodFailedState (Pod level alerts) | One or more pods is in a failed state for the last 5 minutes. |
| Node CPU % | Node cpu percentage is greater than 95% (Platform metric) | The node CPU percentage is greater than 95% for the last 5 minutes. |
| Node Disk Usage % | N/A | Average disk usage for a node is greater than 80%. |
| Node NotReady status | KubeNodeUnreachable (Node level alerts) | A node has been unreachable for the last 15 minutes. |
| Node working set memory % | Node memory working set percentage is greater than 100% | The node memory working set percentage is greater than 100% for the last 5 minutes. |
| OOM Killed Containers | KubeContainerOOMKilledCount (Cluster level alerts) | One or more containers within pods have been killed due to out-of-memory (OOM) events for the last 5 minutes. |
| Persistent Volume Usage % | KubePVUsageHigh (Pod level alerts) | The average usage of Persistent Volumes (PVs) on pod exceeds 80% for the last 15 minutes. |
| Pods ready % | KubePodReadyStateLow (Pod level alerts) | The percentage of pods in a ready state falls below 80% for any deployment or daemonset in the Kubernetes cluster for the last 5 minutes. |
| Restarting container count | KubePodContainerRestart (Pod level alerts) | One or more containers within pods in the Kubernetes cluster have been restarted at least once within the last hour. |
Legacy metric mapping
The following table maps each of the legacy Container insights custom metrics to its equivalent Prometheus metrics.
| Custom metric | Equivalent Prometheus metric |
|---|---|
| cpuUsageMillicores | rate(container_cpu_usage_seconds_total[5m]) * 1000 |
| cpuUsagePercentage | 100 * rate(container_cpu_usage_seconds_total{cluster="$cluster"}[5m]) |
| cpuUsageAllocatablePercentage | 100 * ( sum by (cluster) (node_namespace_pod_container:container_cpu_usage_seconds_total:sum_irate{cluster="$cluster"}) / sum by (cluster) (instance:node_num_cpu:sum{cluster="$cluster"}) ) |
| memoryRssByte | container_memory_rss{cluster="$cluster"} |
| memoryRssPercentage | 100 * (sum by (instance, cluster) (container_memory_rss{job="cadvisor", cluster="$cluster"}) / sum by (instance, cluster) (machine_memory_bytes{job="cadvisor", cluster="$cluster"})) |
| memoryRssAllocatablePercentage | 100 * (sum by (node, cluster) (container_memory_rss{cluster="$cluster"}) / sum by (node, cluster) (node_memory_MemTotal_bytes{cluster="$cluster"})) |
| memoryWorkingSetBytes | container_memory_working_set_bytes{cluster="$cluster"} |
| memoryWorkingSetPercentage | 100 * (sum by (node, cluster) (container_memory_working_set_bytes{cluster="$cluster"}) / sum by (node, cluster) (node_memory_MemTotal_bytes{cluster="$cluster"})) |
| nodesCount | count(kube_node_status_condition{condition="Ready", status="true", cluster="$cluster"}) |
| diskUsedPercentage | 100 * (node_filesystem_size_bytes{cluster="$cluster"} - node_filesystem_free_bytes{cluster="$cluster"}) / node_filesystem_size_bytes{cluster="$cluster"} |
| podCount | count(count by (pod, namespace, cluster) (kube_pod_info{cluster="$cluster"})) |
| completedJobsCount | count(kube_job_status_succeeded{status="true", cluster="$cluster"} and time() - kube_job_status_start_time > 6 * 3600) |
| restartingContainerCount | sum by(container, namespace, cluster) (rate(kube_pod_container_status_restarts_total{cluster="$cluster"}[5m])) |
| oomKilledContainerCount | sum by(container, namespace, cluster) (kube_pod_container_status_terminated_reason{reason="OOMKilled", cluster="$cluster"}) |
| podReadyPercentage | 100 * (sum(kube_pod_status_phase{phase="Running", cluster="$cluster"}) by (namespace, cluster) / sum(kube_pod_status_phase{phase!="Succeeded", cluster="$cluster"}) by (namespace, cluster)) |
Next steps
- Read about the different alert rule types in Azure Monitor.
- Read about alerting rule groups in Azure Monitor managed service for Prometheus.