Note
Access to this page requires authorization. You can try signing in or changing directories.
Access to this page requires authorization. You can try changing directories.
After you attach a notebook to a cluster and run one or more cells, your notebook has state and displays outputs. This section describes how to manage notebook state and outputs.
Clear notebooks state and outputs
To clear the notebook state and outputs, select one of the Clear options at the bottom of the Run menu.
| Menu option | Description |
|---|---|
| Clear all cell outputs | Clears the cell outputs. This is useful if you share the notebook and want to avoid including any results. |
| Clear state | Clears the notebook state, including function and variable definitions, data, and imported libraries. |
| Clear state and outputs | Clears cell outputs and the notebook state. |
| Clear state and run all | Clears the notebook state and starts a new run. |
Results table
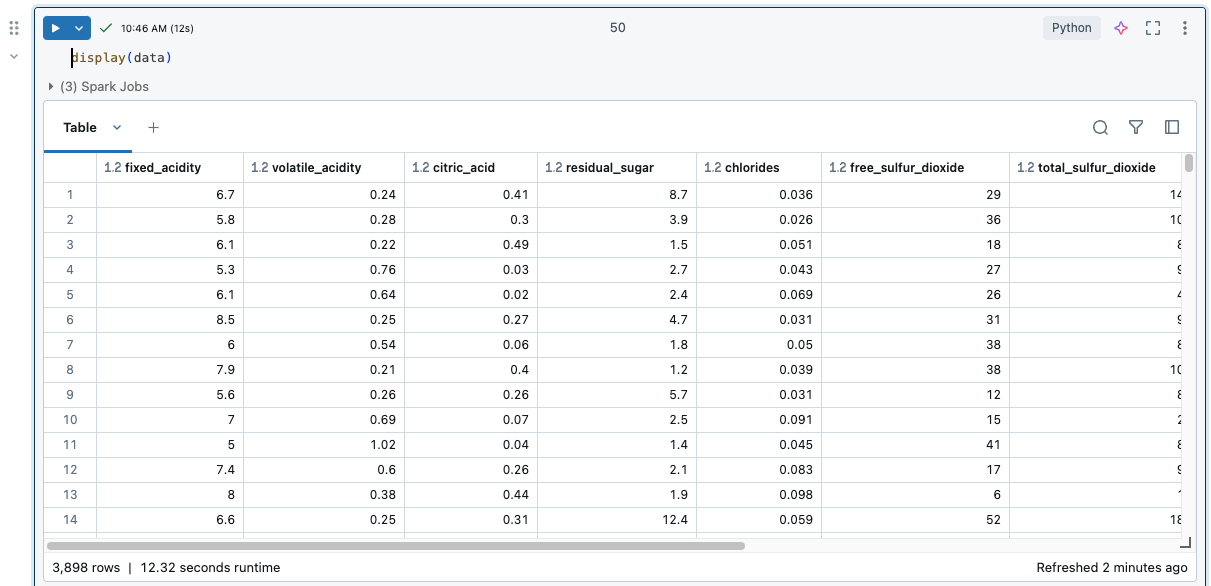
When a cell is run, results are shown in a results table. With the results table, you can do the following:
- Copy a column or other subset of tabular results data to the clipboard.
- Do a text search over the results table.
- Sort and filter data.
- Navigate between table cells using the keyboard arrow keys.
- Select part of a column name or cell value by double-clicking and dragging to select the desired text.
- Use the column explorer to search, show or hide, pin, and rearrange columns.
To view limits on the results table, see Notebook results table limits.
Select data
To select data in the results table, do any of the following.
- Copy the data or a subset of the data to the clipboard.
- Click a column or row header.
- Click in the upper-left cell of the table to select the entire table.
- Drag your cursor across any set of cells to select them.
To open a side panel displaying selection information, click the panel icon ![]() icon in the upper-right corner, next to the Search box.
icon in the upper-right corner, next to the Search box.
![]()
Copy data to clipboard
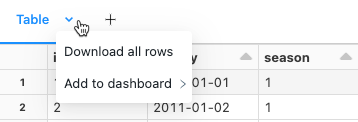
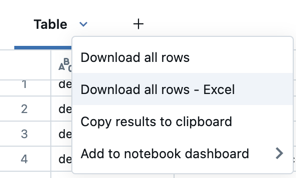
To copy the results table in CSV format to the clipboard, click the downward arrow next to the table title tab, then click Copy results to clipboard.
Alternatively, click the box in the table's top left to select the full table, and then right-click and select Copy from the drop-down menu.
There are several ways to copy selected data:
- Press
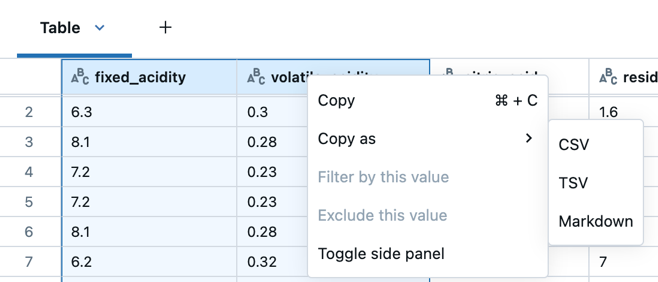
Cmd + Con MacOS orCtrl + Con Windows to copy the results to the clipboard in CSV format. - Right-click and select Copy to copy the results to the clipboard in CSV format.
- Right click and select Copy as to copy the selected data in CSV, TSV, or Markdown format.
Sort results
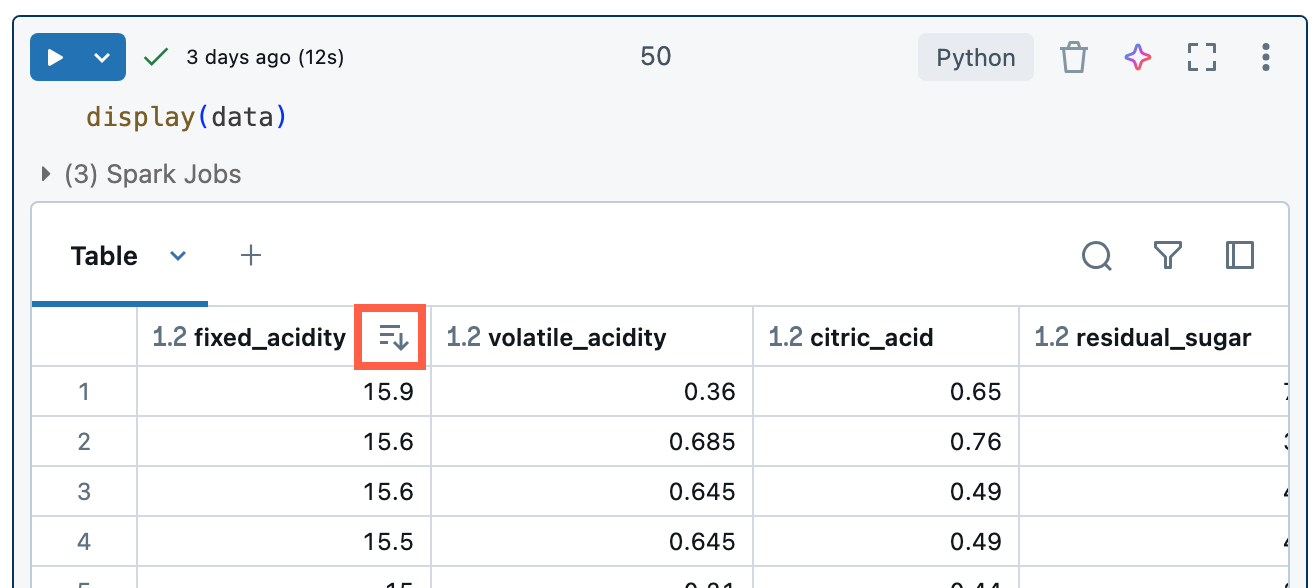
To sort the results table by the values in a column, hover your cursor over the column name. An icon containing the column name appears at the right of the cell. Click the arrow to sort the column.
To sort by multiple columns, hold down the Shift key as you click the sort arrow for the columns.
Sorting follows natural sort order by default. To enforce a lexicographical sort order, use ORDER BY in SQL or the respective SORT functions available in your environment.
Filter results
Use filters on a results table to take a closer look at the data. Filters applied to result tables also affect visualizations, enabling interactive exploration without modifying the underlying query or dataset. See Filter a visualization.
There are several ways to create a filter:
Databricks Assistant
Use natural language prompts with Assistant
Create filters using natural language prompts:
- Click
 at the upper-right of the cell results.
 - In the dialog that appears, enter text that describes the filter you want.
- Click
 . The Assistant will generate and apply the filter for you.
If you want to create additional filters with Assistant, click ![]() next to the filter(s) to enter another prompt.
next to the filter(s) to enter another prompt.
See Filter data with natural language prompts.
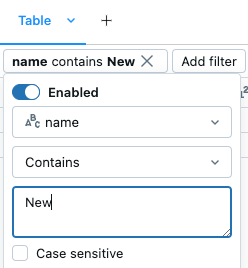
Filter dialog
Use the built-in filter dialog
- If you don't have Databricks Assistant enabled, click at the upper-right of the cell results to open the filter dialog. You can also access this dialog by clicking
 .
. - Select the column you want to filter.
- Select the filter rule you want to apply.
- Select the value(s) you want to filter.
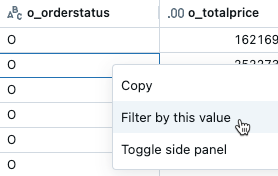
By value
Filter by a specific value
- From the results table, right-click on a cell with that value.
- Select Filter by this value from the drop-down menu.
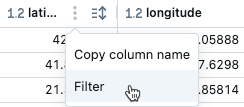
By column
Filter on a specific column
- Hover over the column you want to filter on.
- Click
 .
. - Click Filter.
- Select the values you want to filter for.
To temporarily enable or disable a filter, toggle the Enabled/Disabled button in the dialog.
To delete a filter, click ![]() next to the filter name
next to the filter name 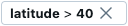 .
.
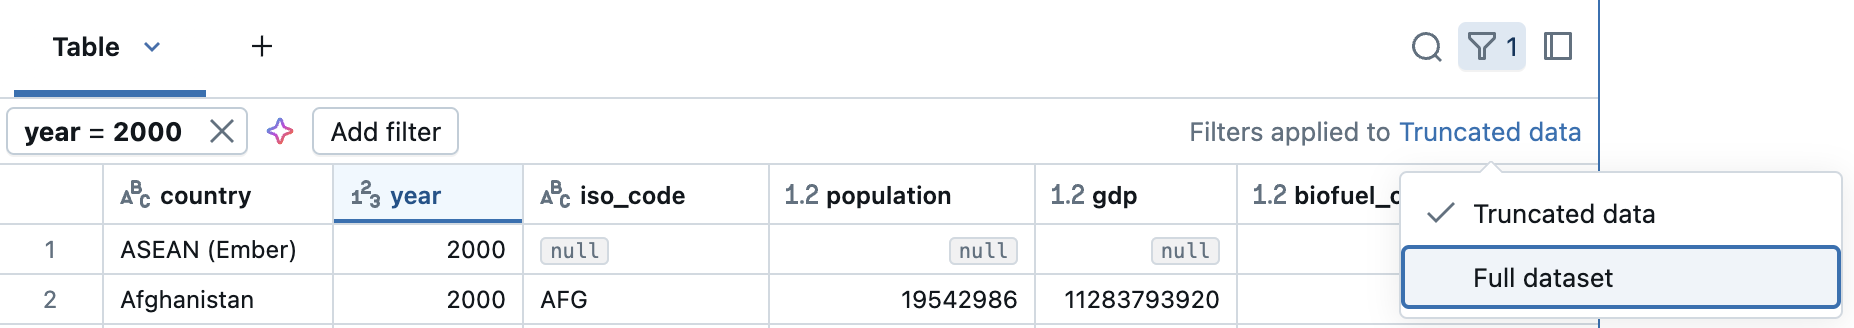
Apply filters to full dataset
By default, filters are applied only to the results shown in the results table. If the data returned is truncated (for example, when a query returns more than 10,000 rows or the dataset is larger than 2MB), the filter is applied only to the returned rows. A note in the top right of the table indicates that the filter was applied to truncated data.
You can choose to filter the full dataset instead. Click Truncated data, then choose Full dataset. Depending on the size of the dataset, it may take a long time for the filter to apply.
Create a query from filtered results
From a filtered results table or visualization in a notebook with SQL as the default language, you can create a new query with the filters applied. In the top right of the table or visualization, click Create query. The query is added as the next cell in the notebook.
The created query applies your filters on top of the original query. This allows you to work with a smaller, more relevant dataset, enabling more efficient data exploration and analysis.

Explore columns
To facilitate working with tables that have many columns, you can use the column explorer. To open the column explorer, click the column icon (![]() ) in the top right of a results table.
) in the top right of a results table.
The column explorer allows you to:
- Search for columns: Type in the search bar to filter the list of columns. Click on a column in the explorer to navigate to it within the results table.
- Show or hide columns: Use the checkboxes to control column visibility. The checkbox at the top toggles the visibility of all columns at once. Individual columns can be shown or hidden using the checkboxes next to their names.
- Pin columns: Hover over a column name to reveal a pin icon. Click the pin icon to pin the column. Pinned columns remain visible as you scroll horizontally through the results table.
- Rearrange columns: Click and hold the drag icon (
 ) to the right of a column's name, then drag and drop the column to its new desired position. This reorders the columns in the results table.
Format columns
Column headers indicate the data type of the column. For example,  indicates integer data type. Hover over the indicator to see the data type.
You can format columns in results tables as types like Currency, Percentage, URL and more, with control over decimal places for clearer tables.
Format columns from the kebab menu in the column name.
Download results
By default, downloading results is enabled. To toggle this setting, see Manage the ability to download results from notebooks.
You can download a cell result that contains tabular output to your local machine. Click the downward pointing arrow next to the tab title. The menu options depend on the number of rows in the result and the Databricks Runtime version. Downloaded results are saved on your local machine as a CSV file with a name corresponding to your notebook name.
For notebooks connected to SQL warehouses or serverless compute, you can also download the results as an Excel file.
Explore SQL cell results
In a Databricks notebook, results from a SQL language cell are automatically available as a DataFrame assigned to the variable _sqldf. You can use the _sqldf variable to refer to the previous SQL output in subsequent Python and SQL cells. For details, see Explore SQL cell results.
View multiple outputs per cell
Python notebooks and %python cells in non-Python notebooks support multiple outputs per cell. For example, the output of the following code includes both the plot and the table:
import pandas as pd
from sklearn.datasets import load_iris

data = load_iris()
iris = pd.DataFrame(data=data.data, columns=data.feature_names)
ax = iris.plot()
print("plot")
display(ax)
print("data")
display(iris)
Resize outputs
Resize cell outputs by dragging the bottom right corner of the table or visualization.
Commit notebook outputs in Databricks Git folders
To learn about committing .ipynb notebook outputs, see Allow committing .ipynb notebook output.
- The notebook must be a .ipynb file
- Workspace admin settings must allow notebook outputs to be committed