Requirements tracking rollup sample report
Azure DevOps Services | Azure DevOps Server 2022 | Azure DevOps Server 2020
The Requirements tracking rollup report builds on the Requirements tracking report and shows how to aggregate metrics for a one-level roll-up. For example, if you're tracking requirements with User Stories, you can aggregate data for Features using the queries provided in this article.
An example is shown in the following image.

This report displays the following information for each requirement that it lists:
- Percent work completed: Progress bar that shows the percentage of completed work based on the rollup of completed hours for all tasks that are linked to the requirement.
- Passed tests: The number of test cases run that's passed based on the most recent test run.
- Failed tests: The number of test cases run that's failed based on the most recent test run.
- Run tests: The number of test runs that's executed.
- Active bugs: The number of linked bugs in an Active state.
- Closed bugs: The number of linked bugs in a Closed, Done, or Completed state.
Note
Requirement tracking is supported only for test cases linked through a Requirement-based test suite. The association between a requirement work item—User Story (Agile), Product Backlog Item (Scrum), Requirement (CMMI), or Issue (Basic)—and manual test execution is only formed when the test case is linked via a Requirement-based test suite.
Questions the report answers
Requirements tracking reports are useful for answering the following types of questions.
Work progress
- Does the amount of work that remains for each requirement correspond to your expectations?
- Are top-ranked requirements being implemented first?
- How many tests are defined for each requirement? How many tests are passing?
- What requirements are being implemented that have no test cases defined for them?
Quality progress
- How many test cases have run for each requirement, and how many have passed?
- How many active bugs does each requirement have?
- Are bugs being found for requirements that are being tested?
- Are bugs being resolved or are they remaining active?
Risk assessment
- Which requirements are at risk?
- Which requirements aren't sufficiently stable for release?
- Which requirements can we ship today?
Important
Power BI integration and access to the OData feed of the Analytics Service are generally available for Azure DevOps Services and Azure DevOps Server 2020 and later versions. The sample queries provided in this article are valid only against Azure DevOps Server 2020 and later versions, and depend on v3.0-preview or later version. We encourage you to use these queries and provide us feedback.
Prerequisites
- Access levels: You must be a member of a project with Basic access or higher.
- Permissions: By default, project members have permission to query Analytics and create views.
- For more information about other prerequisites regarding service and feature enablement and general data tracking activities, see Permissions and prerequisites to access Analytics.
Note
This article assumes you read Overview of Sample Reports using OData Queries and have a basic understanding of Power BI.
For the report to generate useful data, you need to have performed the following tasks:
- You've define requirement work items and assigned them to the area and iteration paths of interest. For information about how to define area and iteration paths, see Define area paths and Define iteration paths.
- To get the percentage of hours completion, you need to fill in the Complete Work and Remaining Work fields of tasks or bugs linked to requirements with the Child link type.
- To get the execution status of test cases, you will have created requirement-based test suites in Test Plans corresponding to those requirements. Inline tests you add through the board satisfy this prerequisite, however requirements that you link to tests don't. For more information, see Create test plans and test suites.
- To get the status of bugs, you will have created and linked bugs to requirements with the Child link type.
Sample queries
To generate the report, you must add three Power BI queries to Power BI desktop and then link them. Each query executes either the WorkItems or TestPoints entity set.
Note
The Power BI query snippets provided in the following sections include the requisite data transforms to expand columns and change data type.
Query area and iteration paths
In order to scope your report to a particular Area and Iteration path, you can filter the query using AreaSK and IterationSK. For details, see Define basic queries using OData Analytics.
Note
To determine available properties for filter or report purposes, see Metadata reference for Azure Boards. You can filter your queries or return properties using any of the Property values under an EntityType or NavigationPropertyBinding Path values available with an EntitySet. Each EntitySet corresponds to an EntityType. For more information about the data type of each value, review the metadata provided for the corresponding EntityType.
Query for percentage of hours completion for requirements
Note
Change the WorkItemType based on the process you are using. The Scrum template supports Feature and the Basic template supports Epic as the roll up work item type, respectively.
Copy and paste the following Power BI query directly into the Get Data > Blank Query window. For more information, see Overview of sample reports using OData queries.
let
    Source = OData.Feed("https://analytics.dev.azure.com/{organization}/{project}/_odata/v3.0-preview/WorkItems?
$filter=(
    IterationSK eq {iterationSK}
    and AreaSK eq {areaSK}
    and WorkItemType eq 'Feature'
)
&$expand=Descendants(
    $apply=filter( CompletedWork ne null or RemainingWork ne null )
    /aggregate(
        iif(CompletedWork ne null, CompletedWork, 0) with sum as SumCompletedWork,
        iif(RemainingWork ne null, RemainingWork, 0) with sum as SumRemainingWork
    )
    /compute(
        (SumCompletedWork add SumRemainingWork) as TotalWork,
        SumCompletedWork as SumCompleted
    )
    /compute(
        iif(TotalWork gt 0,(SumCompleted div cast(TotalWork, Edm.Double) mul 100), 0) as PercCompletedWork
    )
)
&$select=WorkItemId, Title", null, [Implementation="2.0"]),
    #"Expanded Descendants" = Table.ExpandTableColumn(Source, "Descendants", {"SumCompletedWork", "SumRemainingWork", "TotalWork", "SumCompleted", "PercCompletedWork"}, {"Descendants.SumCompletedWork", "Descendants.SumRemainingWork", "Descendants.TotalWork", "Descendants.SumCompleted", "Descendants.PercCompletedWork"}),
    #"Changed Type" = Table.TransformColumnTypes(#"Expanded Descendants",{{"Descendants.SumCompletedWork", type number}, {"Descendants.SumRemainingWork", type number}, {"Descendants.TotalWork", type number}, {"Descendants.SumCompleted", type number}, {"Descendants.PercCompletedWork", type number}})
in
    #"Changed Type"
Query for test execution status of requirements
Note
To determine available properties for filter or report purposes, see Metadata reference for Test Plans Analytics. You can filter your queries or return properties using any of the Property values under an EntityType or NavigationPropertyBinding Path values available with an EntitySet. Each EntitySet corresponds to an EntityType. For more information about the data type of each value, review the metadata provided for the corresponding EntityType.
Copy and paste the following Power BI query directly into the Get Data > Blank Query window. For more information, see Overview of sample reports using OData queries.
let
    Source = OData.Feed("https://analytics.dev.azure.com/{organization}/{project}/_odata/v3.0-preview/TestPoints?
	$apply=filter(
	    (TestSuite/RequirementWorkItem/IterationSK eq {iterationSK}
    and TestSuite/RequirementWorkItem/AreaSK eq {areaSK}
    and TestSuite/RequirementWorkItem/Processes/any(p:p/BacklogType eq 'RequirementBacklog')
    and TestSuite/RequirementWorkItem/Processes/all(p:p/IsBugType eq false)
	))
	/compute(iif(TestSuite/RequirementWorkItem/Parent ne null, TestSuite/RequirementWorkItem/Parent/WorkItemId, 0) as ParentWorkItemId,
	iif(TestSuite/RequirementWorkItem/Parent ne null, TestSuite/RequirementWorkItem/Parent/Title, 'Unparented') as ParentWorkItemTitle
	)/groupby(
	    (ParentWorkItemId, ParentWorkItemTitle),
	    aggregate(
	        $count as TotalCount,
	        cast(LastResultOutcome eq 'Passed', Edm.Int32) with sum as PassedCount,
	        cast(LastResultOutcome eq 'Failed', Edm.Int32) with sum as FailedCount,
            cast(LastResultOutcome eq 'Blocked', Edm.Int32) with sum as BlockedCount,
            cast(LastResultOutcome eq 'NotApplicable', Edm.Int32) with sum as NotApplicableCount,
	        cast(LastResultOutcome eq 'None', Edm.Int32) with sum as NotRunCount,
	        cast(LastResultOutcome ne 'None', Edm.Int32) with sum as RunCount)
)", null, [Implementation="2.0"]),
    #"Changed Type" = Table.TransformColumnTypes(#"Source",{{"TotalCount", type number}, {"PassedCount", type number}, {"FailedCount", type number}, {"BlockedCount", type number}, {"NotApplicableCount", type number}, {"NotRunCount", type number}, {"RunCount", type number}})
in
    #"Changed Type"
Note
The TestSuite/RequirementWorkItem/... entry indicates that the work item must be linked to the test suite via a requirement-based test suites as discussed in the prerequisites.
Query for status of bugs linked to the requirements
Note
Change the WorkItemType based on the process you are using. The Scrum template supports Feature and the Basic template supports Epic as the roll up work item type, respectively.
Copy and paste the following Power BI query directly into the Get Data > Blank Query window. For more information, see Overview of sample reports using OData queries.
let
    Source = OData.Feed("https://analytics.dev.azure.com/{organization}/{project}/_odata/v3.0-preview/WorkItems?
    $filter=(
        IterationSK eq {iterationSK}
        and AreaSK eq {areaSK}
        and WorkItemType eq 'Feature'
    )
&$expand=Descendants(
    $apply=filter(
        WorkItemType eq 'Bug'
    )
    /groupby(
        (State),
        aggregate($count as Count)
    )
)
&$select=WorkItemId,Title", null, [Implementation="2.0"]),
    #"Expanded Descendants" = Table.ExpandTableColumn(Source, "Descendants", {"State", "Count"}, {"Descendants.State", "Descendants.Count"}),
    #"Filtered Rows" = Table.SelectRows(#"Expanded Descendants", each [Descendants.Count] <> null and [Descendants.Count] <> ""),
    #"Pivoted Column" = Table.Pivot(#"Filtered Rows", List.Distinct(#"Filtered Rows"[Descendants.State]), "Descendants.State", "Descendants.Count", List.Sum),
    #"Changed Type" = Table.TransformColumnTypes(#"Pivoted Column",{{"Active", type number}, {"Closed", type number}})
in
    #"Changed Type"
Substitution strings and query breakdown
Substitute the following strings with your values. Don't include brackets {} with your substitution. For example if your organization name is "Fabrikam", replace {organization} with Fabrikam, not {Fabrikam}.
{organization}- Your organization name{project}- The name of your project{iterationSK}- The GUID associated with the Iteration Path of interest. To look up the GUID, see [../extend-analytics/wit-analytics.md#iterationsk](Return the IterationSK for a specific Iteration Path){areaSK}- The GUID associated with the Area Path of interest. To look up the GUID, see [../extend-analytics/wit-analytics.md#areask](Return the AreaSK for a specific Area Path).
Query breakdown
The following table describes each part of the query.
Query part
Description
$filter=( IterationSK eq {iterationSK} and AreaSK eq {areaSK}
and WorkItemType eq 'Feature'
)`
Returns data for only Features under the specified Iteration and Area.
filter( (TestSuite/RequirementWorkItem/IterationSK eq {iterationSK} and TestSuite/RequirementWorkItem/AreaSK eq {areaSK} and TestSuite/RequirementWorkItem/Processes/any(p:p/BacklogType eq 'RequirementBacklog') and TestSuite/RequirementWorkItem/Processes/all(p:p/IsBugType eq false)))
Return data for only selected backlog requirement items under the specified Iteration and Area.
&$expand=Descendants( $apply=filter( CompletedWork ne null or RemainingWork ne null )
Expand the child items of Features and return Completed Work and Remaining Work data for the work items.
&$expand=Descendants( $apply=filter( WorkItemType eq 'Bug' ) /groupby( (State), aggregate($count as Count) )
Expand the child items of Features and filter for bug, group the return data by State and sun the total count of child items.
/aggregate($count as TotalCount,
Aggregate data across the filtered test points with having count as TotalCount.
cast(LastResultOutcome eq 'Passed', Edm.Int32) with sum as PassedCount, cast(LastResultOutcome eq 'Failed', Edm.Int32) with sum as FailedCount, cast(LastResultOutcome eq 'Blocked', Edm.Int32) with sum as BlockedCount, cast(LastResultOutcome eq 'NotApplicable', Edm.Int32) with sum as NotApplicableCount, cast(LastResultOutcome eq 'None', Edm.Int32) with sum as NotRunCount, cast(LastResultOutcome ne 'None', Edm.Int32) with sum as RunCount)
While aggregating, sum the values of test points based on their latest execution outcome of Passed, Failed, Blocked, NotApplicable, and None. Also, sum the values of test points whose latest outcome is not equal to None to get the total RunCount.
/aggregate( iif(CompletedWork ne null, CompletedWork, 0) with sum as SumCompletedWork, iif(RemainingWork ne null, RemainingWork, 0) with sum as SumRemainingWork
Aggregate Completed Work and Remaining Work data across the filtered work items.
)/compute( (SumCompletedWork add SumRemainingWork) as TotalWork, SumCompletedWork as SumCompleted
Compute the total rollup of Completed Work and Remaining Work.
)/compute( iif(TotalWork gt 0,(SumCompleted div cast(TotalWork, Edm.Double) mul 100), 0) as PercCompletedWork )
Calculate the percent of completed wor.
Create the Table report
- From the Modeling tab, choose Manage Relationships and link the three query results by
WorkItemIdcolumn. - Under Visualizations, choose Table.
- Add the columns you're interested in from the three Power BI queries.
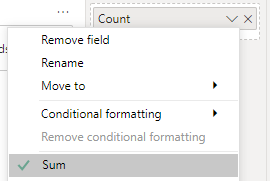
- Select Sum as aggregation for additive columns like Passed tests etc.
Here, Authentication scenarios is a parent feature of two User Stories.