Note
Access to this page requires authorization. You can try signing in or changing directories.
Access to this page requires authorization. You can try changing directories.
Microsoft Discovery bookshelf knowledgebase query logs capture query execution traces and error diagnostics for queries processed by the knowledgebase agent. These logs are automatically collected and stored in the DiscoveryLogs_CL table in the Log Analytics workspace within the bookshelf's Managed Resource Group (MRG).
Prerequisites
Before you begin, navigate to the Log Analytics workspace in your bookshelf's MRG. For instructions, see Access resource logs for Microsoft Discovery resources.
What the logs contain
Knowledgebase query logs provide detailed insights into:
- Query execution traces: Track query invocations and their execution through the knowledgebase agent.
- Error diagnostics: Investigate failures and exceptions in query execution.
Query knowledgebase logs
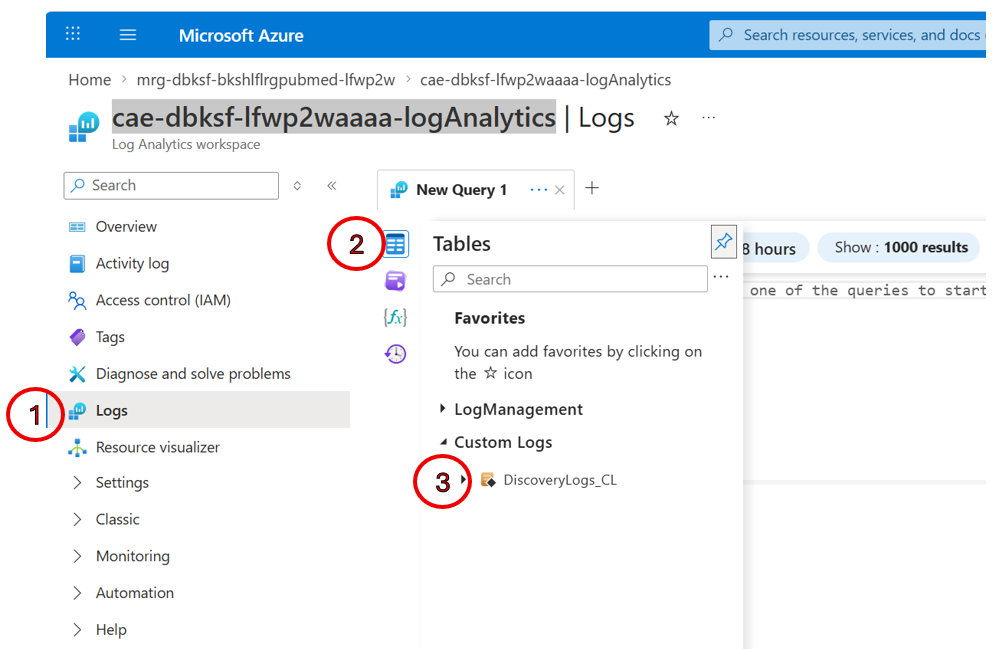
After opening the Logs interface in the bookshelf's MRG Log Analytics workspace:
- In the left panel, select the Tables tab.
- Expand Custom Logs and locate
DiscoveryLogs_CL. - Select Run next to
DiscoveryLogs_CLto execute a default query and confirm logs are being ingested.
Example queries
View recent logs
DiscoveryLogs_CL
| take 100
Filter by time range
DiscoveryLogs_CL
| where TimeGenerated > ago(1h)
| order by TimeGenerated desc
View all errors and warnings
Returns entries where the log level is Error or Warning, or the message contains error-related keywords.
DiscoveryLogs_CL
| where LogLevel in ("Error", "Warning")
    or Message contains "error"
    or Message contains "exception"
| project TimeGenerated, CorrelationId, OperationName, LogLevel, Message
| order by TimeGenerated desc
Analyze error patterns across all queries
DiscoveryLogs_CL
| where LogLevel == "Error"
| summarize ErrorCount = count() by ErrorType = tostring(split(Message, ":")[0])
| order by ErrorCount desc
View query activity over time
See how many queries were submitted per hour.
DiscoveryLogs_CL
| where Message == "Processing task started"
| summarize query_count = count() by bin(TimeGenerated, 1h)
| render timechart
View query status overview
See how many queries succeeded, are in progress, or failed.
DiscoveryLogs_CL
| where OperationName == "queryapp.message_queue.processor"
| where Message in ("Processing task started", "Processing task ended")
    or Message startswith "Validation failure"
    or Message has "Dead-letter"
| summarize arg_max(TimeGenerated, Message) by CorrelationId
| extend outcome = case(
    Message == "Processing task ended", "Succeeded",
    Message == "Processing task started", "In Progress",
    Message startswith "Validation failure", "Validation Failed",
    "Dead-lettered")
| summarize count() by outcome
List all queries with status
View each query ID with its latest status and time.
DiscoveryLogs_CL
| where OperationName == "queryapp.message_queue.processor"
| where Message in ("Processing task started", "Processing task ended")
    or Message startswith "Validation failure"
    or Message has "Dead-letter"
| summarize arg_max(TimeGenerated, Message) by CorrelationId
| project CorrelationId, TimeGenerated, QueryStatus = Message
| order by TimeGenerated desc
Count distinct queries
View all distinct queries ever submitted, with the most recently seen at the top.
DiscoveryLogs_CL
| where CorrelationId != "N/A" and isnotempty(CorrelationId)
| summarize last_seen = max(TimeGenerated) by CorrelationId
| order by last_seen desc
Check status of a specific query
Replace <your-query-id> with your correlation ID.
DiscoveryLogs_CL
| where CorrelationId == "<your-query-id>"
| where Message in ("Processing task started", "Processing task ended", "Dead-letter message written")
| project TimeGenerated, Message
| order by TimeGenerated asc
Debug a failed query
Get all errors and warnings for a specific query to understand why it failed.
DiscoveryLogs_CL
| where CorrelationId == "<your-query-id>"
| where LogLevel in ("Error", "Warning")
    or Message has "RateLimitError"
    or Message has "retry"
    or Message has "Connection-level error"
    or Message has "Dead-letter"
    or Message has "Invalid json"
    or Message has "Exception"
    or Message has "failed"
| project TimeGenerated, OperationName, LogLevel, Message
| order by TimeGenerated asc
View full trace for a specific query
View every log event for a query in chronological order.
DiscoveryLogs_CL
| where CorrelationId == "<your-query-id>"
| project TimeGenerated, OperationName, LogLevel, Message
| order by TimeGenerated asc
View dead-lettered queries
View queries that were rejected and couldn't be processed.
DiscoveryLogs_CL
| where Message has "Dead-letter"
| project TimeGenerated, CorrelationId, Message, Exception
| order by TimeGenerated desc
Troubleshooting
No data in DiscoveryLogs_CL
| Cause | Resolution |
|---|---|
| Knowledgebase query container was recently created | Run a query in Discovery Studio and generate log entries |
| Time range is too narrow | Expand the time range to the last 24 hours |
| Logs are delayed due to ingestion latency | Wait a few seconds and rerun the query |
Query timeout or slow performance
| Cause | Resolution |
|---|---|
| Query scope is too broad | Narrow the time range or add filters |
| Complex aggregations across large datasets | Use take or limit to restrict the result set, or apply summarize instead of returning raw data |