Note
Access to this page requires authorization. You can try signing in or changing directories.
Access to this page requires authorization. You can try changing directories.
Microsoft Discovery workspace logs capture agent execution traces, tool invocations, workflow steps, and error diagnostics for all investigations run within a workspace. These logs are automatically stored in the DiscoveryLogs_CL table in the Log Analytics workspace inside the workspace's Managed Resource Group (MRG).
Important
DiscoveryLogs_CL is an Auxiliary tier table. Each query must target this table only (cross-table joins aren't supported).
This article explains how to query workspace logs and how to use correlation IDs to trace the end-to-end flow of a specific request.
Prerequisites
Before you begin, navigate to the Log Analytics workspace in your workspace's MRG.
Query workspace logs
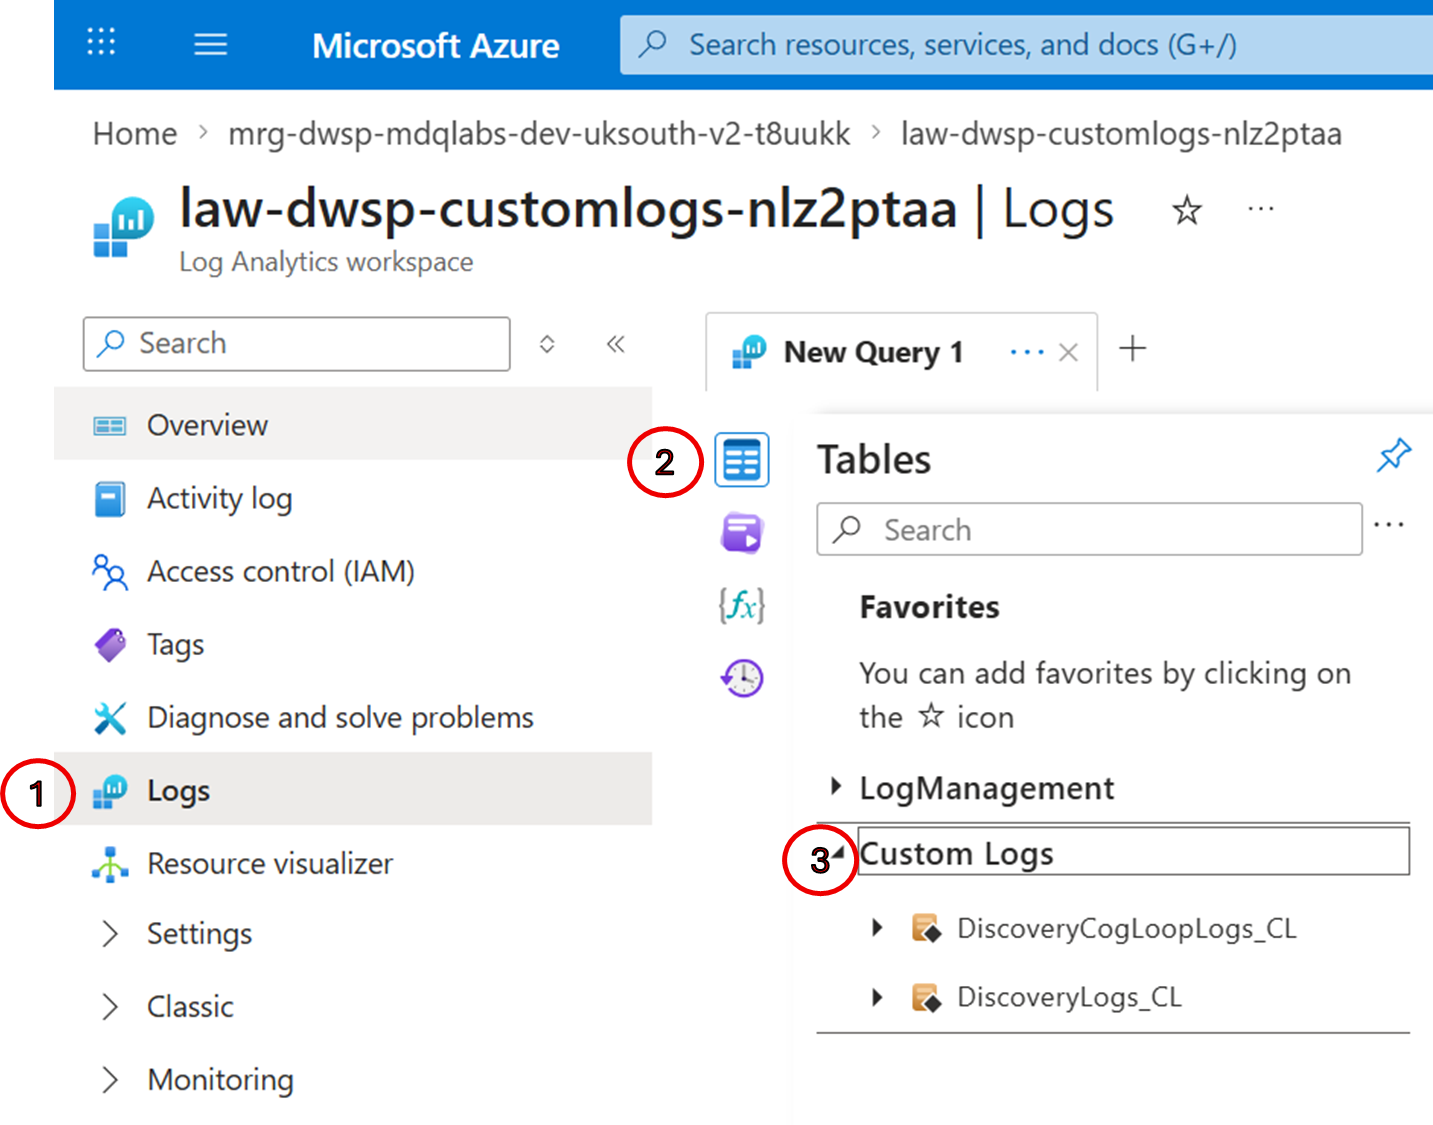
After opening the Logs interface in the workspace's MRG Log Analytics workspace:
- In the left panel, select the Tables tab.
- Expand Custom Logs and locate
DiscoveryLogs_CL. - Select Run next to
DiscoveryLogs_CLto execute a default query and confirm logs are being ingested.
Log schema
The DiscoveryLogs_CL table includes the following fields:
| Field | Description |
|---|---|
TimeGenerated |
Timestamp when the log entry was ingested into Log Analytics |
TimeStamp |
Precise timestamp with millisecond resolution representing when the log entry was generated |
Message |
Primary log message content |
LogLevel |
Log severity level: Information, Warning, Error, Critical |
CorrelationId |
Unique identifier linking all log entries for a specific request |
Example queries
View recent logs
DiscoveryLogs_CL
| take 100
Filter by time range
DiscoveryLogs_CL
| where TimeGenerated > ago(1h)
| order by TimeGenerated desc
View all errors and warnings
Returns entries where the log level is Error or Warning, or the message contains error-related keywords.
DiscoveryLogs_CL
| where TimeGenerated > ago(1h)
| where LogLevel in ("Error", "Warning")
    or Message contains "error"
    or Message contains "exception"
| project TimeGenerated, CorrelationId, LogLevel, Message
| order by TimeGenerated desc
Adjust ago(1h) to ago(6h), ago(1d), and so on, as needed.
Analyze error patterns
DiscoveryLogs_CL
| where LogLevel == "Error"
| summarize ErrorCount = count() by ErrorType = tostring(split(Message, ":")[0])
| order by ErrorCount desc
Filter by message content
DiscoveryLogs_CL
| where Message contains "<keyword>"
| order by TimeGenerated desc
Find your most recent requests
List recent requests grouped by correlation ID. This query is useful to identify the correlation ID of a specific tool run or investigation response.
DiscoveryLogs_CL
| where LogLevel == "Information"
| where Message has "CheckResponseStatus: Checking status"
| extend DiscoveryResponseId = extract(@"response '([^']+)'", 1, Message)
| summarize first_seen = min(TimeGenerated), last_seen = max(TimeGenerated)
  by CorrelationId, DiscoveryResponseId
| order by first_seen desc
View all logs for a specific request
Retrieve all log entries for a single request using its correlation ID.
DiscoveryLogs_CL
| where CorrelationId == "<your-correlation-id>"
| project TimeGenerated, LogLevel, Message
| order by TimeGenerated asc
Full activity timeline for an investigation
Track all workspace activity for a specific project and investigation, useful when you know the investigation name but not the correlation ID. Replace <your-project> and <your-investigation> with values from your Discovery session URL.
DiscoveryLogs_CL
| where Message has "/projects/<your-project>/investigations/<your-investigation>/"
| project TimeGenerated, CorrelationId, LogLevel, Message
| order by TimeGenerated asc
Check the status of a tool response
Track the lifecycle of a specific tool response from initial request through polling to completion. Replace <DiscoveryResponseId> with the full response path returned when you submitted the tool run.
DiscoveryLogs_CL
| where Message has "<DiscoveryResponseId>"
| project TimeGenerated, CorrelationId, LogLevel, Message
| order by TimeGenerated asc
To see all status transitions for a correlation ID:
DiscoveryLogs_CL
| where CorrelationId == "<your-correlation-id>"
| where Message has_any ("CheckResponseStatus", "Successfully retrieved", "Getting discovery response")
| extend status = extract(@"Status.*?:.*?'([^']+)'", 1, Message)
| project TimeGenerated, LogLevel, status, Message
| order by TimeGenerated asc
Investigate tool submission failures
Find Supercomputer job submission errors, including HTTP status codes and rejection reasons.
DiscoveryLogs_CL
| where LogLevel == "Error"
| where Message has_any ("supercomputer job submission failed", "SubmitSupercomputerJobV2", "An exception was thrown")
| project TimeGenerated, CorrelationId, LogLevel, Message
| order by TimeGenerated desc
Common error messages and their meaning:
| Error | Meaning |
|---|---|
403 Forbidden |
Insufficient permissions to submit a job to Supercomputer |
BadRequest / InvalidRequest |
Job request is malformed, check tool configuration or input file size |
EncodedFile must be a string or array type with a maximum length of '12000' |
Input file is too large for the workspace-to-SC payload, reduce file size |
Monitor Supercomputer job execution
Check whether a job was successfully submitted to Supercomputer and is being polled for results.
DiscoveryLogs_CL
| where Message has_any ("MonitorSupercomputerOperationV2", "Polling supercomputer", "V2: Polling supercomputer")
| extend operationId = extract(@"operation[Id]* '?([a-f0-9]{32})'?", 1, Message)
| project TimeGenerated, CorrelationId, operationId, Message
| order by TimeGenerated desc
To check a specific SC operation, replace <operationId> with the ID returned by the SC job monitoring:
DiscoveryLogs_CL
| where Message has "<operationId>"
| project TimeGenerated, CorrelationId, LogLevel, Message
| order by TimeGenerated asc
Detect timeouts
Identify requests that timed out while waiting for a Supercomputer response.
DiscoveryLogs_CL
| where LogLevel == "Error"
| where Message has "OnTimeout" or Message has "didn't complete within the allowed timeout"
| project TimeGenerated, CorrelationId, Message
| order by TimeGenerated desc
Detect retries
Retries often signal intermittent upstream failures. This query shows how many retry attempts occurred for each correlation ID.
DiscoveryLogs_CL
| where Message has "Standard-Retry"
| extend result = extract(@"Result: '([^']+)'", 1, Message)
| summarize retry_count = count(), results = make_set(result) by CorrelationId
| where retry_count > 1
| order by retry_count desc
Detect resource URI resolution warnings
Identify warnings where a tool's input file or resource path couldn't be resolved.
DiscoveryLogs_CL
| where LogLevel == "Warning"
| where Message has_any ("cannot resolve URI", "Unable to resolve URI", "Data context is empty")
| extend uri = extract(@"URI: (discovery://[^\s""]+)", 1, Message)
| project TimeGenerated, CorrelationId, uri, Message
| order by TimeGenerated desc
Troubleshooting
No data in DiscoveryLogs_CL
| Cause | Resolution |
|---|---|
| Workspace was recently created and no investigations ran | Run an investigation and generate log entries |
| Time range is too narrow | Expand the time range to the last 24 hours |
| Logs are delayed due to ingestion latency | Wait a few seconds and rerun the query |
Query timeout or slow performance
| Cause | Resolution |
|---|---|
| Query scope is too broad | Narrow the time range or add filters |
| Complex aggregations across large datasets | Use take or limit to restrict the result set, or apply summarize instead of returning raw data |