Note
Access to this page requires authorization. You can try signing in or changing directories.
Access to this page requires authorization. You can try changing directories.
Use breakpoints to pause your JavaScript code. This article explains each type of breakpoint available in DevTools, as well as when to use and how to set each type.
For an introductory tutorial using an existing webpage, see Get started debugging JavaScript.
Overview of when to use each breakpoint type
The most well-known type of breakpoint is line-of-code. But line-of-code breakpoints may be inefficient to set, especially if you don't know exactly where to look, or if you are working with a large codebase. You can save yourself time when debugging by knowing how and when to use the other types of breakpoints.
| Breakpoint type | Use this when you want to pause... |
|---|---|
| Line-of-code | On an exact region of code. |
| Conditional line-of-code | On an exact region of code, but only when some other condition is true. |
| DOM | On the code that changes or removes a specific DOM node, or the children. |
| XHR | When an XHR URL contains a string pattern. |
| Event listener | On the code that runs after an event, such as click, runs. |
| Exception | On the line of code that is throwing a caught or uncaught exception. |
| Function | Whenever a specific command, function, or method is run. |
| Logpoints | A variant that does not "break" into the debugger but instead logs a message to the console. |
Line-of-code breakpoints
Use a line-of-code breakpoint when you know the exact region of code that you need to investigate. DevTools always pauses before this line of code is run.
To set a line-of-code breakpoint in DevTools:
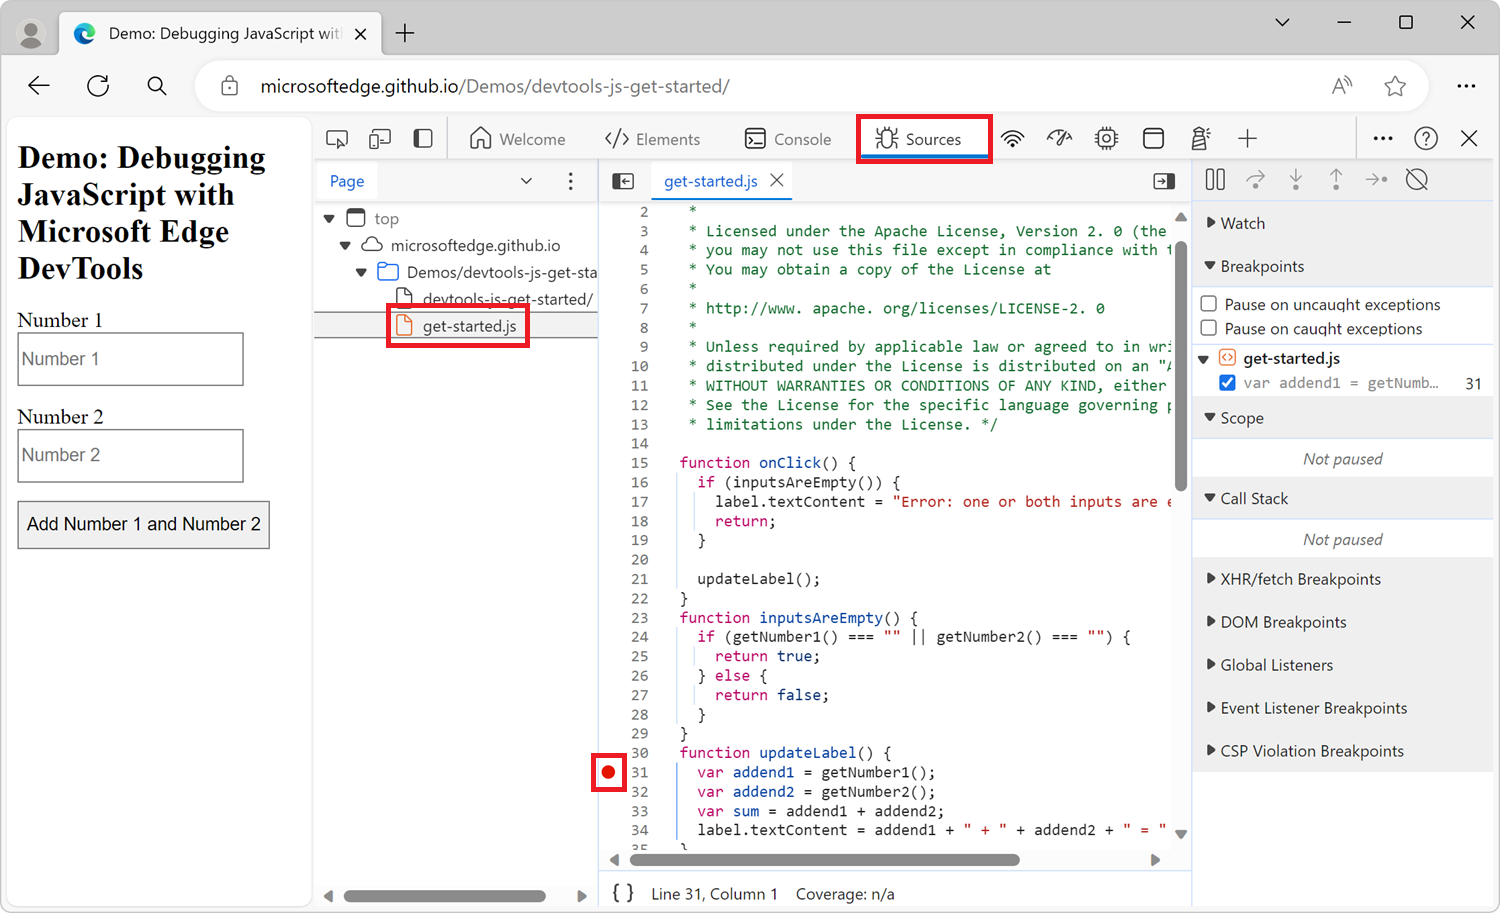
Select the Sources tool.
Open the file that contains the line of code that you want to break on.
Go to the line of code.
To the left of the line of code is the line number column. Click it. A red icon appears next to the line number column:
Line-of-code breakpoints in your code
Use the debugger statement from your code to pause on that line. This is equivalent to a line-of-code breakpoint, except that the breakpoint is set in your code, not in the DevTools UI.
console.log('a');
console.log('b');
debugger;
console.log('c');
When the above code snippet runs in Microsoft Edge, DevTools pauses on the line that contains the debugger statement, just before running the console.log('c'); line.
Conditional line-of-code breakpoints
Use a conditional line-of-code breakpoint when you know the exact region of code that you need to investigate, but you want to pause only when some other condition is true.
To set a conditional line-of-code breakpoint:
Select the Sources tool.
Open the file that contains the line of code you want to break on.
Go to the line of code.
To the left of the line of code is the line number column. Right-click it.
Select Add conditional breakpoint. A dialog is displayed underneath the line of code.
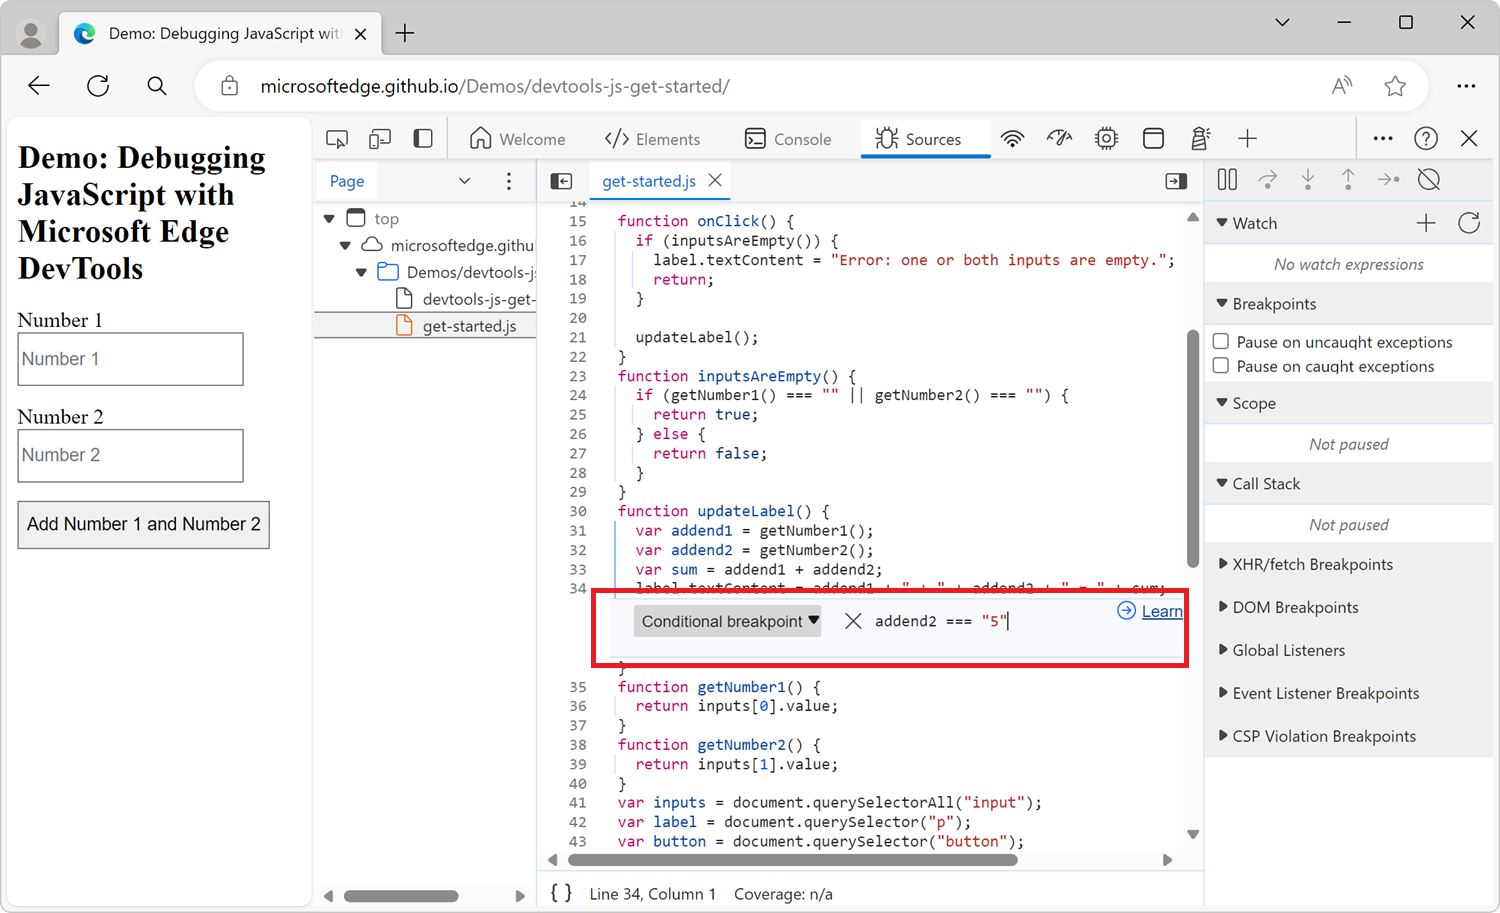
Enter your condition in the dialog.
Press Enter to activate the breakpoint. A red icon appears next to the line number column:
Manage line-of-code breakpoints
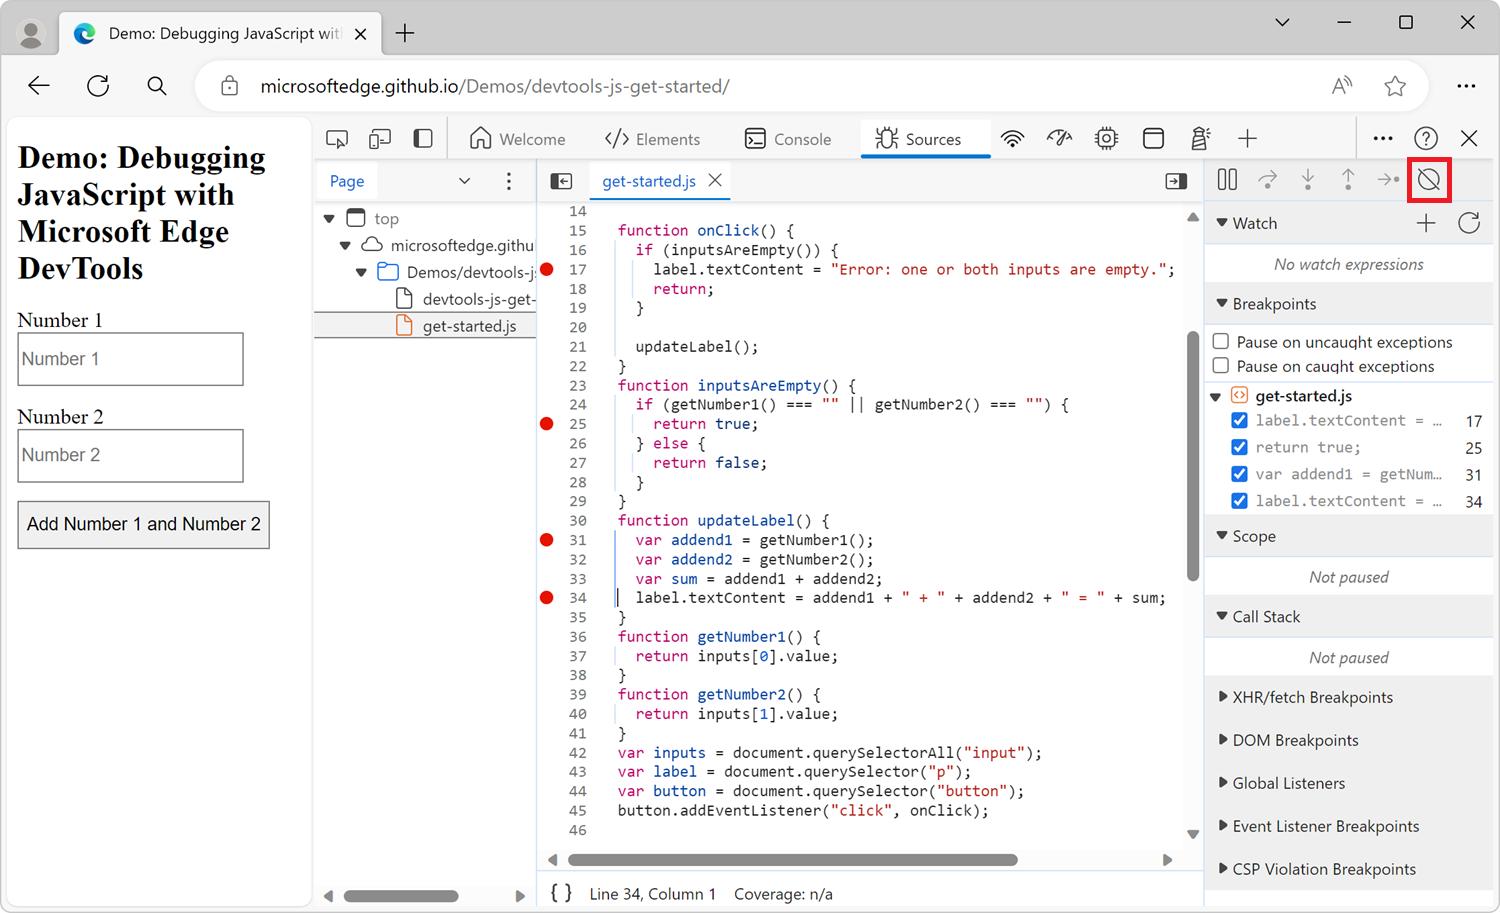
Use the Breakpoints pane to disable or remove line-of-code breakpoints from a single location.

Select the checkbox next to an entry to disable that breakpoint.
Right-click an entry to remove that breakpoint.
Right-click anywhere in the Breakpoints pane to remove all breakpoints.
To disable all breakpoints, click the Deactive breakpoints (![]() ) button:
) button:
DOM change breakpoints
Use a DOM change breakpoint when you want to pause on the code that changes a DOM node or the children.
To set a DOM change breakpoint:
Select the Elements tool.
Go the element on which you want to set the breakpoint.
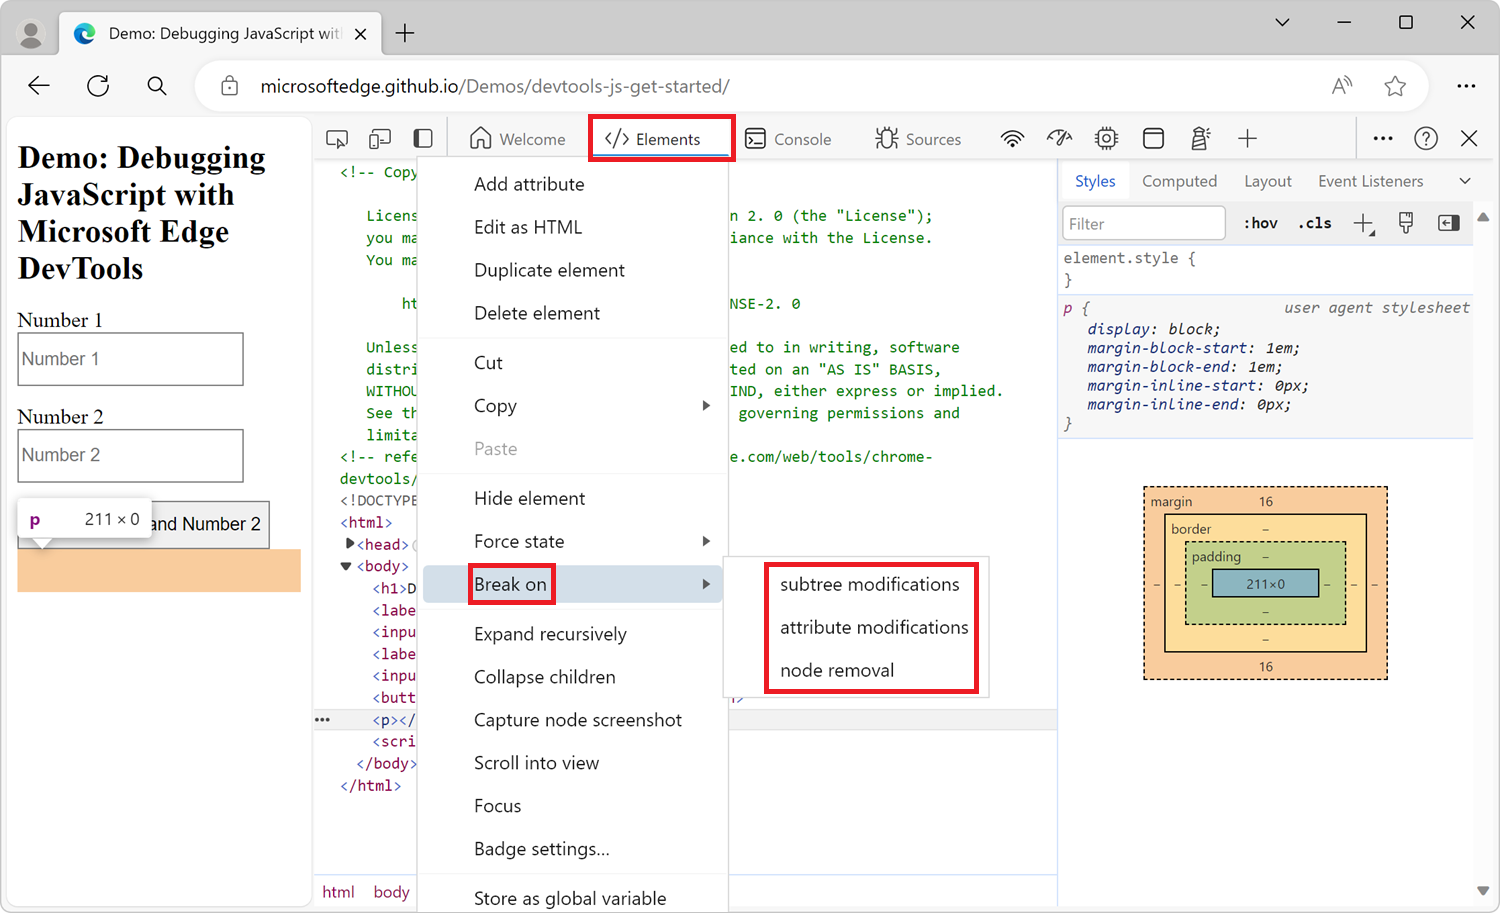
Right-click the element, click Break on, and then click subtree modifications, attribute modifications, or node removal:
Types of DOM change breakpoints
Subtree modifications. Triggered when a child of the currently selected node is removed or added, or the contents of a child are changed. Not triggered on child node attribute changes, or on any changes to the currently selected node.
Attributes modifications: Triggered when an attribute is added or removed on the currently selected node, or when an attribute value changes.
Node Removal: Triggered when the currently selected node is removed.
XHR/fetch breakpoints
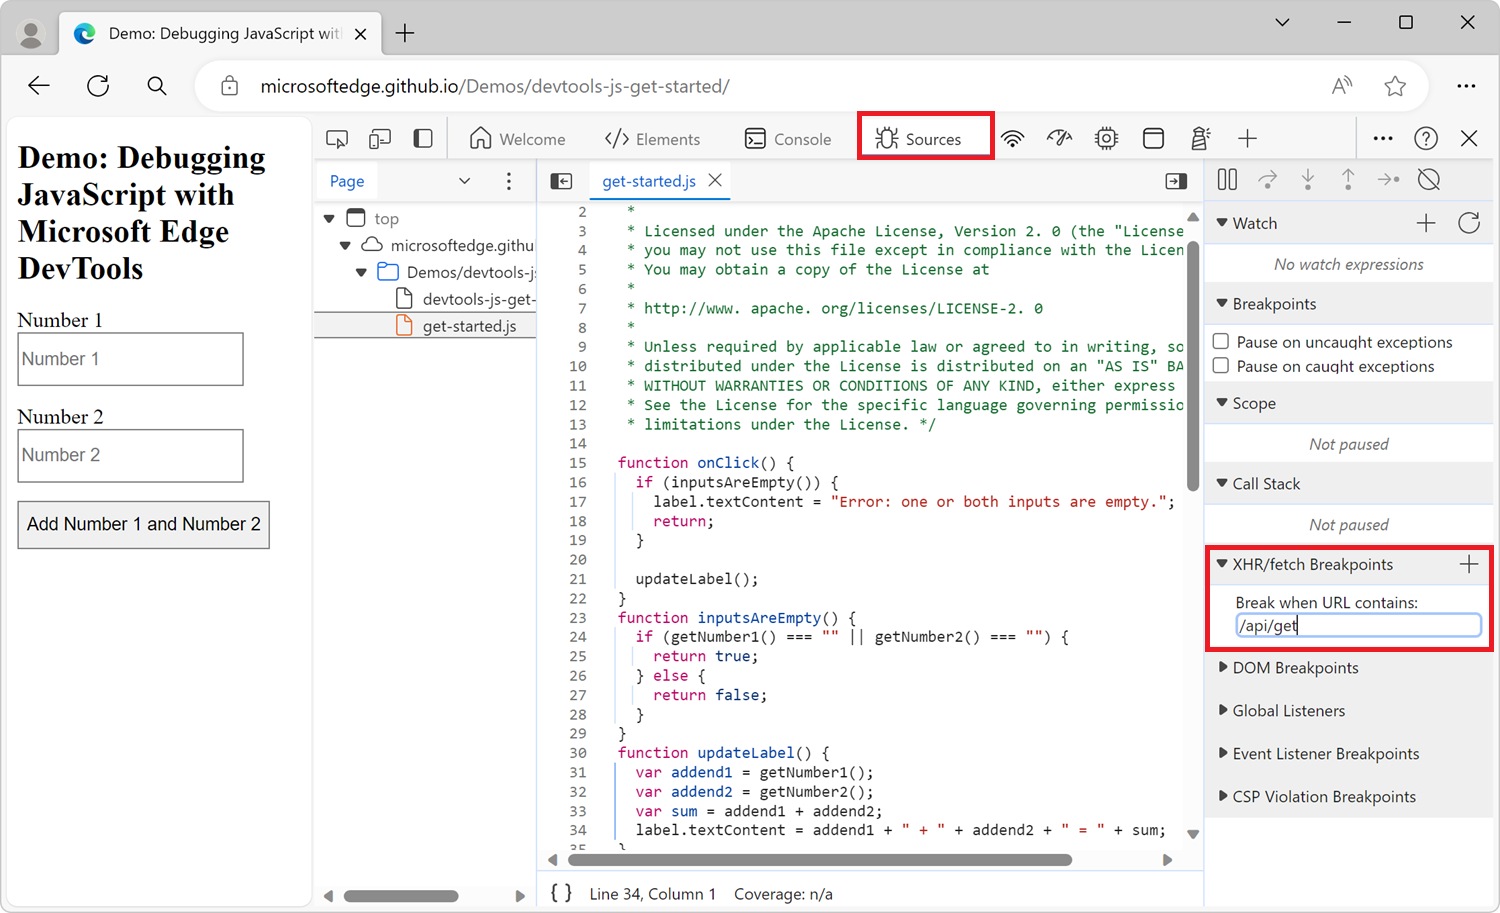
Use an XHR/fetch breakpoint when you want to break when an XmlHttpRequest (XHR) or Fetch request occurs. DevTools pauses on the line of code where the XHR or Fetch request occurs.
One example of when this is helpful is when your webpage is requesting an incorrect URL, and you want to quickly find the XHR or Fetch source code that is causing the incorrect request.
To set an XHR breakpoint:
Select the Sources tool.
Expand the XHR/fetch Breakpoints panel.
Click Add breakpoint.
Enter all or part of the URL that you want to break on. DevTools pauses when the value you enter is present anywhere in an XHR or Fetch request URL.
Press Enter to confirm.
Event listener breakpoints
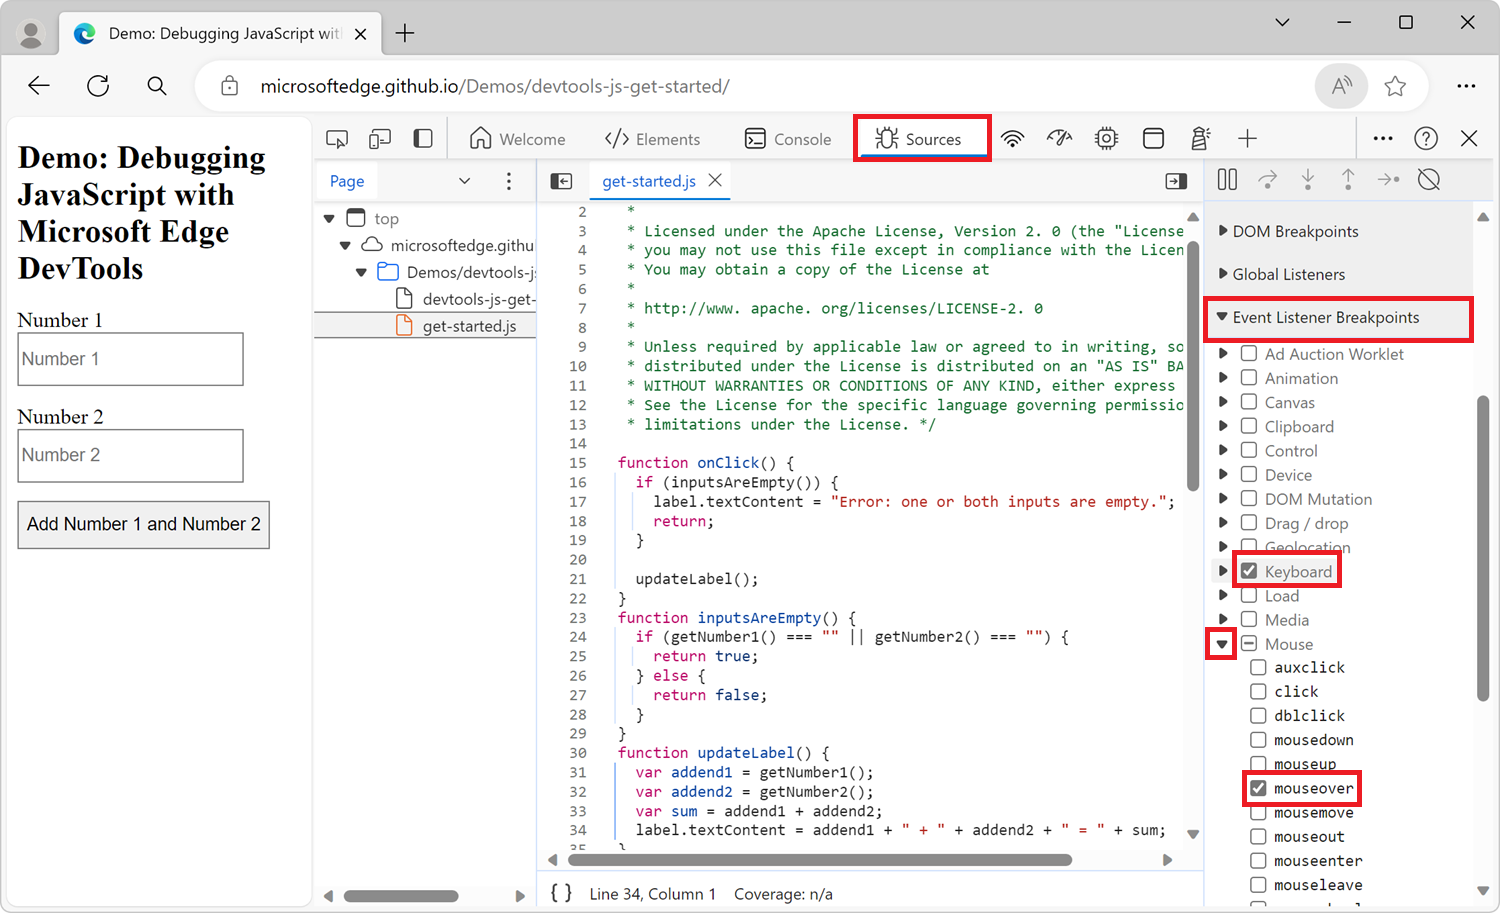
Use event listener breakpoints when you want to pause on the event listener code that runs after an event is fired. You can select specific events, such as click, or categories of events, such as all mouse events.
Select the Sources tool.
Expand the Event Listener Breakpoints panel. DevTools shows a list of event categories, such as Animation.
Select a category, to pause whenever any event from that category is fired. Or, expand the category, and then select a specific event:
Exception breakpoints
Use exception breakpoints when you want to pause on the line of code that is throwing a caught or uncaught exception.
Select the Sources tool.
To pause when the code throws a JavaScript exception, in the Breakpoints pane, select the Pause on uncaught exceptions checkbox.
To pause on caught exceptions, such as when an exception is caught by a
try/catchblock, select the Pause on caught exceptions checkbox: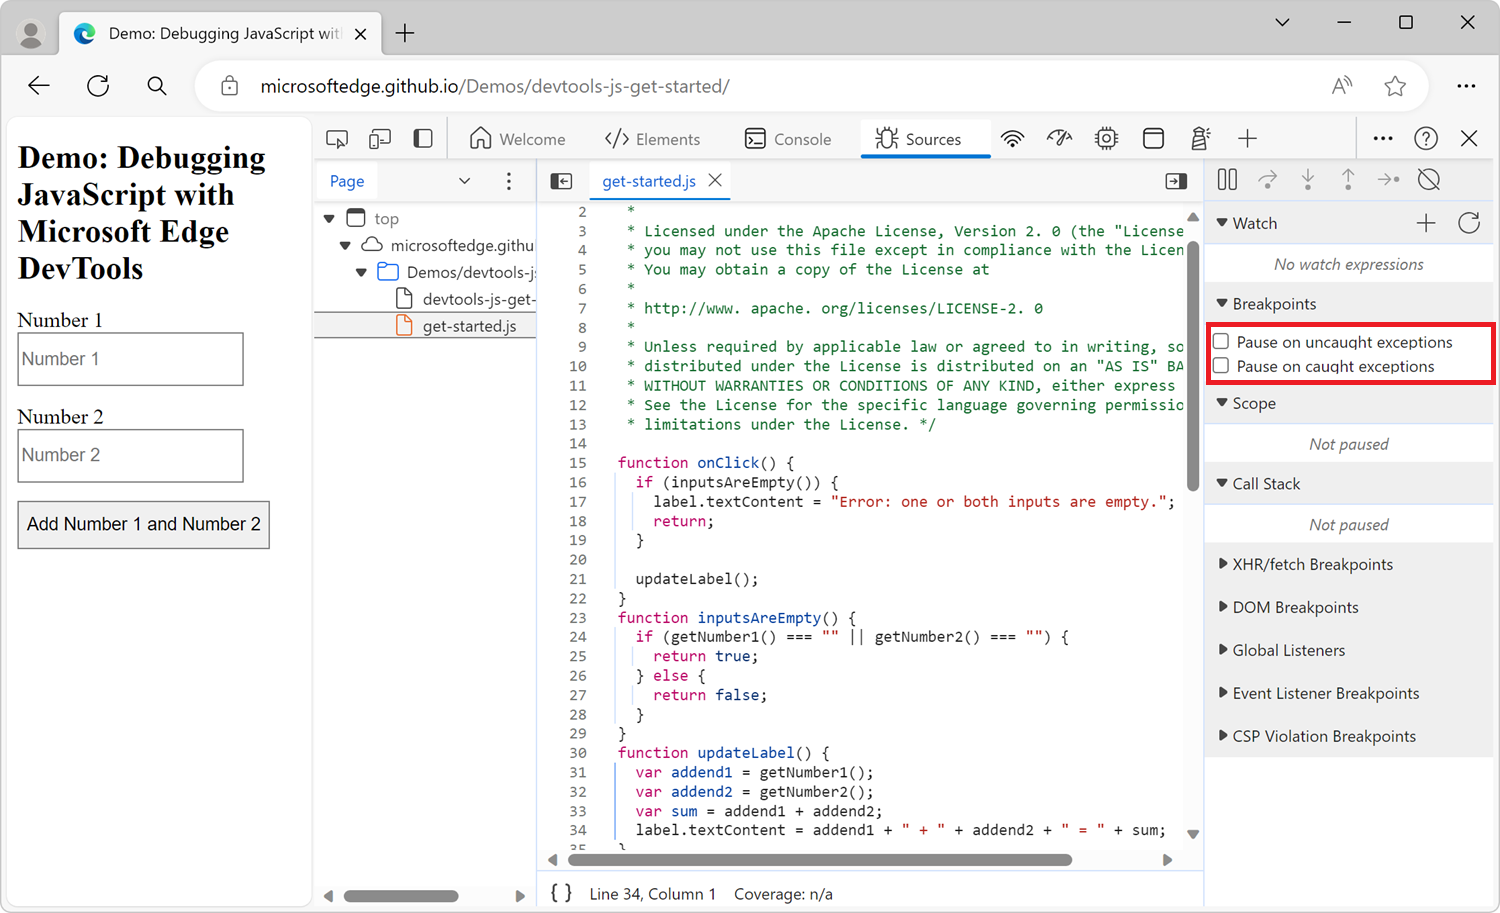
Function breakpoints
Run the debug(function) method, where function is the JavaScript function that you want to debug, when you want to pause whenever a specific function is run. You can insert debug() into your code (such as when using a console.log() statement), or run the method from the DevTools Console tool.
debug() is equivalent to setting a line-of-code breakpoint on the first line of the function.
function sum(a, b) {
  let result = a + b; // DevTools will pause before running this line.
  return result;
}

// Call the debug method by passing a reference to the function object,
// not its name as a string.
debug(sum);

sum();
Make sure the target function is in scope
DevTools throws a ReferenceError if the function you want to debug isn't in scope.
(function () {
  function foo() {
    console.log('foo');
  }

  function bar() {
    console.log('bar');
  }

  // Here, calling debug(bar) works because
  // bar is defined in the current scope.
  debug(bar);

  bar();
})();

// Here, calling debug(foo) won't work, because foo
// isn't defined in the current scope.
debug(foo);
When you're calling debug() from the Console tool, here's a technique to ensure that the target function is in scope:
Set a line-of-code breakpoint somewhere where the function is in scope.
Trigger the breakpoint. Your code is paused at the breakpoint, and the variables for the current function are in scope.
Call
debug()in the DevTools Console, while the code is still paused on your line-of-code breakpoint.
Logpoints
A Logpoint is a breakpoint variant that doesn't "break" in the debugger, but instead logs a message directly to the console. You insert a logpoint via DevTools the same way you would any other breakpoint.
To set a logpoint:
Select the Sources tool.
Open the file that contains the line of code where you want to insert a logpoint.
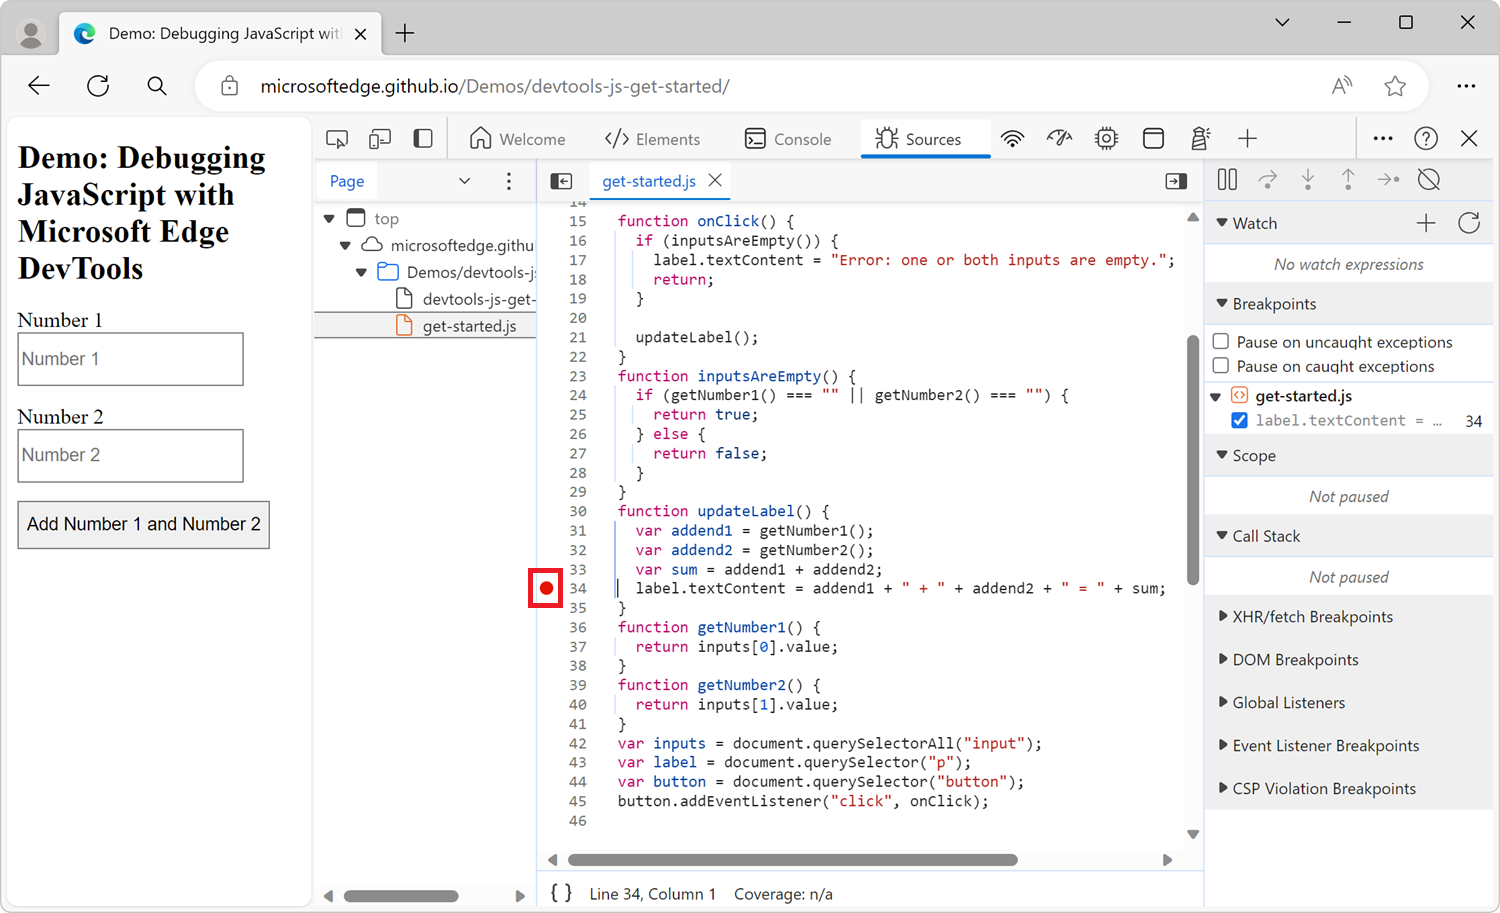
Right-click on the left of the line of code, in the line number column.
Select Add logpoint. A dialog is displayed underneath the line of code.
Enter a message or a JavaScript expression that will get evaluated when the logpoint is hit.
Press Enter to activate the logpoint. A red icon appears next to the line number.
See also:
See also
- JavaScript debugging features - Using the UI of the debugger in the Sources tool.
- Get started debugging JavaScript - An introductory tutorial using an existing webpage.
- Sources tool overview - The debugger is part of the Sources tool, which includes a JavaScript editor.
Note
Portions of this page are modifications based on work created and shared by Google and used according to terms described in the Creative Commons Attribution 4.0 International License. The original page is found here and is authored by Kayce Basques.
![]() This work is licensed under a Creative Commons Attribution 4.0 International License.
This work is licensed under a Creative Commons Attribution 4.0 International License.