What's New in DevTools (Microsoft Edge 121)
To check out the latest features of Microsoft Edge DevTools and the Microsoft Edge DevTools extension for Microsoft Visual Studio Code and Visual Studio, read these announcements.
To stay up to date and get the latest DevTools features, download an Insiders preview version of Microsoft Edge. Whether you're on Windows, Linux, or macOS, consider using Canary (or another preview channel) as your default development browser. The Beta, Dev, and Canary versions of Microsoft Edge run as separate apps, side-by-side with the stable, released version of Microsoft Edge. See Microsoft Edge Insider Channels.
For the latest announcements, follow the Microsoft Edge team on Twitter. To report a problem with DevTools or ask for a new feature, file an issue in the MicrosoftEdge/DevTools repo.
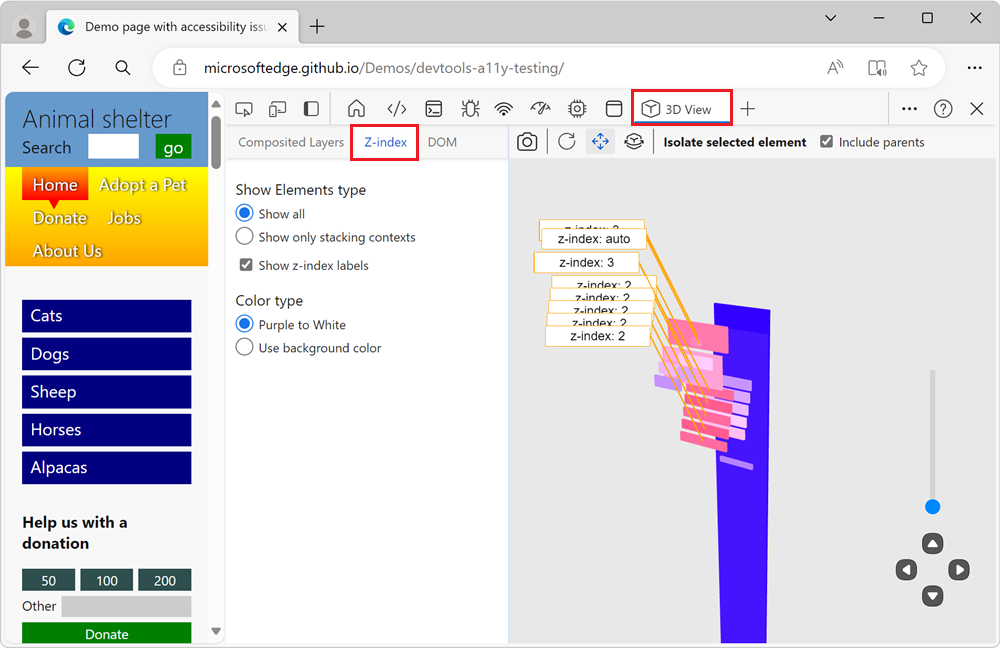
Z-index and DOM tabs in 3D View tool are now working
In recent versions of Microsoft Edge, there was a bug in the 3D View tool that caused the Z-index and DOM tabs to not work correctly. The tabs would crash or freeze and show the content for the Composited Layers tab instead. This issue has been fixed in Microsoft Edge 121:

See also:
Correct Hide debugger or Show debugger icon is shown in Sources tool
The icon used to collapse or expand the Debugger pane on the right in the Sources tool was incorrect. The Hide debugger icon was displayed instead of the Show debugger icon, and vice versa:

In Microsoft Edge 121, the correct icon is now shown:

See also:
Added source map support in the Coverage tool
Before Microsoft Edge 121, the Coverage tool only displayed information for generated files, and omitted source files even when a source map was attached. The Coverage tool has now been improved so that when a generated file has a source map attached, the Coverage tool displays information for the source file as well as for the generated file.
For example, before Microsoft Edge 121, the coverage report for the Slow Calendar demo page contained only a single, static line, for the bundle.js file. The bundle.js line in the coverage report can now be expanded to show all of the original source files that make up this compiled bundle.js file:

See also:
Advanced filtering capabilities in the Bottom-Up, Call Tree, and Event Log tabs in the Performance tool
In the Performance tool, the following advanced filtering buttons were added to the Bottom-Up, Call Tree, and Event Log tabs:
- Match Case.
- Use Regular Expression.
- Match whole word.

Also, in the Bottom-Up tab, the filter has been updated to now only apply to the top-level items, instead of matching every node.
See also:
Tooling for PWA Window Controls Overlay
The Application tool has a new Window Controls Overlay section under Manifest, to help PWA developers see a preview of how their application handles window controls, without having to install the PWA and make the styling changes that are necessary to accommodate window controls:

Use the Window Controls Overlay section to emulate window controls for Windows, Linux, and macOS.
See also:
- Simulate the Window Controls Overlay API without installing your PWA
- Display content in the title bar area using Window Controls Overlay
- Application tool, to manage storage
Announcements from the Chromium project
Microsoft Edge 121 also includes the following updates from the Chromium project:
- Elements improvements
- Improved source map support
- Performance panel improvements
- Indentation markers in the Sources panel
- Helpful tooltips for overridden headers and content in the Network panel
- New Command Menu options for adding and removing request blocking patterns
- The CSP violations experiment is removed
- Accessibility