Draw and insert shapes on a map (preview)
[This topic is pre-release documentation and is subject to change.]
Add a drawing panel to your maps to let users draw and label shapes on them. You can also insert and label predefined shapes to highlight specific regions or areas of interest.
Important
- This is a preview feature.
- Preview features aren’t meant for production use and may have restricted functionality. These features are available before an official release so that customers can get early access and provide feedback.
Prerequisites
- Create a canvas app and make sure it meets the geospatial prerequisites.
- Insert a map.
Draw and label shapes on an interactive map
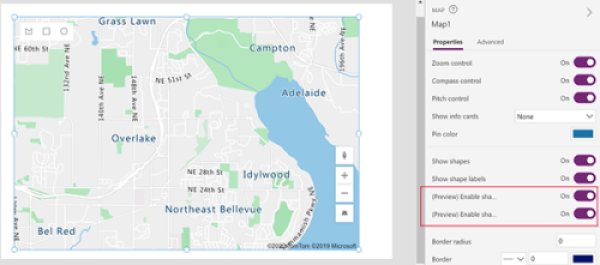
In the map control's Properties pane, turn on the following properties:
(Preview) Enable Shape Drawing
(Preview) Enable Shape Deleting and Label Editing
A drawing panel appears in the upper-left corner of the map control.
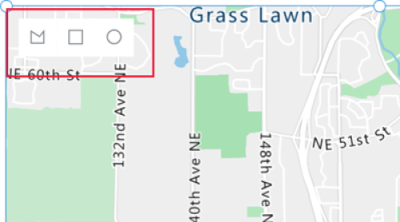
The panel features three tools:
- A polygon drawing tool for drawing freeform shapes
- A square drawing tool for drawing squares and rectangles
- A circle drawing tool for drawing circles and ovals
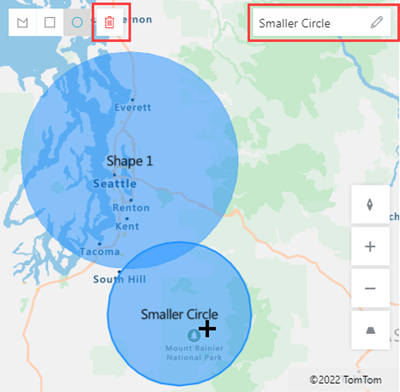
Select a tool and draw a shape on the map. To finish and close a freeform shape, double-click the final point.
Drawn shapes are automatically labeled. To change a label, select the shape, and then enter a new name in the box in the upper-right corner of the map.
To delete a shape, select it, and then select the trashcan.
Import GeoJSON shapes into a map
If you already have shapes defined in GeoJSON format, you can import them into your map. For example, you might have a shape that defines a specific area that you want to highlight.
The GeoJSON string for each shape in your data source needs to be in the correct format, in a single cell.
To import shapes, first connect your data source to the map control. Then, assign the control's properties to the appropriate columns in the data source, as in the following example:
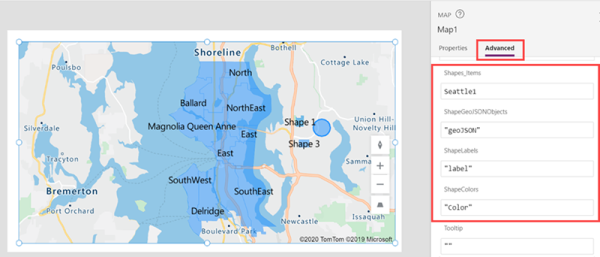
Your data source must be a named table with at least three columns. Each column corresponds to an advanced property of the map control.
| Column description | Corresponds to | Required |
|---|---|---|
| The shape's GeoJSON coordinates in the correct format | ShapeGeoJSONObjects | Required |
| Shape label | ShapeLabels | Optional |
| Shape color | ShapeColors | Optional |
Tip
Specify the color using a name, CSS color definition, or RGBA value. If the color isn't provided, then the shape will use the app's defaults.
The data source must be named. If you're using an Excel workbook as the data source, use the name of the table that contains the data. In this example, we'll import shapes from an Excel table named Seattle1.
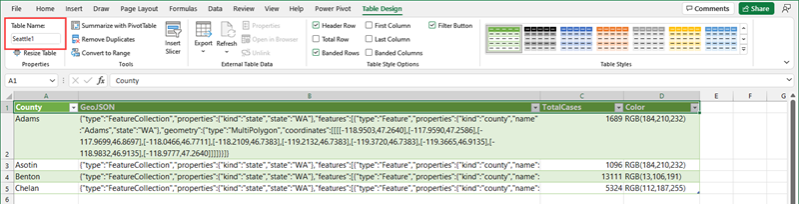
Copy the following sample data into a blank workbook, format it as a table, and name the table Seattle1. Then, connect the workbook to your map as a data source. For detailed instructions using a similar example, see Use a data source to place pins on a map.
County GeoJSON TotalCases Color Adams {"type":"FeatureCollection","properties":{"kind":"state","state":"WA"},"features":[{"type":"Feature","properties":{"kind":"county","name":"Adams","state":"WA"},"geometry":{"type":"MultiPolygon","coordinates":[[[[-118.9503,47.2640],[-117.9590,47.2586],[-117.9699,46.8697],[-118.0466,46.7711],[-118.2109,46.7383],[-119.2132,46.7383],[-119.3720,46.7383],[-119.3665,46.9135],[-118.9832,46.9135],[-118.9777,47.2640]]]]}}]} 1689 RGB(184,210,232) Asotin {"type":"FeatureCollection","properties":{"kind":"state","state":"WA"},"features":[{"type":"Feature","properties":{"kind":"county","name":"Asotin","state":"WA"},"geometry":{"type":"MultiPolygon","coordinates":[[[[-117.0388,46.4261],[-117.0607,46.3549],[-116.9841,46.2946],[-116.9676,46.2015],[-116.9238,46.1687],[-116.9841,46.0920],[-116.9183,45.9934],[-117.4825,45.9989],[-117.4825,46.1194],[-117.4222,46.1194],[-117.4222,46.3823],[-117.2305,46.4096],[-117.2305,46.4644],[-117.1977,46.4206]]]]}}]} 1096 RGB(184,210,232) Benton {"type":"FeatureCollection","properties":{"kind":"state","state":"WA"},"features":[{"type":"Feature","properties":{"kind":"county","name":"Benton","state":"WA"},"geometry":{"type":"MultiPolygon","coordinates":[[[[-119.8759,46.6287],[-119.6240,46.6452],[-119.5144,46.7273],[-119.4542,46.6780],[-119.2680,46.5192],[-119.2680,46.2727],[-119.0434,46.1906],[-118.9448,46.0756],[-118.9393,46.0263],[-118.9886,45.9989],[-119.1256,45.9332],[-119.4323,45.9167],[-119.5692,45.9277],[-119.6678,45.8565],[-119.8704,45.8346],[-119.8649,46.0427],[-119.8759,46.6287]]]]}}]} 13111 RGB(13,106,191) Chelan {"type":"FeatureCollection","properties":{"kind":"state","state":"WA"},"features":[{"type":"Feature","properties":{"kind":"county","name":"Chelan","state":"WA"},"geometry":{"type":"MultiPolygon","coordinates":[[[[-120.7029,48.5292],[-120.6536,48.5347],[-120.6262,48.4964],[-120.6646,48.4471],[-120.6481,48.3978],[-120.5605,48.3704],[-120.5879,48.3211],[-120.5112,48.3101],[-120.3524,48.2170],[-120.3633,48.1568],[-120.3250,48.1294],[-120.1443,48.0637],[-120.1443,48.0363],[-120.0895,48.0199],[-120.0512,47.9596],[-119.8704,47.9596],[-119.9964,47.7789],[-120.2100,47.7515],[-120.1990,47.6803],[-120.2374,47.5872],[-120.3031,47.5215],[-120.3195,47.4557],[-120.2921,47.4010],[-120.0895,47.3407],[-120.0950,47.2640],[-120.3907,47.2586],[-120.5276,47.3352],[-120.5605,47.3079],[-120.8015,47.4229],[-120.9165,47.4284],[-121.1137,47.5981],[-121.1301,47.6748],[-121.0644,47.7132],[-121.1192,47.7789],[-121.0699,47.8282],[-121.1520,47.8446],[-121.1739,47.8884],[-121.1630,47.9541],[-121.1192,47.9980],[-121.1520,48.0418],[-121.0151,48.0746],[-120.9439,48.1130],[-120.9548,48.1513],[-120.9056,48.1623],[-121.0041,48.2937],[-121.0699,48.3156],[-121.0425,48.3485],[-121.0644,48.3923],[-121.0370,48.4306],[-121.0480,48.4854],[-120.8563,48.5511],[-120.7851,48.5073]]]]}}]} 5324 RGB(112,187,255) Bind the following advanced properties of the map control to the appropriate columns in the data source:
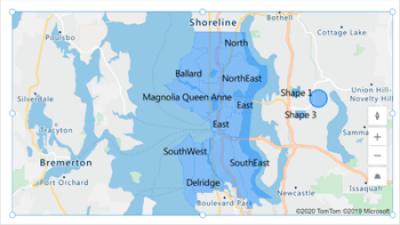
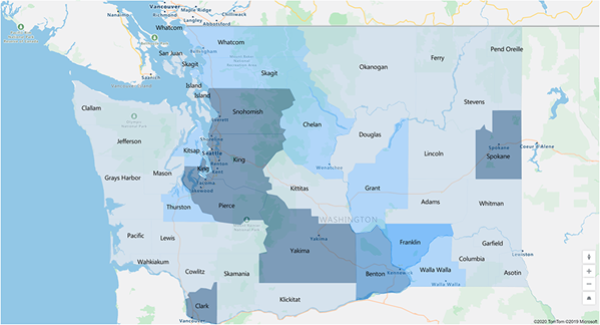
Property Column ShapeGeoJSONObjects GeoJSON ShapeLabels County ShapeColors Color Your map should look something like this:
Display the perimeter and area of drawn or inserted shapes (preview)
Your apps can show the perimeter (in feet) and area (in square feet) of a selected shape on a map.
- In your app, open the Insert tab and expand Display.
- Select Text label to insert a label on the app screen. Move and resize it as you like.
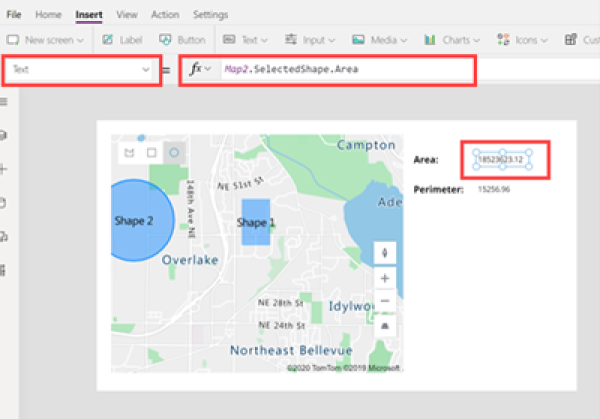
- Change the Text property of the label control to [Map].SelectedShape.Area or [Map].SelectedShape.Perimeter to display the selected shape's area or perimeter. (Hint: Enter the given value in the formula bar or on the Properties tab, whichever you prefer.)
In the following example, we used four text labels to display both the area and perimeter of the selected shape:
Other interactive map features
Other geospatial controls
To see dynamic address suggestions as you type, use the Address input control.
Feedback
Coming soon: Throughout 2024 we will be phasing out GitHub Issues as the feedback mechanism for content and replacing it with a new feedback system. For more information see: https://aka.ms/ContentUserFeedback.
Submit and view feedback for