Customize activities (event-level) statistics
The Power Automate Process Mining desktop app provides statistics at the level of activities, or events, in both chart and table form. You can customize many aspects of the chart and the tabular data.
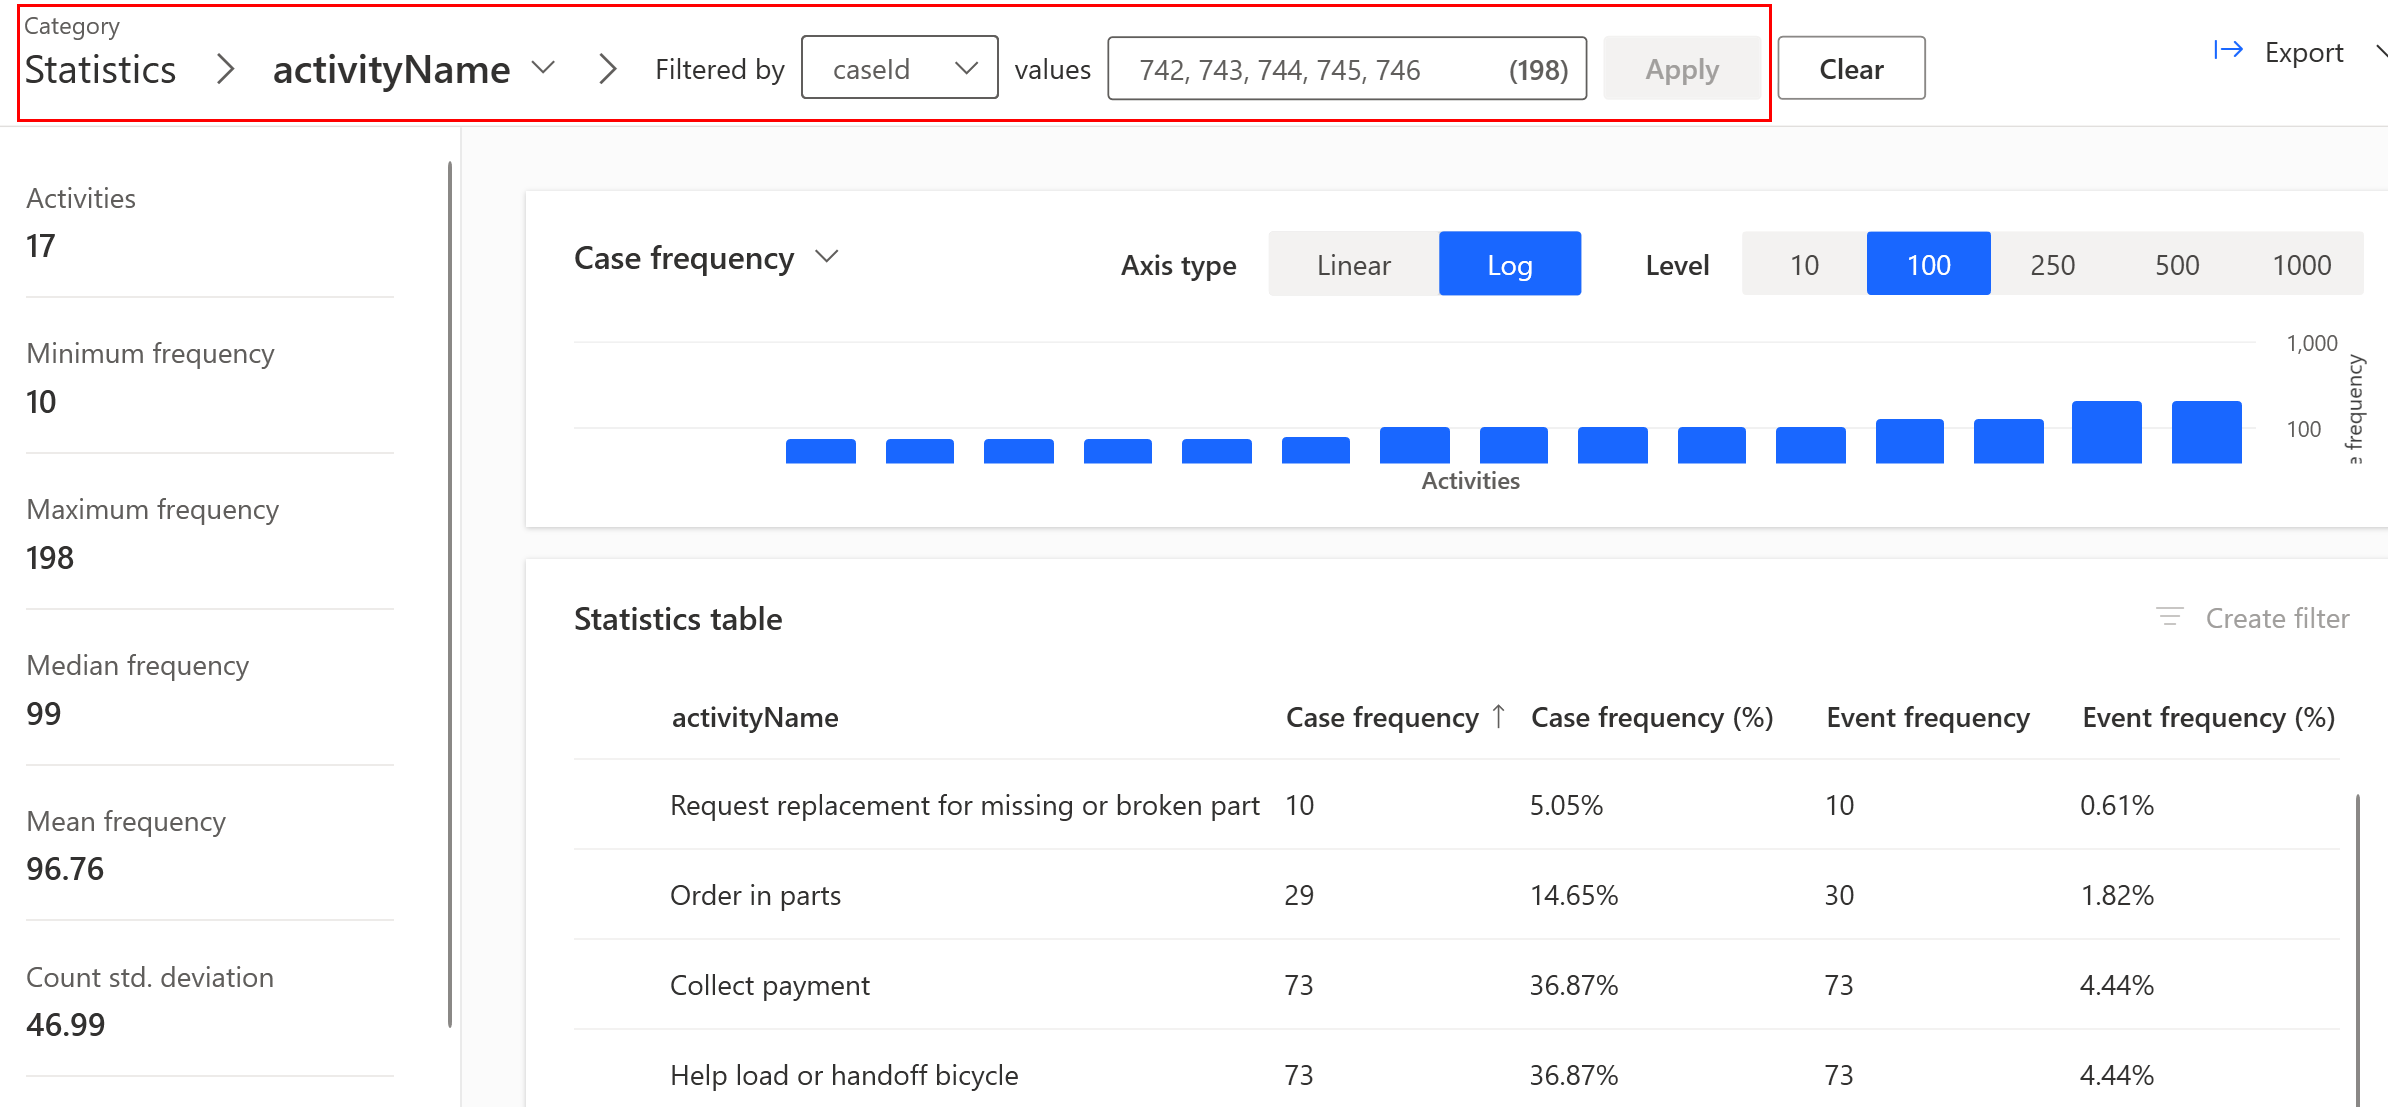
On the left panel in the Processes screen, select Statistics.
In the Category group, select the attribute from the dropdown menu. In the following screenshot, the selected attribute is activityName.
Select Enable filter.
In the Filtered by dropdown menu, select the filter data. In the following screenshot, the filtered data is caseid.
Select the empty values field.
Select all values by hovering over the area to the left of Attribute value and selecting the circle.
Select Apply,
Statistical chart and table of activities
The metrics in the following table are in the chart and the table of activities.
| Metric | Description |
|---|---|
| Case frequency | Number of cases in which an activity occurs |
| Case frequency (%) | Percentage of cases in which an activity occurs relative to all cases in the process |
| Event frequency | Number of times an activity occurs in the process |
| Event frequency (%) | Percentage of occurrences of an activity relative to all activities in the process |
| Maximum repetitions | Largest number of activity repetitions in process instances |
| Total duration | Total duration of each activity in the process; available only if two timestamps are recorded in the data and imported with the process |
| Total duration (%) | Percentage of the total duration of each activity relative to the total duration of all cases in the process; available only if two timestamps are recorded in the data and imported with the process |
| Mean duration | Average duration of each activity in the process; available only if two timestamps are recorded in the data and imported with the process |
| Mean duration (%) | Percentage of each activity's average duration relative to the average duration of all cases in the process; available only if two timestamps are recorded in the data and imported with the process |
| Minimum duration | Shortest duration of each activity in the process; available only if two timestamps are recorded in the data and imported with the process |
| Maximum duration | Longest duration of each activity in the process; available only if two timestamps are recorded in the data and imported with the process |
| Duration range | Difference between the longest and shortest duration of each activity in the process; available only if two timestamps are recorded in the data and imported with the process |
| Duration standard deviation | Standard deviation of each activity in the process; available only if two timestamps are recorded in the data and imported with the process |
| Self-loop count | Number of self-loops on an activity |
| Self-loop (%) | Percentage of self-loops on an activity relative to the total occurrence of that activity in the process |
| Loop count | Number of times an activity is involved in a loop |
| Loop (%) | Percentage of involvements of an activity in a loop relative to the total occurrence of that activity in the process |
| Rework count | Number of times an activity involved in rework |
| Rework (%) | Percentage of involvements of an activity in rework relative to the total occurrence of that activity in the process |
| Loop inflow | Value of loop inflow of an activity in the process |
| Loop inflow (%) | Percentage of loop inflow of an activity relative to the total occurrence of that activity in the process |
| Loop outflow | Value of loop outflow of an activity in the process |
| Loop outflow (%) | Percentage of loop outflow of an activity relative to the total occurrence of that activity in the process |
| Net loop gain | Value of net loop gain of an activity in the process |
| Net loop gain (%) | Percentage of net loop gain of an activity relative to the total occurrence of that activity in the process |
Along with these standard statistics, the chart displays all event-level custom metrics that have the continuous output data type.
The table of activities displays event-level standard and custom metrics. In the table, all event-level custom metrics are available, whether their output data type is discrete or continuous.
Metrics in the summary row
The metrics in the following table are in the summary row.
| Metric | Description |
|---|---|
| Activities (value) | Total number of unique values for activities or event-level attributes The Activity attribute is defined during process import and configuration and isn't affected by the selection of mining attribute on the process map. |
| Minimum frequency | Smallest number of occurrences of a given activity (attribute value) in a single case |
| Maximum frequency | Largest number of occurrences of a given activity (attribute value) in a single case |
| Median frequency | Median number of occurrences of a given activity (attribute value) in a single case |
| Mean frequency | Mean number of occurrences of a given activity (attribute value) in a single case |
| Count std. deviation | Standard deviation of activity (attribute value) occurrences in a view |
| Minimum duration and maximum duration | Global minimum and maximum duration of a single event |
| Mean duration | Average duration of events |
| Duration standard deviation | Standard deviation of activity (attribute value) durations in a view |
| Self-loop events | Percentage of events in self-loops relative to the total number of events in the view |
| Loop events | Percentage of events in loops relative to the total number of events in the view |
| Rework events | Percentage of events in rework relative to the total number of events in the view |
See also
Feedback
Coming soon: Throughout 2024 we will be phasing out GitHub Issues as the feedback mechanism for content and replacing it with a new feedback system. For more information see: https://aka.ms/ContentUserFeedback.
Submit and view feedback for