Full-stack monitoring in Azure
Your organization is moving all its systems from an on-premises location to Azure, and wants you to design a monitoring strategy. This unit explains how a full-stack monitoring strategy can improve customer experience by providing the ability to identify and mitigate issues across all the layers of your applications and infrastructure.
Use full-stack monitoring
Full-stack monitoring is a complete approach to monitoring, triaging, and diagnosing application, infrastructure, and security issues. Full-stack monitoring includes telemetry collection, tracking key performance indicators, isolating problems, and analyzing root causes.
Your applications and infrastructure might face different kinds of potentially damaging issues, such as poor response times, changing usage rates, exceptions, and security risks. Your response must be appropriate to the issue type. You might respond by scaling up capacity to meet increased load, or by changing your application or infrastructure to improve performance and reduce errors.
With the right tools, you can:
- Monitor your infrastructure and application performance.
- Monitor for security risks and suspicious activity.
- Collect information on issues as soon as they arise.
- Analyze and respond to the information you collect.
By monitoring your applications and infrastructure with a full-stack approach, you respond to changes and issues quickly and appropriately. This strategy can help your organization become more productive, cost-effective, secure, and competitive.
Monitor your applications
Monitor your application for issues while you develop it to prevent errors and exceptions later in production. To improve your development lifecycle, ensure that your code gets pushed to the next stage of the development cycle only if it successfully passes the necessary checks.
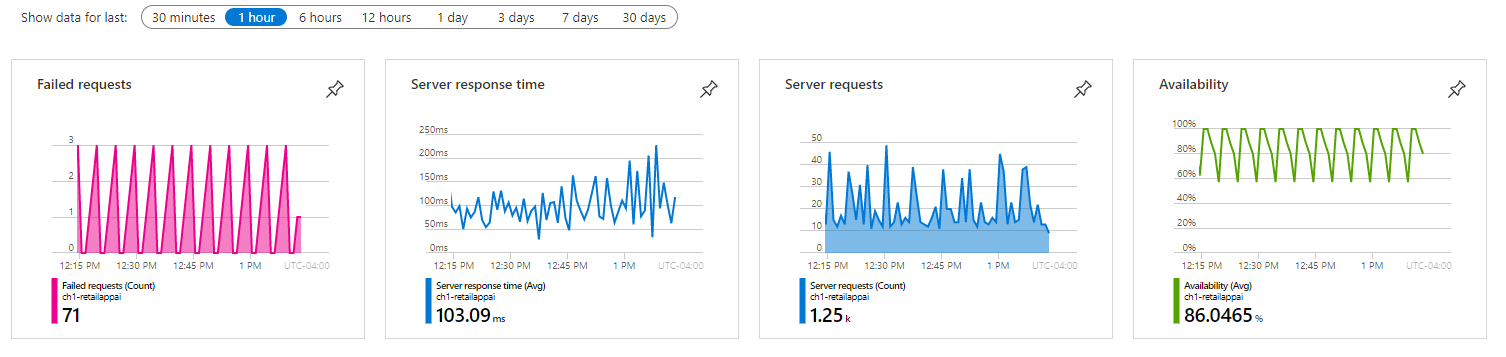
Also monitor your application when it's live and in use. You might be faced with failing requests, high server response times, or availability issues. By monitoring for live issues, you identify these types of problems and risks promptly, and can respond effectively to keep your application healthy.
To improve your applications' health and build better applications in future, configure alerts and automated responses to help you deal with application issues.
Monitor your infrastructure
Different kinds of issues can affect your infrastructure. You might have to deal with performance issues or problems that could render your services unreachable or the entire infrastructure unavailable. Any of these issues can result in decreased productivity, financial loss, or damage to your organization's reputation.
To deal with any issues that arise in a timely and effective way, you can configure alerts to monitor your infrastructure for various issues. For example, you can configure alerts for:
- Your infrastructure's resource utilization.
- Your infrastructure's availability and health.
- A specific event occurring at the operating-system level.
You can configure alerts to start a process that notifies a person or team to take appropriate action. You can also trigger automated responses to alerts with playbooks and webhooks.
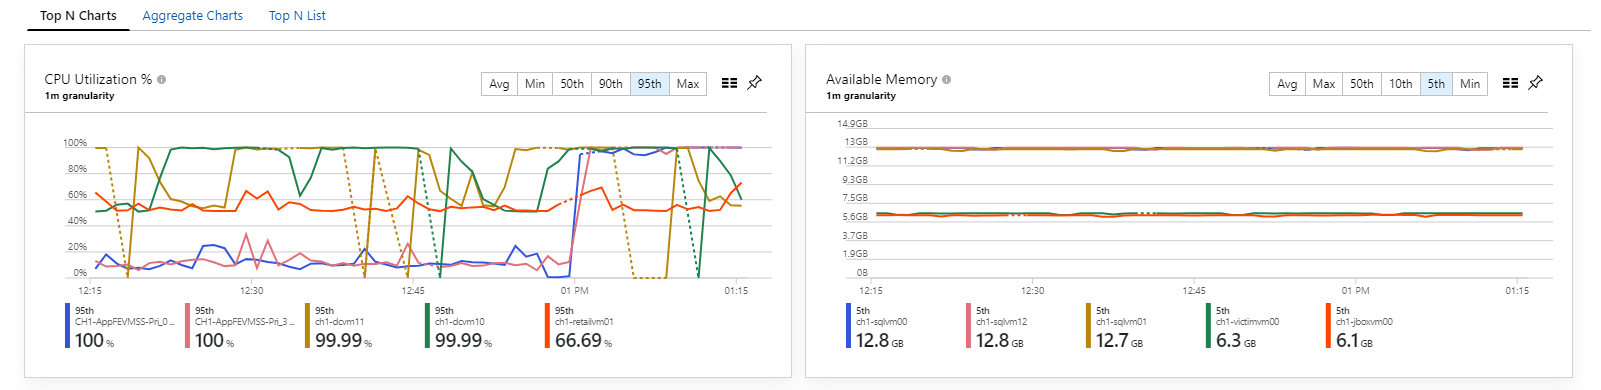
You can also use infrastructure monitoring data for operational analysis and capacity planning. You can collect performance data from virtual machine (VM) guest operating systems into charts for comparison and trending purposes to inform decision making.
Monitor Azure platform resources
In addition to monitoring your deployed applications and infrastructure, you can use Azure's built-in capabilities to monitor your other Azure platform resources. Azure resources such as Storage Accounts, Key Vaults, and Azure Cosmos DB databases have performance metrics and resource logs that you can view and analyze to track performance and availability.
These and other Azure resource types offer dedicated insights that provide predefined monitoring experiences across subscriptions, resource groups, and other resources. The following screenshot shows the Azure Monitor storage insight displaying usage and latency for multiple storage accounts across two subscriptions.

You can also view and collect logs related to Active Directory for your Azure tenant, and Service Health and activity logs for Azure subscriptions. A full-stack monitoring solution includes visibility into the Azure platform resources your application and infrastructure depend on.
Monitor security
It's also essential to monitor the security of your applications and infrastructure to ensure that they always remain protected and available. You should monitor and alert on data exfiltration and on any risks to your infrastructure's security, such as suspicious user accounts or malicious IP addresses. Your security monitoring solution should include strong, automated anomaly detection and event management to combine multiple related events into a single actionable alert.
Summary
Taking a full-stack approach to monitoring your applications and infrastructure helps you respond appropriately and more effectively to issues. You can strengthen your protection and build improved applications and infrastructure. The full-stack approach also helps you gain situational awareness, and you learn from the issues that affect your environment.