Manage enterprise security by using Microsoft Sentinel
Your financial organization constantly deals with customers and partners across different regions in the world. Many transactions happen every day, and each transaction must be monitored and protected regardless of its type or the devices and users involved. Your organization's security and monitoring strategy must focus on enterprise-wide security and monitoring.
This unit describes how Microsoft Sentinel helps monitor and respond to security threats across an enterprise-level organization. You can use Microsoft Sentinel to:
- Get a detailed overview of your enterprise, potentially across multiple clouds and on-premises locations.
- Avoid reliance on complex and disparate tools.
- Use enterprise-grade AI, built by experts, to identify and handle threats across your organization.
Connect your data sources to Microsoft Sentinel
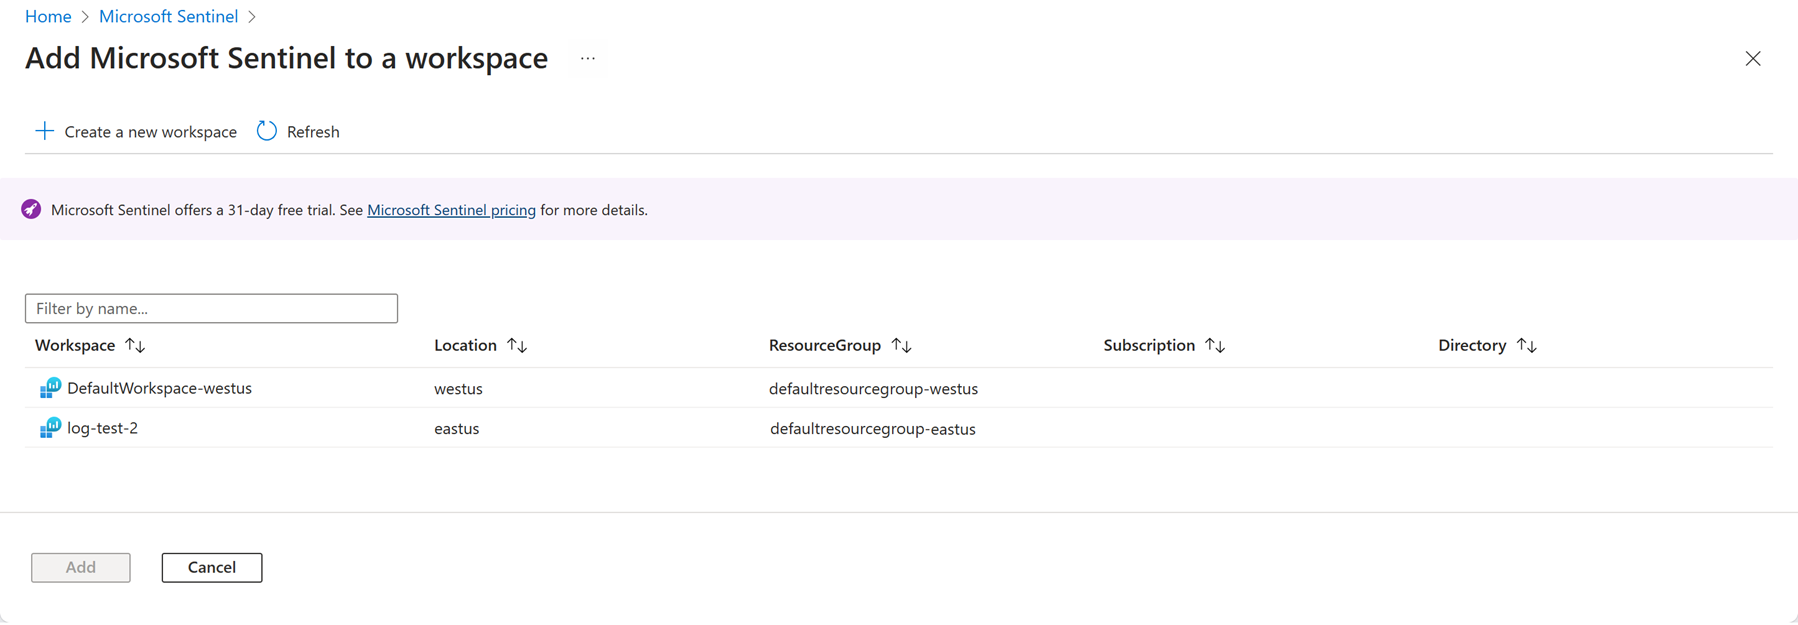
To implement Microsoft Sentinel, you need a Log Analytics workspace. When you create a Microsoft Sentinel resource in the Azure portal, you can create a new Log Analytics workspace or connect an existing workspace.
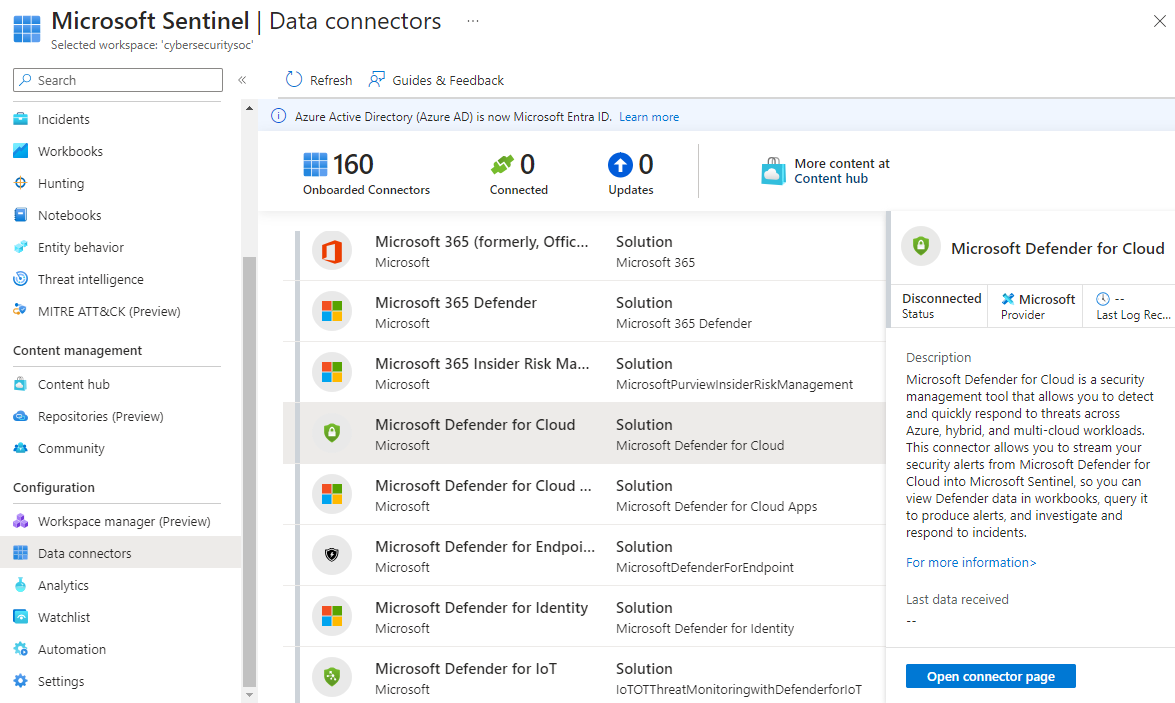
After you create the Microsoft Sentinel resource and connect it to a workspace, you need to connect data sources for your enterprise. Install solutions with data connectors from the content hub. Microsoft Sentinel integrates with Microsoft solutions, including Microsoft Entra ID and Microsoft 365, through connectors.
You can see all of your available data connectors by selecting Data connectors under Configuration in the Microsoft Sentinel left navigation.
Select the appropriate data connector for your data source, read the information about the connector, and select Open connector page to look at the prerequisites for your connector. Make sure you address all the prerequisites to successfully connect your data source.
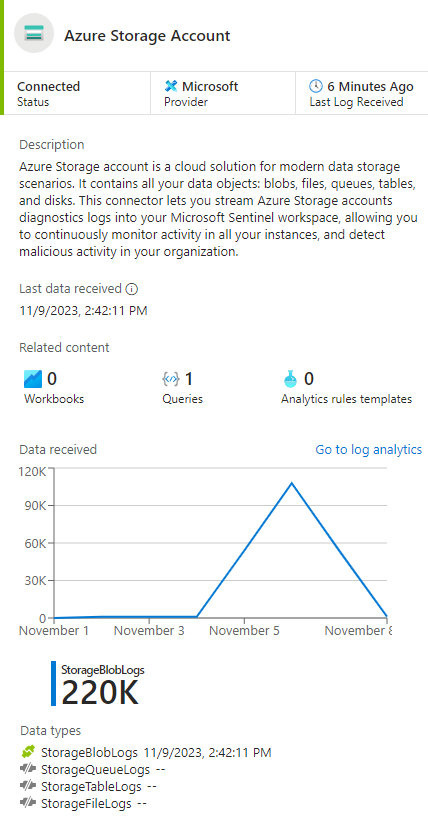
When you connect the data source, your logs are synced to Microsoft Sentinel. You see a summary of collected data in the Data received graph for your connector. You can also see the different data types that are collected for the source. For example, the Azure Storage Account connector can collect Blob, Queue, File, or Table log data.
Once you connect your data sources, Microsoft Sentinel begins to monitor your enterprise.
Use alerts to monitor your enterprise
You can configure alert rules to investigate anomalies and threats more intelligently. Alert rules specify the threats and activities that should raise alerts. You can respond manually or by using playbooks for automated responses.
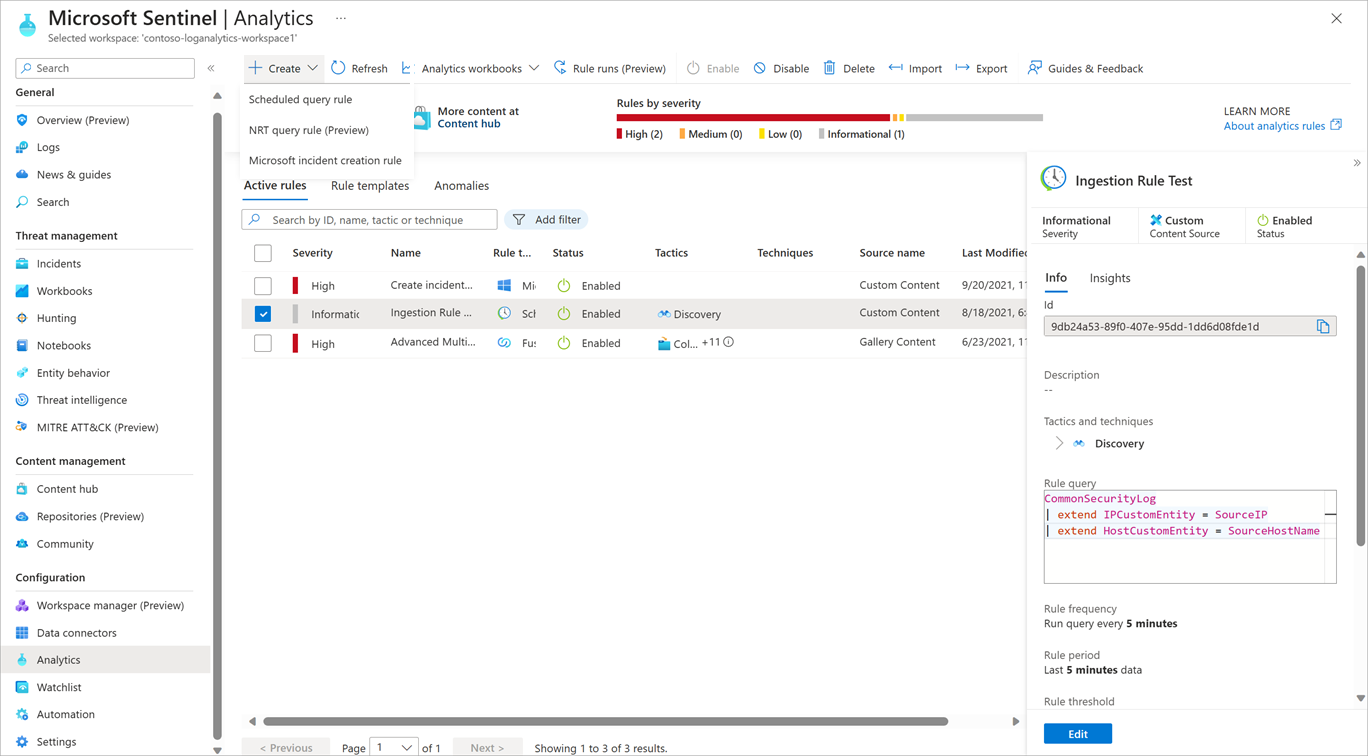
Select Analytics in the Microsoft Sentinel left navigation under Configuration to view all the rules you have in place and create new rules.
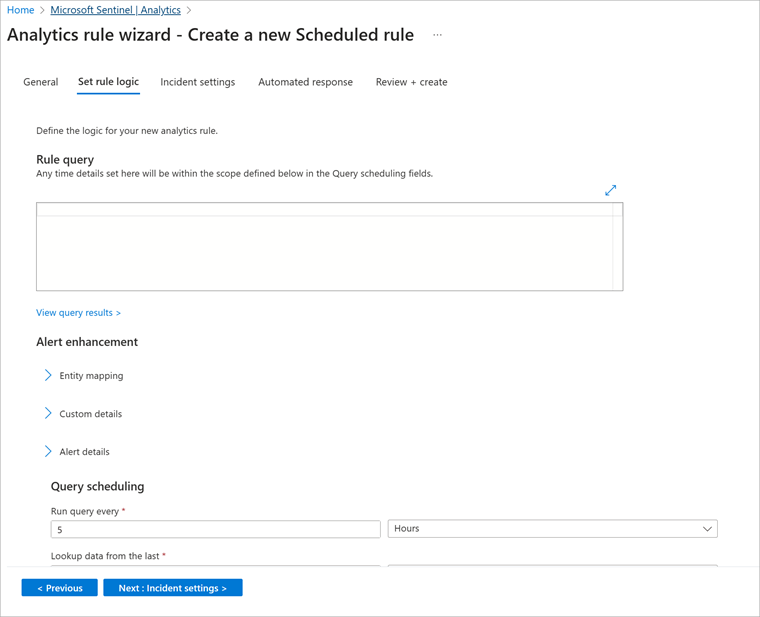
When you create a rule, you specify whether it should be enabled or disabled, and the severity of the alert. In the Rule query field of the Set rule logic tab, enter a rule query.
For example, the following query can determine if a suspicious number of Azure VMs are created or updated, or a suspicious number of resource deployments occur.
AzureActivity
 | where OperationName == "Create or Update Virtual Machine" or OperationName == "Create Deployment"
 | where ActivityStatus == "Succeeded"
 | make-series dcount(ResourceId)  default=0 on EventSubmissionTimestamp in range(ago(7d), now(), 1d) by Caller
In the Query scheduling section, you can set how often the query should run and which period of data to look up. In the Alert threshold section, you can specify the level at which to raise an alert.
Investigate incidents
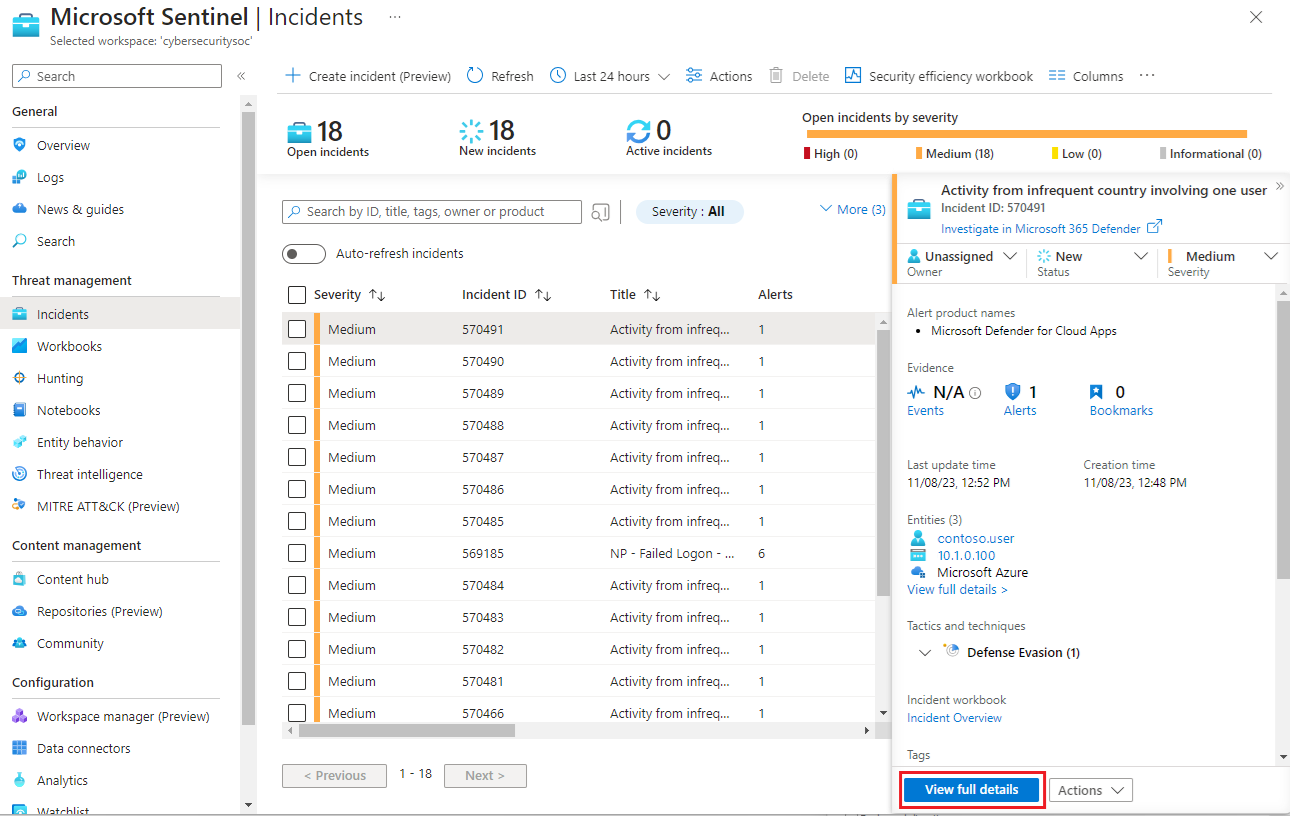
Microsoft Sentinel combines generated alerts into incidents for further investigation. Select Incidents in the Microsoft Sentinel left navigation under Threat management to see details about all your incidents, such as how many incidents are closed, how many remain open, when the incidents happened, and their severity.
To start to investigate an incident, select the incident. You get information about the incident in the right pane. Select View full details to get more information.
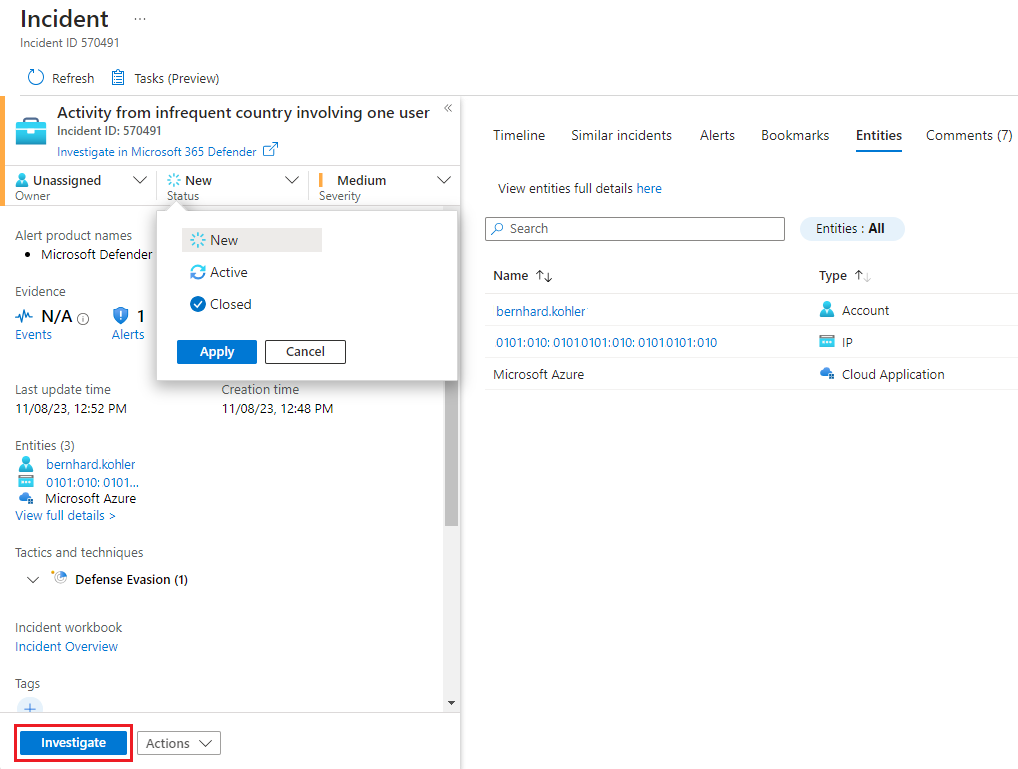
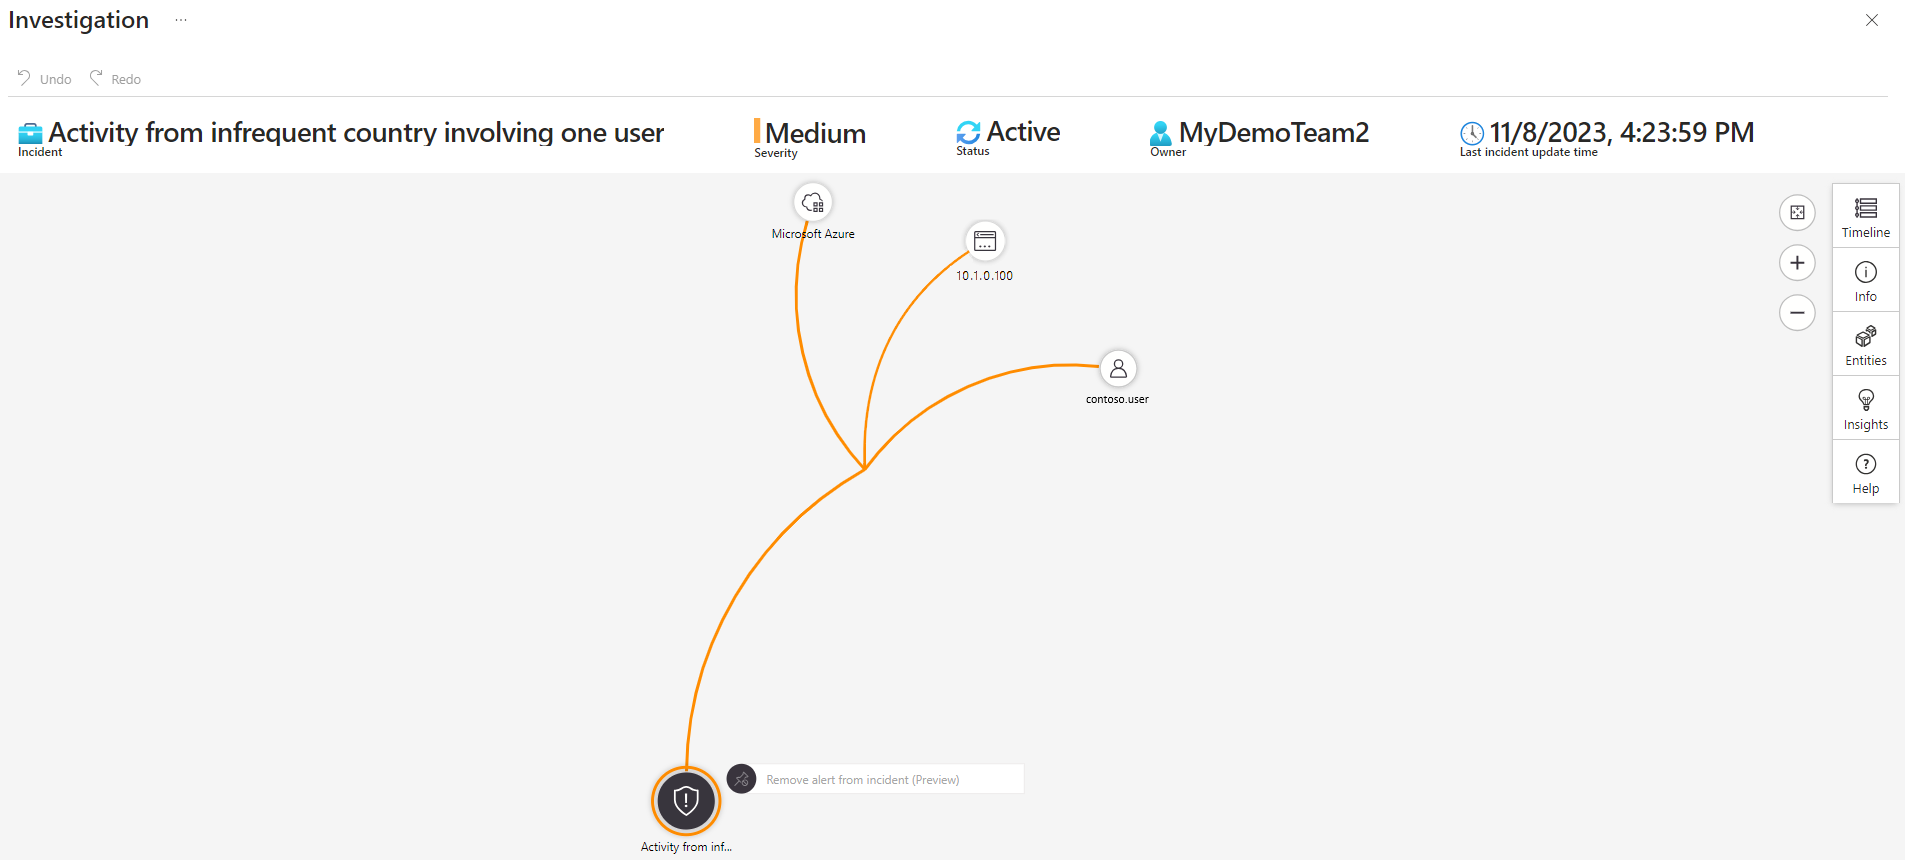
To investigate the incident, update its status from New to Active, assign it to an owner, and select Investigate.
The investigation map helps you understand what caused an incident and the affected scope. You can also use the map to correlate data surrounding an incident.
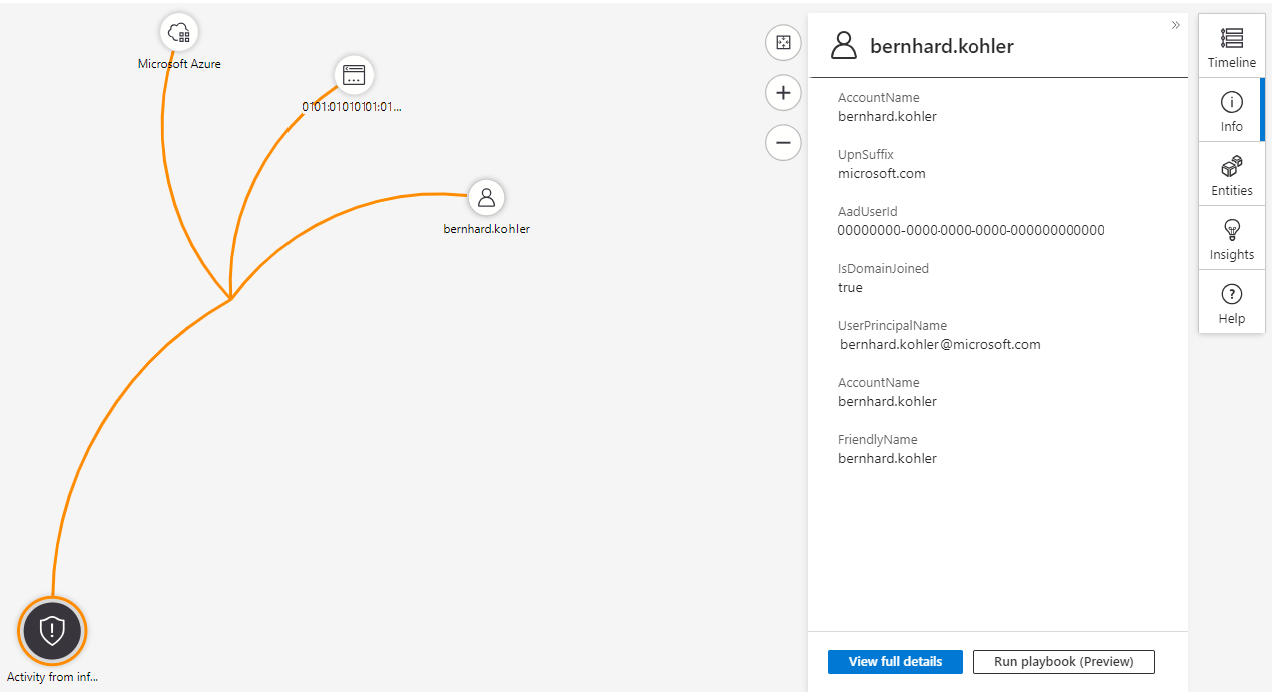
The investigation map lets you drill down into an incident. Multiple entities, including users, devices, and appliances, can be mapped to an incident. For example, you can get details about a user identified as part of the incident.
If you hover over an entity, you see a list of exploration queries designed by Microsoft security analysts and experts. You can use the exploration queries to investigate more effectively.
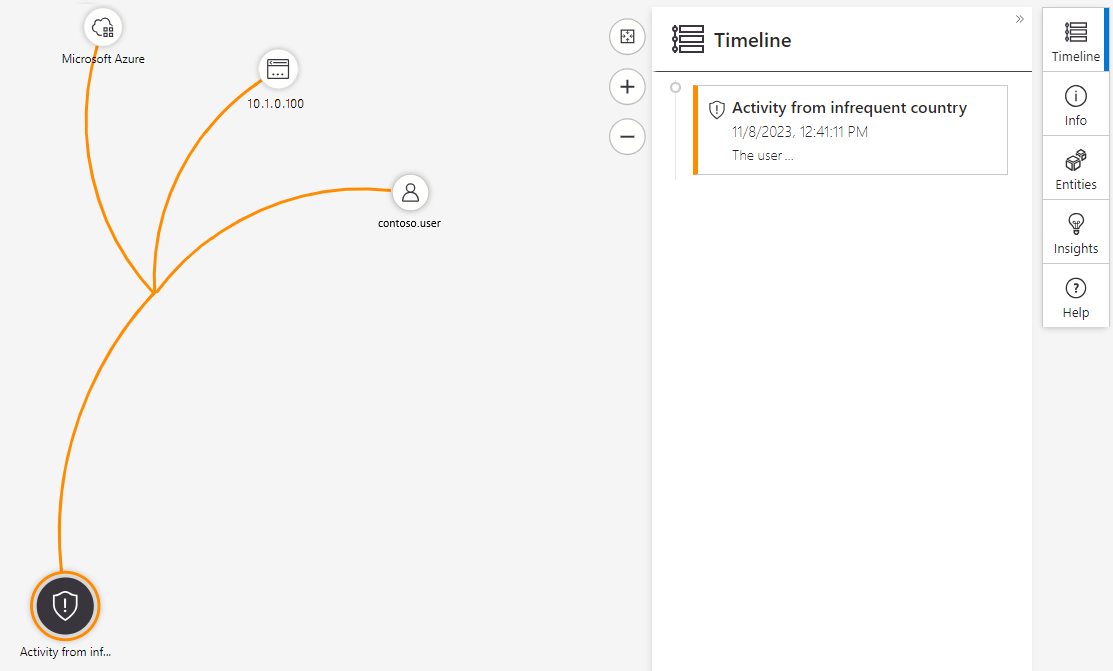
The investigation map also gives you a timeline that helps you understand which event occurred at a particular time. Use the timeline feature to understand the path that a threat might have taken over time.
