Explore the different Power BI elements
To create Power BI Solutions, there are several major building blocks. These elements help not only what data is being presented, but also how it appears to those users who are consuming it. Those elements are datasets, reports, and dashboards. All elements are organized into workspaces, and they're created on capacities.
Let’s look at each of these elements in more detail.
Capacities
Capacities are a core Power BI concept representing a set of resources used to host and deliver your Power BI content. Capacities are either shared or dedicated. A shared capacity is shared with other Microsoft customers, while a dedicated capacity is fully committed to a single customer. Dedicated capacities require a subscription. By default, workspaces are created on a shared capacity.
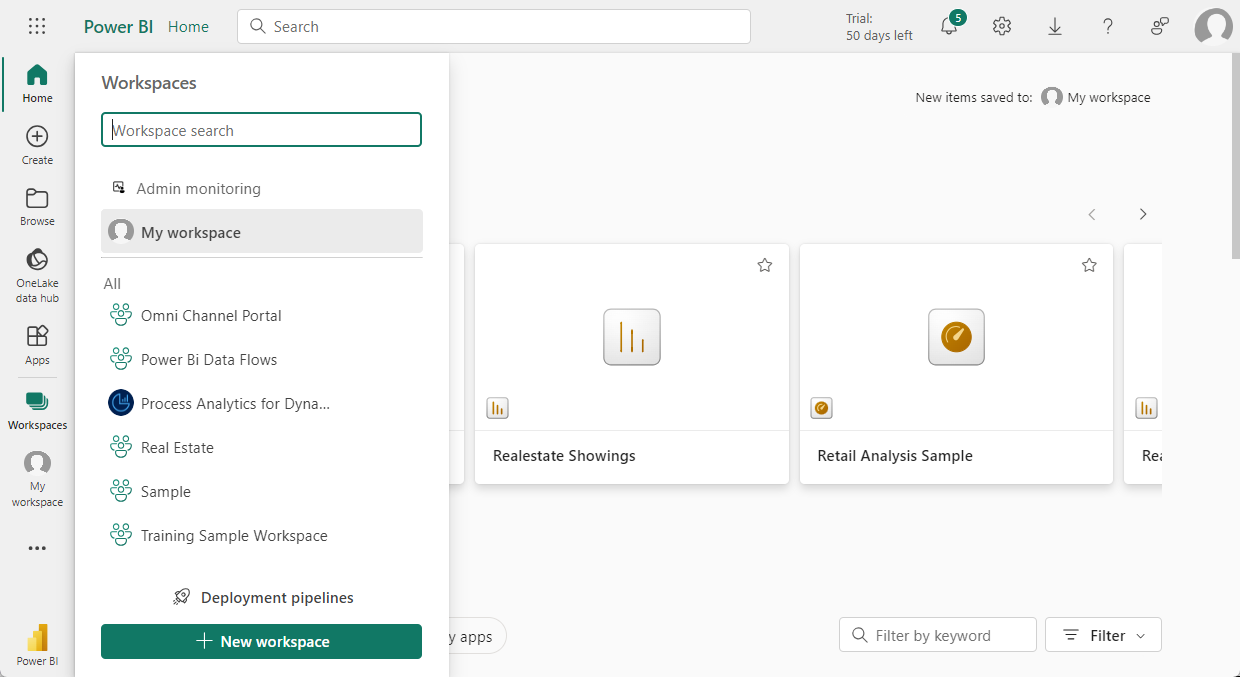
Workspaces
Workspaces are containers for dashboards, reports, datasets, and dataflows in Power BI. There are two types of workspaces: My workspace and workspaces.
My workspace is the personal workspace for any Power BI customer to work with your own content. Only you have access to your My workspace. You can share dashboards and reports from your My Workspace. If you want to collaborate on dashboards and reports or create an app, then you want to work in a workspace.
Workspaces are used to collaborate and share content with colleagues. You can add colleagues to your workspaces and collaborate on dashboards, reports, and datasets. With one exception, all workspace members need Power BI Pro licenses.
Workspaces are also the places where you create, publish, and manage apps for your organization. Think of workspaces as staging areas and containers for the content that makes up a Power BI app. So, what is an app? An app is a collection of dashboards and reports built to deliver key metrics to the Power BI consumers in your organization. Apps are interactive, but consumers can't edit them. App consumers, colleagues who have access to the apps, don't necessarily need Pro licenses.
Semantic models
A semantic model is a collection of data that you import or connect to. Power BI lets you connect to and import all sorts of semantic models and bring all of them together in one place. Semantic models can also source data from dataflows.
Semantic models are associated with workspaces and a single semantic model can be part of multiple workspaces. When you open a workspace, the associated semantic models are listed under the semantic models tab. Each listed semantic model represents a collection of data. For example, a semantic model can contain data from an Excel workbook on OneDrive, an on-premises SSAS tabular semantic model, and/or a Salesforce semantic model. There are different data sources supported. Semantic models added by one workspace member are available to the other workspace members with an admin, member, or contributor role.
Shared semantic models
Business intelligence is a collaborative activity. It's important to establish standardized semantic models that can be the 'one source of truth.' Discovering and reusing those standardized semantic models is key. When expert data modelers in your organization create and share optimized semantic models, report creators can start with those semantic models to build accurate reports. Your organization can have consistent data for making decisions, and a healthy data culture. To consume these shared semantic models, just choose Power BI semantic models when creating your Power BI report.
Reports
A Power BI report is one or more pages of visualizations such as line charts, maps, and other elements. You can create reports in Power BI from scratch, import them from shared dashboards, or have Power BI generate them when connecting to datasets. For example, when you connect to an Excel workbook that contains Power View sheets, Power BI creates a report based on those sheets. And when you connect to a SaaS application, Power BI imports a prebuilt report.
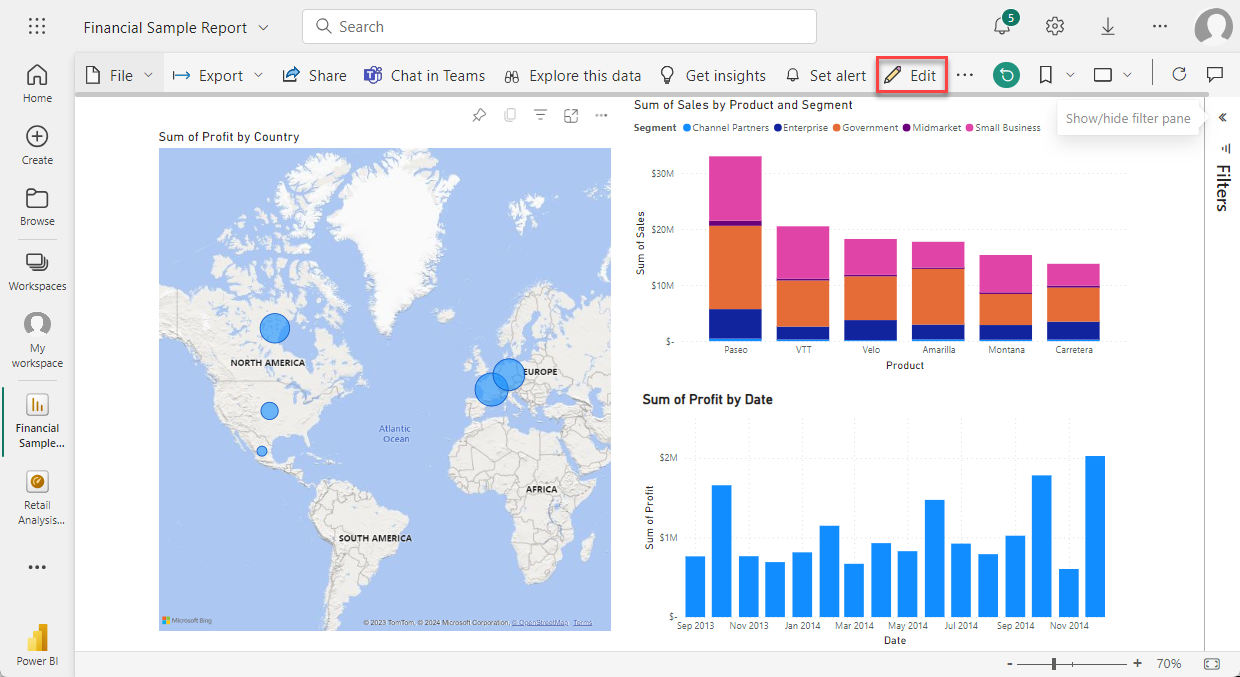
There are two modes to view and interact with reports:
Reading view: When a report is opened by a user, it's displayed in reading view.
Editing view: For individuals that have edit permissions, editing view is used to modify the different elements on the report and how they're presented.
When a workspace is opened, associated reports are listed under the Reports tab. Each listed report represents one or more pages of visualizations based on only one of the underlying datasets. To open a report, select it.
When you open an app, you're presented with a dashboard. To access an underlying report, select a dashboard tile (more on tiles later) that was pinned from a report. Keep in mind that not all tiles are pinned from reports, so you may have to click a few tiles to find a report.
By default, the report opens in Reading view. Just select Edit report to open it in Editing view (if you have the necessary permissions).
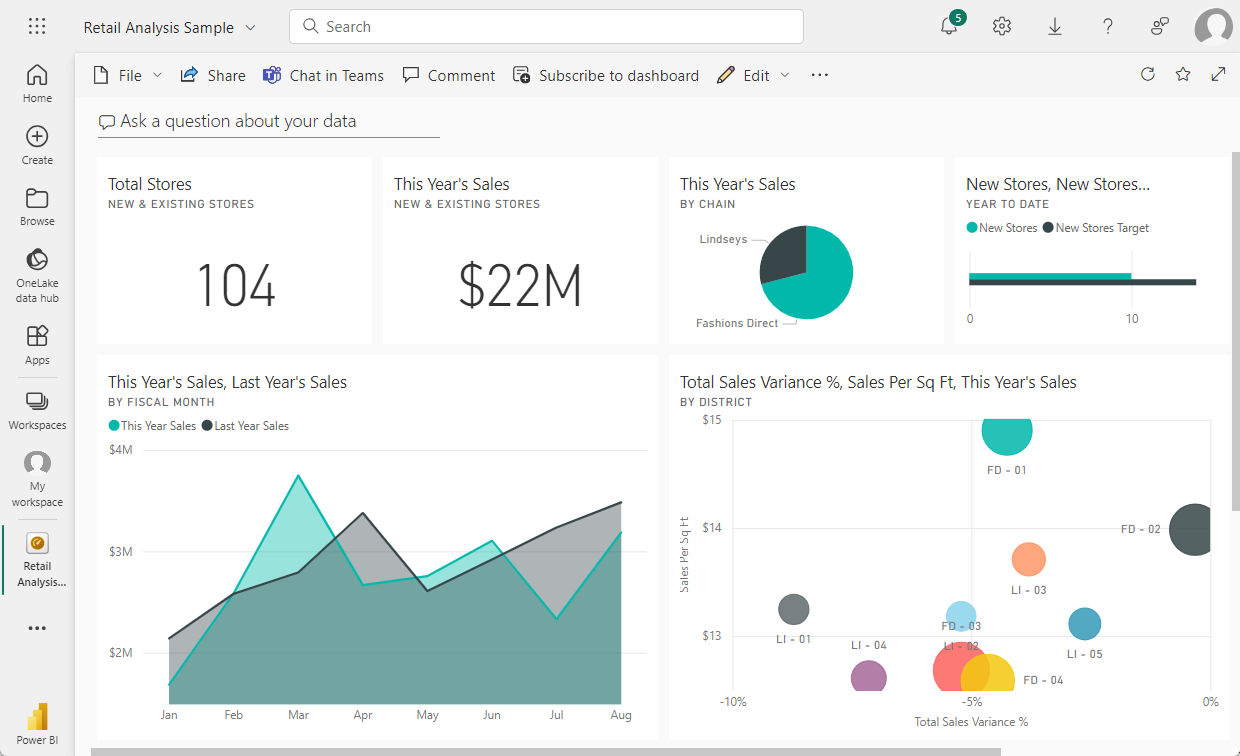
Dashboards
A dashboard is a single canvas that contains zero or more tiles and widgets. Each tile pinned from a report or from Q&A displays a single visualization that was created from a dataset and pinned to the dashboard. Entire report pages can also be pinned to a dashboard as a single tile. There are many ways to add tiles to your dashboard, too many to be covered in this overview topic.
Why do people create dashboards? Here are just some of the reasons:
To see all information needed to make decisions in one glance.
To monitor the most important information about your business.
To ensure all colleagues are on the same page, viewing and using the same information.
To monitor the health of a business, product, business unit, or marketing campaign, etc.
To create a personalized view of a larger dashboard and show all the metrics that matter to them.
When you open a workspace, the associated dashboards are listed under the Dashboards tab. To open a dashboard, select it. When you open an app, you are presented with a dashboard. If you own the dashboard, you also have edit access to the underlying dataset(s) and reports. If the dashboard was shared with you, you are able to interact with the dashboard and any underlying reports but won't be able to save any changes.
Template Apps
Power BI template apps enable Power BI partners to build Power BI apps with little or no coding and deploy them to any Power BI customer. As a Power BI partner, you create a set of out-of-the-box content for your customers and publish it yourself.
You can build template apps that allow your customers to connect within their own accounts. As domain experts, they can unlock the data in a way that is easy for their business users to consume.