Describe cleaning and transforming data in Power BI Desktop
When working with data from different data sources, it's not always going to be in a format that allows it to be displayed with other data. For example, you might be getting ready to build a device usage report that display IoT related device details for individual customers. Typically, that data exists in multiple systems. The customer details likely are in your organization's Customer Relationship Management (CRM) system, while the IoT data is likely stored in a dedicated IoT system such as Azure IoT Hub. Many times, the IoT data isn't structured as nicely as the data in your CRM system. Some of the data may not be in the right format, or there might just be more data than you need. In these instances, you need to clean and transform your data. Cleaning and transforming data is how you prepare your data and get it ready to be used. To begin transforming and cleaning data, you use the Power BI Desktop application.
Power BI Desktop has three views:
Report view: You can create queries to build compelling visualizations that you can share with others. You can arrange them as you want them to appear.
Data view: See the data in your report in data model format, where you can add measures, create new columns, and manage relationships.
Model view: Get a graphical representation of the relationships that are established in your data model and manage or modify them as needed.
Power BI Desktop includes the Power Query Editor tool, which can help you shape and transform data so that it's ready for your models and visualizations.
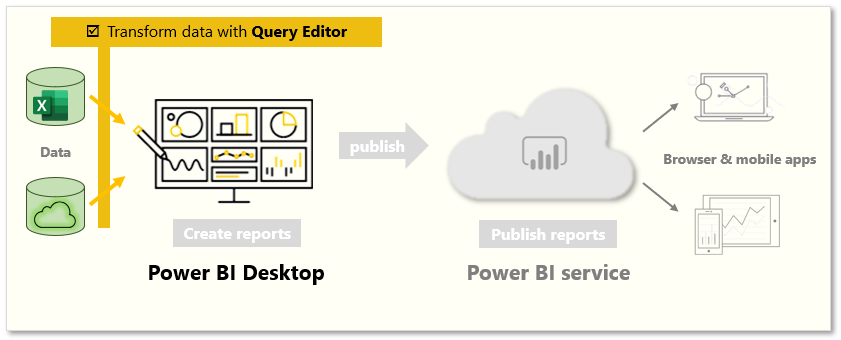
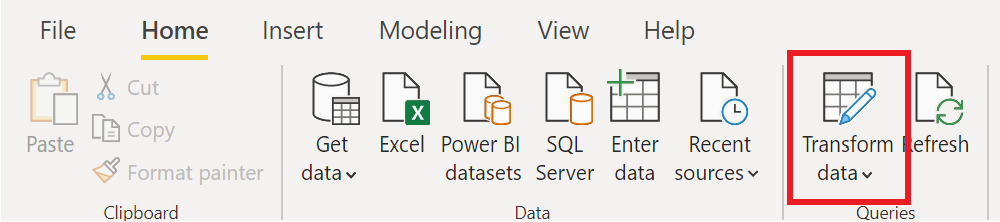
To begin, select Edit from the Navigator window to launch Power Query Editor. You can also launch Power Query Editor directly from Power BI Desktop by using the Transform Data button on the Home ribbon.
Transforming data
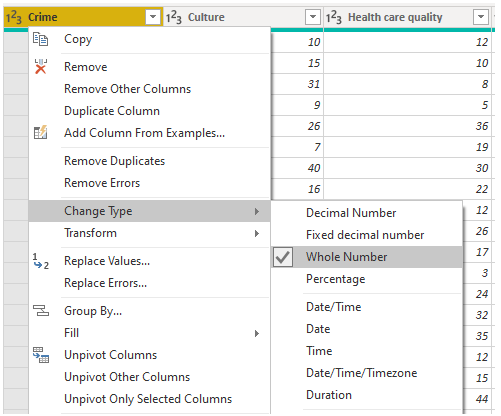
As mentioned previously, transforming data is the process of putting data into a format that is useable in your reports. Examples of the available transformations include removing a column from the table, duplicating the column under a new name, or replacing values.
Clean data
While Power BI can import your data from almost any source, its visualization and modeling tools work best with columnar data. Sometimes, your data isn't formatted in simple columns, which is often the case with Excel spreadsheets.
A table layout that looks good to the human eye might not be optimal for automated queries. For example, the following spreadsheet has headers that span multiple columns.
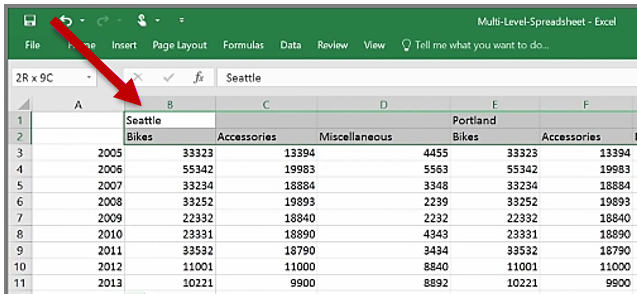
When you clean data, you might combine those rows into a single item to better format the data to fit your needs. Or you may have a series of numeric data that would need to be aggregated to display better. With Power Query, there are a series of tools that you can use to prepare the data.
The purpose of this module was to introduce you to the basic concepts around cleaning and transforming data. You can learn more about transforming, shaping, and modeling data in Power BI here: Transform, shape, and model data in Power BI