Log Analytics workspace for Azure Monitor
To begin using Azure Monitor for Azure Virtual Desktop, you'll need at least one Log Analytics workspace.
Use a designated Log Analytics workspace for your Azure Virtual Desktop session hosts to ensure that performance counters and events are only collected from session hosts in your Azure Virtual Desktop deployment.
Resource diagnostic settings
To collect information on your Azure Virtual Desktop infrastructure, you'll need to enable several diagnostic settings on your Azure Virtual Desktop host pools and workspaces (this is your Azure Virtual Desktop workspace, not your Log Analytics workspace).
To set your resource diagnostic settings:
- Select the Diagnostic settings host pool.
- Under Monitoring, select Diagnostic settings.
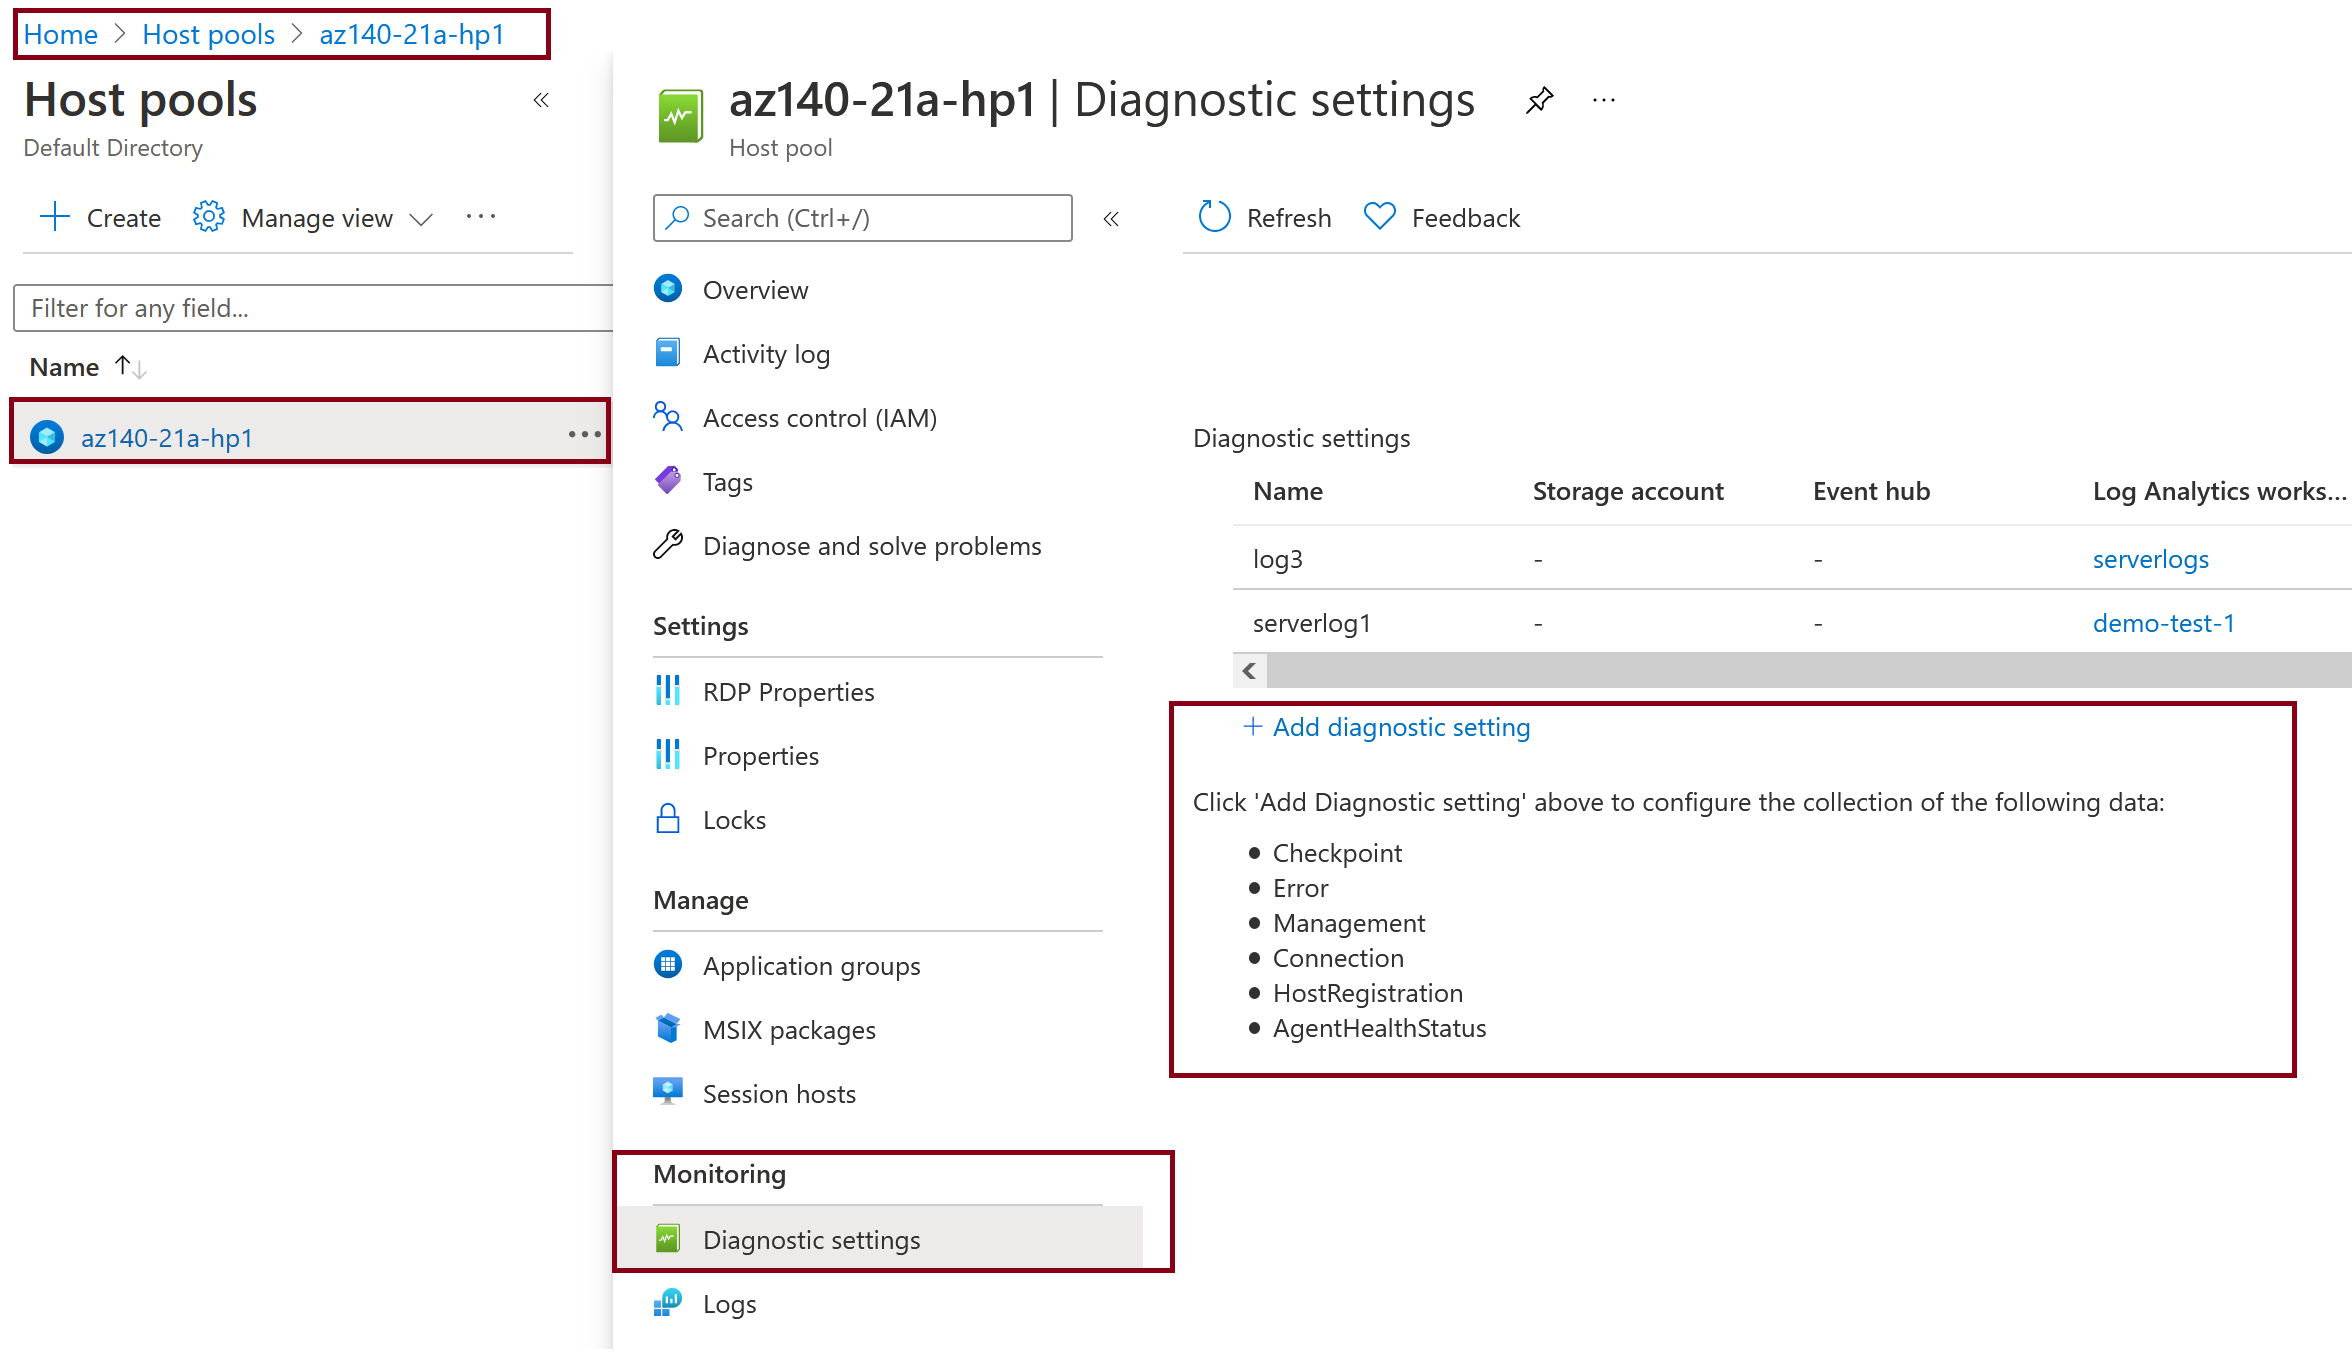
Host pool diagnostic settings
To set up host pool diagnostics using the resource diagnostic settings section in the configuration workbook:
Under Host pool, check to see whether Azure Virtual Desktop diagnostics are enabled. If they aren't, an error message will appear that says "No existing diagnostic configuration was found for the selected host pool." You'll need to enable the following supported diagnostic tables:
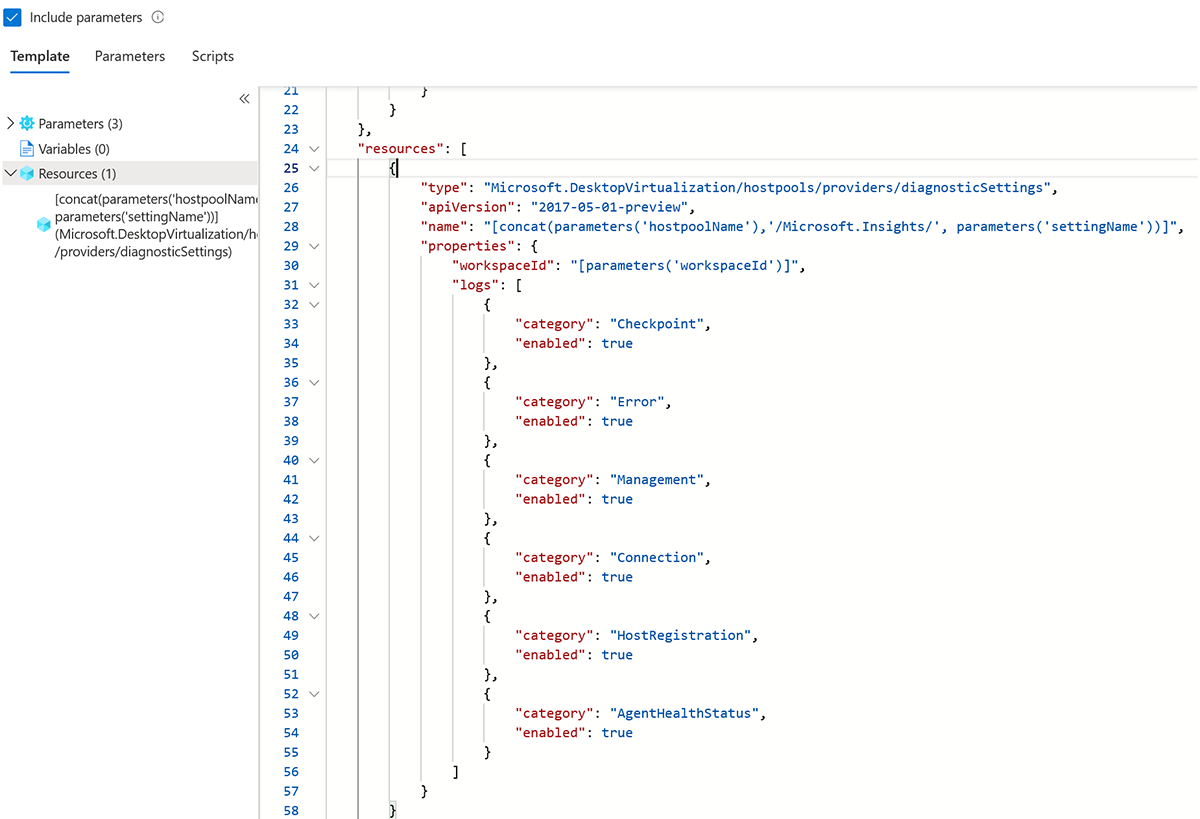
- Checkpoint
- Error
- Management
- Connection
- HostRegistration
- AgentHealthStatus
Select Configure host pool.
Select Deploy.
Refresh the configuration workbook.
Workspace diagnostic settings
To set up workspace diagnostics using the resource diagnostic settings section in the configuration workbook.
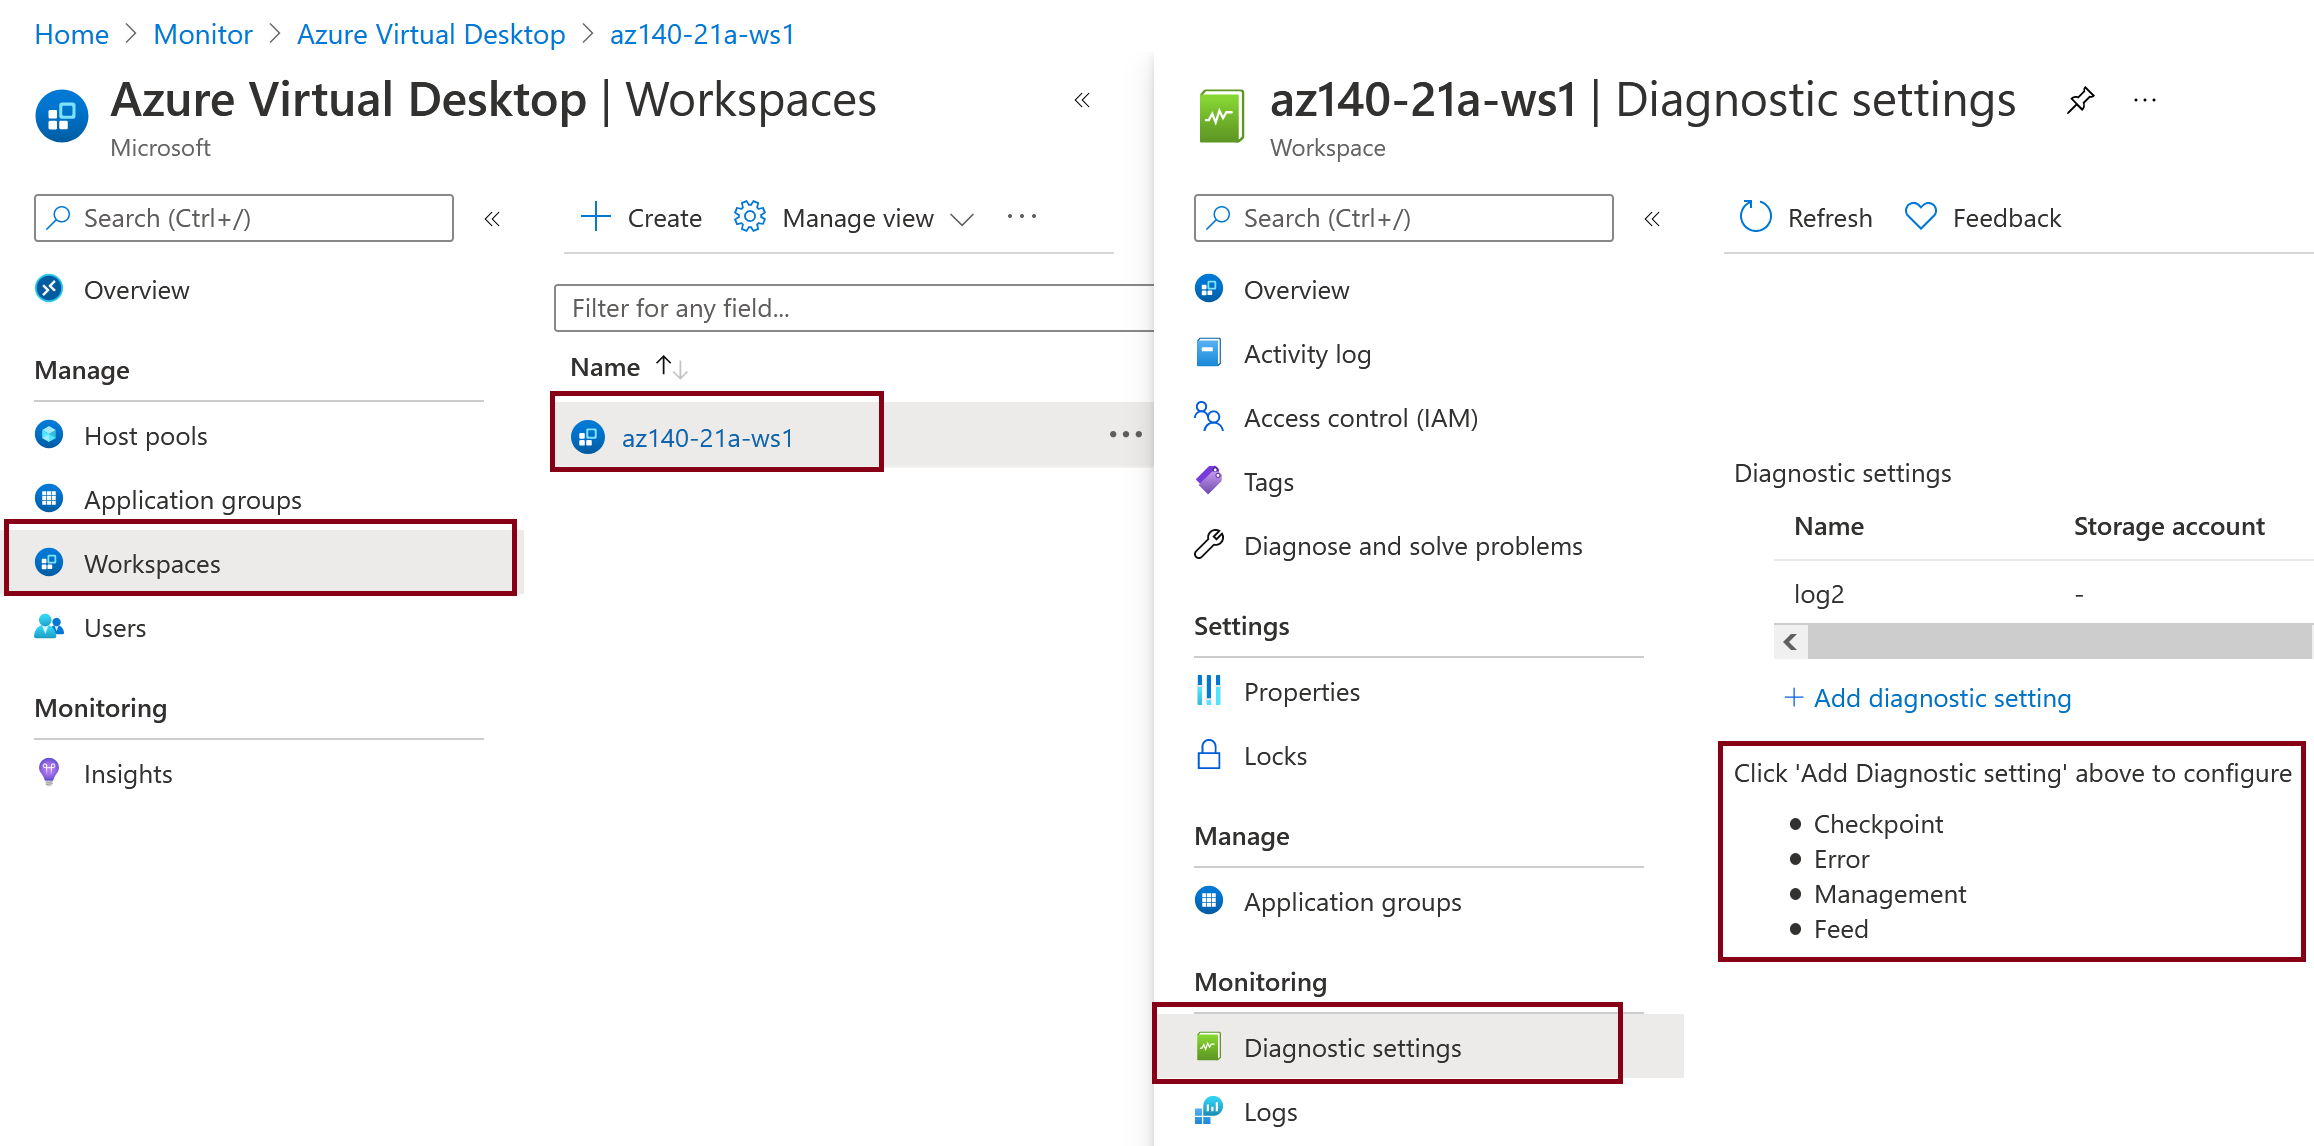
- Under Workspace, check to see whether Azure Virtual Desktop diagnostics are enabled for the Azure Virtual Desktop workspace. If they aren't, an error message will appear that says "No existing diagnostic configuration was found for the selected workspace." You'll need to enable the following supported diagnostics tables:
- Checkpoint
- Error
- Management
- Feed
- Select Configure workspace.
- Select Deploy.
- Refresh the configuration workbook.
Session host data settings
To collect information on your Azure Virtual Desktop session hosts, you'll need to install the Log Analytics agent on all session hosts in the host pool, make sure the session hosts are sending to a Log Analytics workspace, and configure your Log Analytics agent settings to collect performance data and Windows Event Logs.
The Log Analytics workspace you send session host data to doesn't have to be the same one you send diagnostic data to. If you have Azure session hosts outside of your Azure Virtual Desktop environment, we recommend having a designated Log Analytics workspace for the Azure Virtual Desktop session hosts.
To set the Log Analytics workspace where you want to collect session host data:
- Select the Session host data settings tab in the configuration workbook.
- Select the Log Analytics workspace you want to send session host data to.
Session hosts
You'll need to install the Log Analytics agent on all session hosts in the host pool and send data from those hosts to your selected Log Analytics workspace. If Log Analytics isn't configured for all the session hosts in the host pool, you'll see a Session hosts section at the top of Session host data settings with the message "Some hosts in the host pool are not sending data to the selected Log Analytics workspace."
To set up your remaining session hosts using the configuration workbook:
- Select Add hosts to workspace.
- Refresh the configuration workbook.
Workspace performance counters
You'll need to enable specific performance counters to collect performance information from your session hosts and send it to the Log Analytics workspace.
To set up performance counters using the configuration workbook:
- Under Workspace performance counters in the configuration workbook, check Configured counters to see the counters you've already enabled to send to the Log Analytics workspace. Check Missing counters to make sure you've enabled all required counters.
- If you have missing counters, select Configure performance counters.
- Select Apply Config.
- Refresh the configuration workbook.
- Make sure all the required counters are enabled by checking the Missing counters list.
Configure Windows Event Logs
You'll also need to enable specific Windows Event Logs to collect errors, warnings, and information from the session hosts and send them to the Log Analytics workspace.
To set up Windows Event Logs using the configuration workbook:
- Under Windows Event Logs configuration, check Configured Event Logs to see the Event Logs you've already enabled to send to the Log Analytics workspace. Check Missing Event Logs to make sure you've enabled all Windows Event Logs.
- If you have missing Windows Event Logs, select Configure Events.
- Select Deploy.
- Refresh the configuration workbook.
- Make sure all the required Windows Event Logs are enabled by checking the Missing Event Logs list.