Analyze costs in the Microsoft Cost Management Power BI app to optimize costs
Microsoft Cost Management provides a solution that you can use to start analyzing costs immediately in Power BI with a set of reports. This unit explains how to install the app and which reports are used to get an understanding of your organization's costs. Reports provide a way to quickly see costs for your subscriptions and resource groups, to determine your top cost drivers, and find anomalous spending patterns over time.
Install and configure
To install the app:
Open the Microsoft Cost Management Power BI App page and get the app. Agree to the terms of use and privacy policy and then continue. Install the app and select Go to app. In Getting started with your new app, select Connect your data, and select Connect.
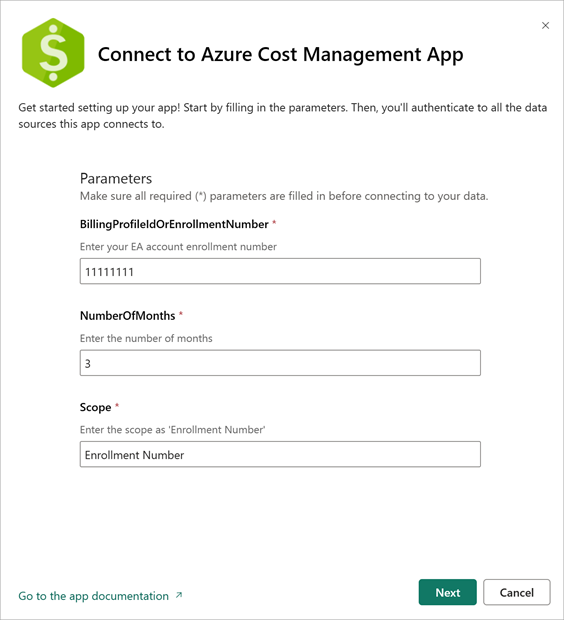
In the dialog that appears, enter your EA enrollment number for BillingProfileIdOrEnrollmentNumber. Specify the number of months of data to get. Leave the default Scope value of Enrollment Number, then select Next.
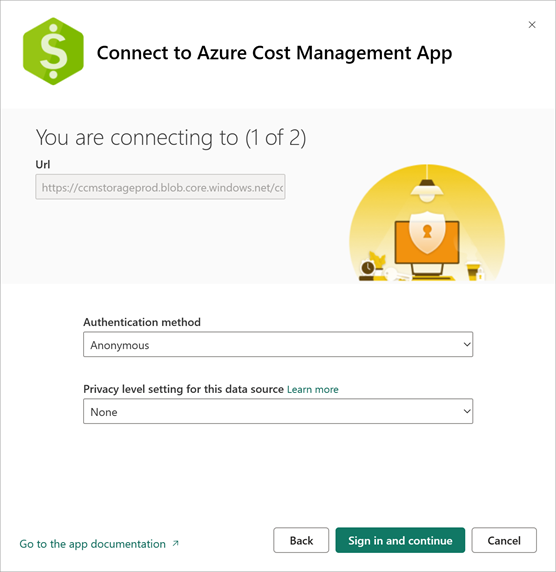
The next dialog connects to Azure and gets data required for reserved instance recommendations. Leave the default values as configured and select Sign in and continue.
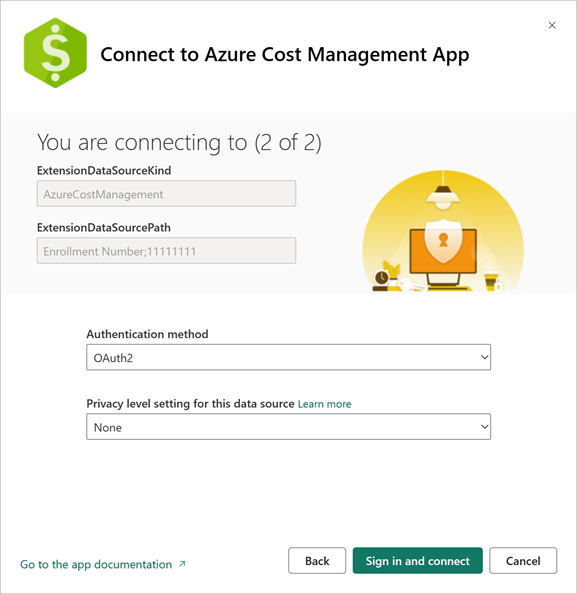
The final installation step connects to your EA enrollment and requires an Enterprise Administrator account. Select Sign in and connect to authenticate with your EA enrollment. This step also starts a data-refresh action in Power BI.
Note
The data-refresh process might take quite a while to complete. The length depends on the number of months specified and the amount of data needed to sync.
Check data freshness
To check the data-refresh status, select the Datasets + dataflows tab in the workspace. Look next to the Refreshed timestamp. If it's still updating, you'll see a circular indicator showing that the refresh is in progress.

After the data refresh is complete, select the Microsoft Cost Management App to view the pre-created reports.
Analyze your costs using the app
Now that you have the application up and running in Power BI, you're ready to begin analyzing your costs. There are several reports, each of which you can use to answer different questions on your costs.
Billing account overview: If you want a high-level view of the costs across your organization, use the Billing account overview report. It helps you quickly identify spending trends across your organization. The report shows a monthly summary of information, including:
- Charges against credits
- New purchases
- Azure Marketplace charges
- Overages and total charges

Usage by Subscriptions and Resource Groups: This report provides a cost over time view and charts showing cost by subscription and resource group. You can use this to get a more fine-grained view of the costs in your organization.

Top 5 Usage drivers: The report shows a filtered cost summarization by the top 5 MeterCategory and corresponding MeterName. For example, maybe your networking costs for your eCommerce app increased significantly last month. That might be a cost anomaly to examine to identify which resources specifically led to the increase in networking charges.

Usage by Services: The report provides a view over time of usage by MeterCategory. Each resource you spin up in Azure has different meter's associated with it. This view helps you understand how the underlying charges for meters across resources are changing. You can track your usage data and drill into any anomalies to understand usage spikes or dips.
