Plan load tests by using Apache JMeter
In this section, you'll explore load testing and learn how to add load tests to the pipeline. The load tests use Apache JMeter to simulate multiple users who access the web app simultaneously. The tests fetch the web content from the app that runs on Azure App Service in the Staging environment.
Tim starts by bringing up the Apache JMeter user interface on a laptop. He runs a basic test plan. Then Tim and Mara export the test plan to a file that can be run from the command line. Finally, they add tasks to Azure Pipelines to run the load tests during Staging.
Note
For brevity, you don't need to install Apache JMeter on your local computer. You can just read along.
Run load tests from Apache JMeter
Apache JMeter is an open-source load-testing tool that analyzes and measures performance. The report it generates is an XML file.
Azure Pipelines can read the Apache JMeter report and generate a graph. You don't need any special hardware to run these tests, so you can use a Microsoft-hosted agent to run them. In the Space Game scenario, you'd likely run these tests in Staging.
Create the test plan
Here's what Apache JMeter looks like on a laptop running Linux:
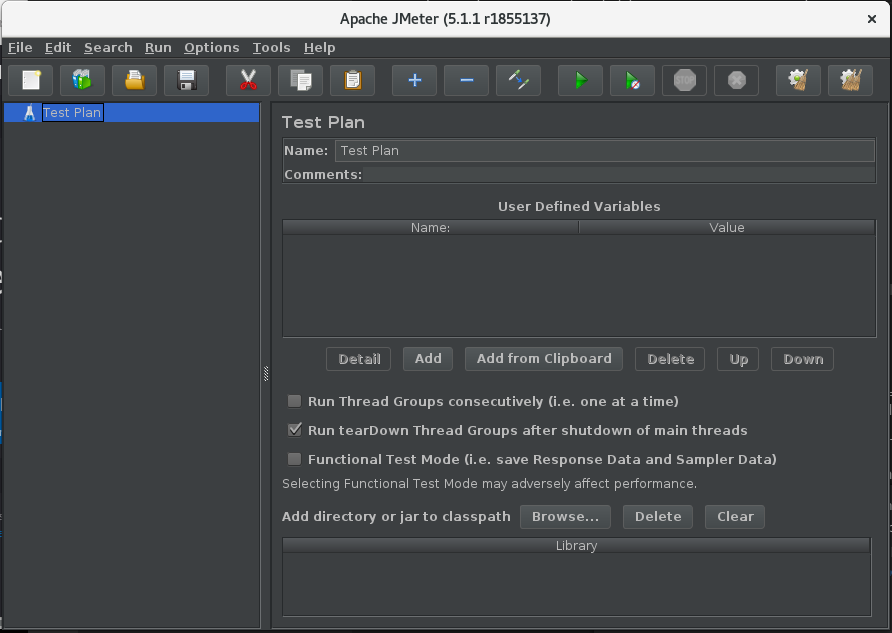
You'd create a new test plan file; for example, LoadTest.jmx. You'd then add a Thread Group to the file. Each simulated user runs on its own thread. A thread group controls the number of users and the number of each user's requests.
The following example shows 10 simulated users (threads). Each user makes 10 request, so the system gets a total of 100 requests.
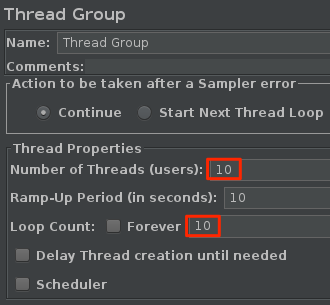
A sampler is a single request made by JMeter. JMeter can query servers over HTTP, FTP, TCP, and several other protocols. Samplers generate the results that are added to the report.
Next, you'd add Http Request Defaults and an Http Request sampler to the thread group. You'd provide the hostname of the Space Game website that runs in the staging environment on Azure App Service.
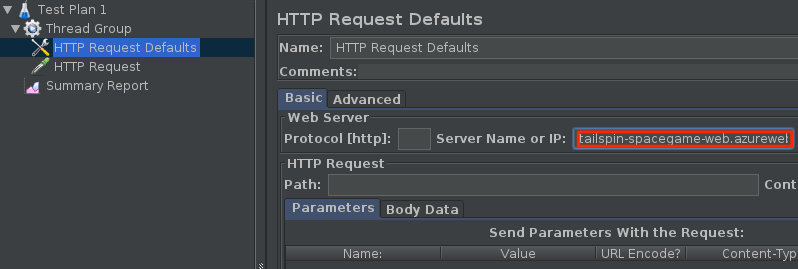
The preceding scenario creates a basic test plan.
Run the test plan
JMeter enables you to run many kinds of tests. It's possible to run your test plan from the JMeter graphical user interface. For load tests, however, the JMeter documentation recommends that you run the test plan from the command line.
You'd run the test plan by using this command:
apache-jmeter-5.4.1/bin/./jmeter -n -t LoadTest.jmx -o Results.xml
The -n argument specifies to run JMeter in non-GUI mode. The -t argument specifies the test plan file, LoadTest.jmx. The -o argument specifies the report file, Results.xml.
JMeter runs and produces the report file, Results.xml. This example of the file shows the first few results:
<?xml version="1.0" encoding="UTF-8"?>
<testResults version="1.2">
<httpSample t="180" it="0" lt="95" ct="35" ts="1569306009772" s="true" lb="HTTP Request" rc="200" rm="OK" tn="Thread Group 1-1" dt="text" by="40871" sby="144" ng="1" na="1">
  <java.net.URL>http://tailspin-space-game-web-staging-1234.azurewebsites.net/</java.net.URL>
</httpSample>
<httpSample t="174" it="0" lt="96" ct="38" ts="1569306009955" s="true" lb="HTTP Request" rc="200" rm="OK" tn="Thread Group 1-1" dt="text" by="40869" sby="144" ng="1" na="1">
  <java.net.URL>http://tailspin-space-game-web-staging-1234.azurewebsites.net/</java.net.URL>
</httpSample>
<httpSample t="160" it="0" lt="121" ct="35" ts="1569306010131" s="true" lb="HTTP Request" rc="200" rm="OK" tn="Thread Group 1-1" dt="text" by="40879" sby="144" ng="2" na="2">
  <java.net.URL>http://tailspin-space-game-web-staging-1234.azurewebsites.net/</java.net.URL>
</httpSample>
Each sample produces a node in the report. The t attribute specifies the response time in milliseconds (ms). Here, you see three requests that took 180 ms, 174 ms, and 160 ms.
The ideal request times should average less than one second. No more than 10 percent of requests should take more than one second. You can configure JMeter to report statistics such as the minimum, maximum, and average response times or the standard deviation. You could write a script to help provide this information.
To visualize the test results, you need to provide them in a format that Azure Pipelines understands. Azure Pipelines can parse an XML file that contains test results, but the file needs to be in a supported format. Supported formats include CTest, JUnit (including PHPUnit), NUnit 2, NUnit 3, Visual Studio Test (TRX), and xUnit 2. You could write an XSLT file that converts the JMeter results to JUnit.
Transform the report to JUnit
XSLT stands for XSL Transformations, or eXtensible Stylesheet Language Transformations. An XSLT file resembles an XML file, but it enables you to transform an XML document to another XML format.
Recall our requirements for load tests:
- The average request time should be less than one second.
- No more than 10 percent of requests should take more than one second.
Here's what an XSLT file that meets those requirements looks like:
<xsl:stylesheet version="1.0" xmlns:xsl="http://www.w3.org/1999/XSL/Transform" xmlns:math="http://exslt.org/math">
  <xsl:output method="xml" indent="yes" encoding="UTF-8"/>
  <xsl:template match="/testResults">
    <xsl:variable name="times" select="./httpSample/@t" />
    <xsl:variable name="failures" select="./httpSample/assertionResult/failureMessage" />
    <xsl:variable name="threshold" select="1000" />
    <testsuite>
      <xsl:attribute name="tests"><xsl:value-of select="count($times)" /></xsl:attribute>
      <xsl:attribute name="failures"><xsl:value-of select="count($failures)" /></xsl:attribute>
      <testcase>
          <xsl:variable name="avg-time" select="sum($times) div count($times)" />
          <xsl:attribute name="name">Average Response Time</xsl:attribute>
          <xsl:attribute name="time"><xsl:value-of select="format-number($avg-time div 1000,'#.##')"/></xsl:attribute>
          <xsl:if test="$avg-time > $threshold">
            <failure>Average response time of <xsl:value-of select="format-number($avg-time,'#.##')"/> exceeds <xsl:value-of select="$threshold"/> ms threshold.</failure>
          </xsl:if>
      </testcase>
      <testcase>
          <xsl:variable name="exceeds-threshold" select="count($times[. > $threshold])" />
          <xsl:attribute name="name">Max Response Time</xsl:attribute>
          <xsl:attribute name="time"><xsl:value-of select="math:max($times) div 1000"/></xsl:attribute>
          <xsl:if test="$exceeds-threshold > count($times) * 0.1">
            <failure><xsl:value-of select="format-number($exceeds-threshold div count($times) * 100,'#.##')"/>% of requests exceed <xsl:value-of select="$threshold"/> ms threshold.</failure>
          </xsl:if>
      </testcase>
    </testsuite>
  </xsl:template>
</xsl:stylesheet>
We won't delve into how XSL works here. But to summarize, this file first collects the following data from the JMeter output:
Each HTTP request time.
It collects this data by selecting the
tattribute from eachhttpSampleelement. (./httpSample/@t)Each failure message.
It collects this data by selecting all
failureMessagenodes from the document. (./httpSample/assertionResult/failureMessage)
The XSLT file also sets the threshold value to 1,000 ms. This response time is the maximum that we defined earlier.
Given these variables, the XSLT file provides the total number of tests and the total number of failures. It then provides these two test cases:
- The average response time, and a failure if the average exceeds the threshold of 1,000 ms.
- The maximum response time, and a failure if more than 10 percent of requests exceed the threshold of 1,000 ms.
The results of the XSLT match the JUnit format, which Azure Pipelines understands. You could name your XSLT file JMeter2JUnit.xsl.
Next, you'd need an XSLT processor. In this example, we'll use xsltproc, which is a command-line tool for applying XSLT stylesheets to XML documents.
You could install xsltproc as follows:
sudo apt-get install xsltproc
Next, you'd run xsltproc to transform the JMeter report to JUnit:
xsltproc JMeter2JUnit.xsl Results.xml > JUnit.xml
Here's the resulting JUnit file, JUnit.xml:
<?xml version="1.0" encoding="UTF-8"?>
<testsuite xmlns:math="http://exslt.org/math" tests="100" failures="0">
  <testcase name="Average Response Time" time="0.17"/>
  <testcase name="Max Response Time" time="0.373"/>
</testsuite>
In this example, the average response time is 170 ms. The maximum response time is 373 ms. Neither test case generates a failure, because both times fall below the threshold of 1,000 ms.
Shortly, you'll run these tests in the pipeline. You can think about Results.xml, the file that JMeter writes, as an intermediate file that's not published to the pipeline's test results. JUnit.xml is the final report file. This file gets published to the pipeline so that the team can visualize the results.