Troubleshoot and monitor flows
In this unit, we'll focus on how to troubleshoot common issues that might occur while you run your flows.
Identify the error
The first step is to identify why your flow failed. Click or tap the notifications icon at the top of the web portal (or open the Activity window, selecting the gear icon to open the Settings menu, and then click or tap Activity), and then click or tap your flow in the list that appears.

To get an overview of the errors in your flows, click on the Failures command at the top of the page. This filters the view with the actions with failures. On each flow where issues occurred, you'll see a red exclamation icon.

If you want to identify why your flow failed, you need to select your flow. The details about the flow appear, and one or more actions will be marked with a red exclamation icon. In the details pane, all the information about the error becomes available. Details such as Start time, Duration, Status, Error, and Error Details.

If you need more details, open the step with the red exclamation icon and review the error message. The error message in this step is divided into two parts.
The first part of the error message is about the inputs. You can find your basic configured parameters, such as Environment name, Company name, Table name, or values you entered in a step (the data available as inputs depends on the type of connector). In the opening inputs, you can check if the setup is correct and you can find the details here about your input if the flow failed.

The second part is about the outputs. Here you will find the error Status code as well as the Body with a detailed message about error. At the bottom of the message, you'll see the credentials you used for this flow.

Types of failures
You can locate a few common types of failures in Power Automate and you can recognize them based on the error code.
Authentication failures
In many cases, flows fail because of an authentication error. If you have this type of error, the error message contains Unauthorized or an error code of 401 or 403 appears. You can usually fix an authentication error by updating the connection. Complete the following steps to address this error.
At the top of the web portal, click Data in the menu on the left side and click Connections.
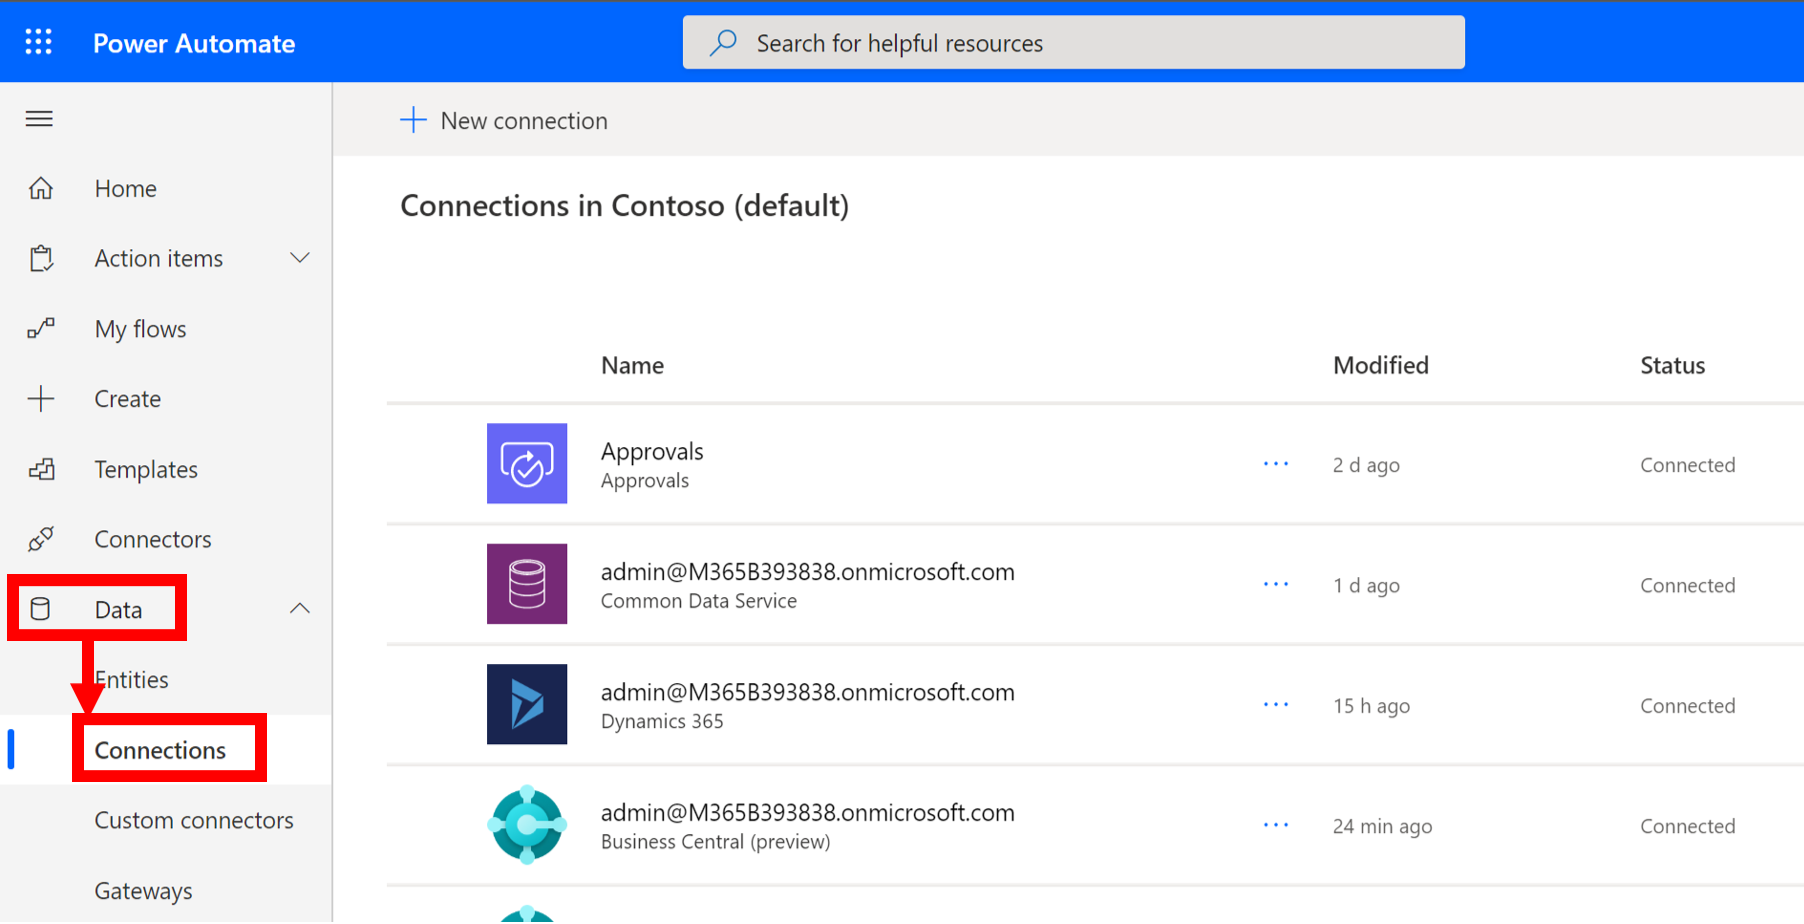
Scroll to the connection for which you saw the Unauthorized error message.
Next to the connection, click or tap the Verify password link in the message about the connection not being authenticated.
Verify your credentials by following the instructions that appear, return to your flow-run failure, and then click or tap Resubmit.

The flow should now run as expected.
Action configuration issues
Flows can fail if a setting in an action of the flow doesn't function as expected. The error message then contains Bad request or Not found, or an error code of 400 or 404 appears.
The error message specifies how to correct the failure. You'll need to click the Edit button and then correct the problem inside the flow definition if this relates to the flow definition. Sometimes it relates to the configuration of your external system. Maybe you used one specific folder in your OneDrive as the destination. if someone deletes this folder and the flow runs, an error message Not found will appear. You should decide in such cases where you want to make correction, in your flow (to change destination) or in the external system (to create folder).
If you make a correction in your flow, save the updated flow, and then click or tap Resubmit to run again with the updated configuration.
Temporary issues and other failures
If the error code 500 or 502 appears, the failure is temporary or transient. Select Resubmit to try the flow again.
In some cases, you might have run out of data that you can use. To see details, select the Settings button (the gear symbol) and select Admin Center. When you open the Admin Center, expand the Tenant and select Quotas to see your current usage against your license.

In some cases, you might be running flows too often as your license determines how often your flows run. For example, your flows might run every 15 minutes if you're using a free version. If a flow is triggered less than 15 minutes after its last run, it's queued until 15 minutes have passed. Whenever a flow is triggered, whether by an automatic trigger or manually, the action counts as a run. Checks for new data don't count as runs.
Even if you have your regular license, you can sign in by mistake
by using a Microsoft account (for example, an account that ends
with @outlook.com or @gmail.com) this is not your organizational
account. In this case, you can use only the free edition. To solve
this issue, just sign out and sign in again using your organizational
account.
Show a summary of activity
Watch the following demonstration on how to show a summary of Power Automate activity.
Show details of a run
If you want to see the activities for a specific flow, look at the flow's details. Select or tap My flows on the menu and select the flow you want to check from the list.
Here you can find all details about your flow. One of the important tabs is the Runs tab that shows all runs of your flow. You can see the following information: Start (date and time), Duration, and Status. To see the details of a new run, click Refresh Flow runs.

If you want to see more details about failed or even a successful flow, select its link at the Start column from this Runs table.
This view is limited in the number of runs it shows. If you want to see all runs you had with this flow, click or tap All runs in the right top corner of Runs tab. This will open a Run history page, which displays the history of all runs.