Measure memory usage in Visual Studio (C#, Visual Basic, C++, F#)
Find memory leaks and inefficient memory while you're debugging with the debugger-integrated Memory Usage diagnostic tool. The Memory Usage tool lets you take one or more snapshots of the managed and native memory heap to help understand the memory usage impact of object types. You can also analyze memory usage without a debugger attached or by targeting a running app. For more information, see Run profiling tools with or without the debugger. For information on choosing the best memory analysis tool for your needs, see Choose a memory analysis tool.
Although you can collect memory snapshots at any time in the Memory Usage tool, you can use the Visual Studio debugger to control how your application executes while investigating performance issues. Setting breakpoints, stepping, Break All, and other debugger actions can help you focus your performance investigations on the code paths that are most relevant. Performing those actions while your app is running can eliminate the noise from the code that doesn't interest you and can significantly reduce the amount of time it takes you to diagnose an issue.
Important
The debugger-integrated Diagnostics Tools are supported for .NET development in Visual Studio, including ASP.NET, ASP.NET Core, native/C++ development, and mixed mode (.NET and native) apps. Windows 8 and later is required to run profiling tools with the debugger (Diagnostic Tools window).
In this tutorial, you will:
- Take snapshots of memory
- Analyze memory usage data
If Memory Usage does not give you the data that you need, other profiling tools in the Performance Profiler provide different kinds of information that might be helpful to you. In many cases, the performance bottleneck of your application may be caused by something other than your memory, such as CPU, rendering UI, or network request time.
Note
Custom Allocator Support The native memory profiler works by collecting allocation ETW event data emitted during run time. Allocators in the CRT and Windows SDK have been annotated at the source level so that their allocation data can be captured. If you are writing your own allocators, then any functions that return a pointer to newly allocated heap memory can be decorated with __declspec(allocator), as seen in this example for myMalloc:
__declspec(allocator) void* myMalloc(size_t size)
Collect memory usage data
Open the project you want to debug in Visual Studio and set a breakpoint in your app at the point where you want to begin examining memory usage.
If you have an area where you suspect a memory issue, set the first breakpoint before the memory issue occurs.
Tip
Because it can be challenging to capture the memory profile of an operation that interests you when your app frequently allocates and de-allocates memory, set breakpoints at the start and end of the operation (or step through the operation) to find the exact point that memory changed.
Set a second breakpoint at the end of the function or region of code that you want to analyze (or after a suspected memory issue occurs).
The Diagnostic Tools window appears automatically unless you have turned it off. To bring up the window again, click Debug > Windows > Show Diagnostic Tools.
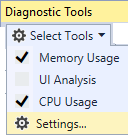
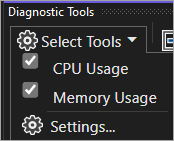
Choose Memory Usage with the Select Tools setting on the toolbar.
Click Debug / Start Debugging (or Start on the toolbar, or F5).
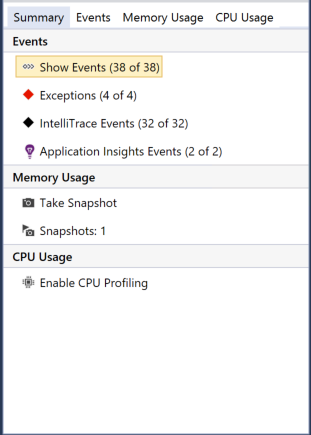
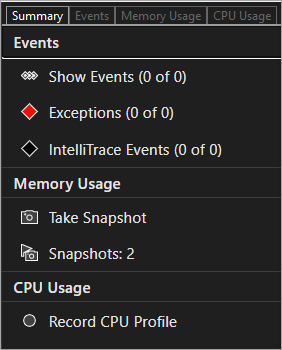
When the app finishes loading, the Summary view of the Diagnostics Tools appears.
Note
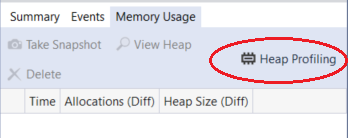
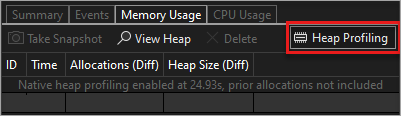
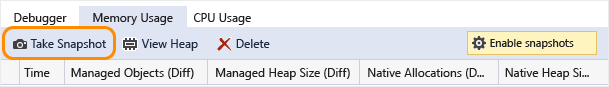
Because collecting memory data can affect the debugging performance of your native or mixed-mode apps, memory snapshots are disabled by default. To enable snapshots in native or mixed-mode apps, start a debugging session (Shortcut key: F5). When the Diagnostic Tools window appears, choose the Memory Usage tab, and then choose Heap Profiling.
Stop (Shortcut key: Shift+F5) and restart debugging.
Note
Because collecting memory data can affect the debugging performance of your native or mixed-mode apps, memory snapshots are disabled by default. To enable snapshots in native or mixed-mode apps, start a debugging session (Shortcut key: F5). When the Diagnostic Tools window appears, choose the Memory Usage tab, and then choose Heap Profiling.
Stop (Shortcut key: Shift+F5) and restart debugging.
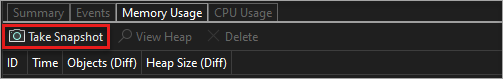
To take a snapshot at the start of your debugging session, choose Take snapshot on the Memory Usage summary toolbar. (It may help to set a breakpoint here as well.)
Tip
To create a baseline for memory comparisons, consider taking a snapshot at the start of your debugging session.
Run the scenario that will cause your first breakpoint to be hit.
While the debugger is paused at the first breakpoint, choose Take snapshot on the Memory Usage summary toolbar.
Press F5 to run the app to your second breakpoint.
Now, take another snapshot.
At this point, you can begin to analyze the data.
If you have trouble collecting or displaying data, see Troubleshoot profiling errors and fix issues.
Analyze memory usage data
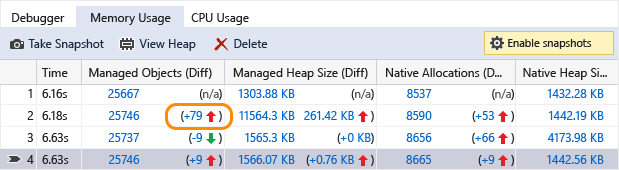
The rows of the Memory Usage summary table list the snapshots that you have taken during the debugging session and provides links to more detailed views.
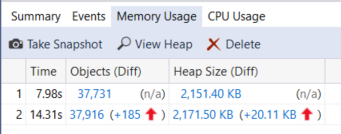
The name of the column depends on the debugging mode you choose in the project properties: .NET, native, or mixed (both .NET and native).
The Objects (Diff) (.NET) or Allocations (Diff) (C++) column display the number of objects in .NET or native memory when the snapshot was taken.
The Heap Size (Diff) column displays the number of bytes in the .NET and native heaps
When you have taken multiple snapshots, the cells of the summary table include the change in the value between the row snapshot and the previous snapshot.
To analyze memory usage, click one of the links that opens up a detailed report of memory usage:
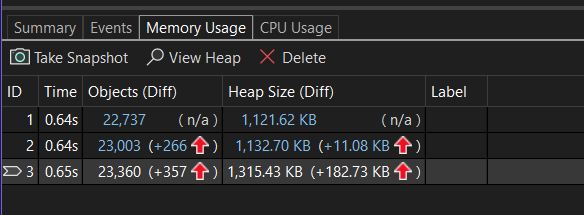
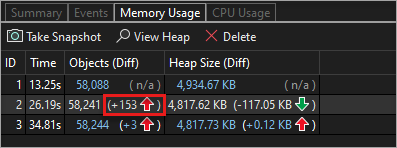
- To view details of the difference between the current snapshot and the previous snapshot, choose the change link to the left of the arrow (
 ). A red arrow indicates an increase in memory usage, and a green arrow indicates a decrease.
Tip
To help identify memory issues more quickly, the diff reports are sorted by object types that increased the most in overall number (click the change link in Objects (Diff) column) or that increased the most in overall heap size (click the change link in Heap Size (Diff) column).
To view details of only the selected snapshot, click the non-change link.
The report appears in a separate window.
Managed types reports
Choose the current link of an Objects (Diff) cell in the Memory Usage summary table.

Note
For .NET code, the View Instances icon (![]() ) is only available while using the debugger-integrated Memory Usage tool or when you open a heap snapshot and choose Debug Managed Memory.
) is only available while using the debugger-integrated Memory Usage tool or when you open a heap snapshot and choose Debug Managed Memory.
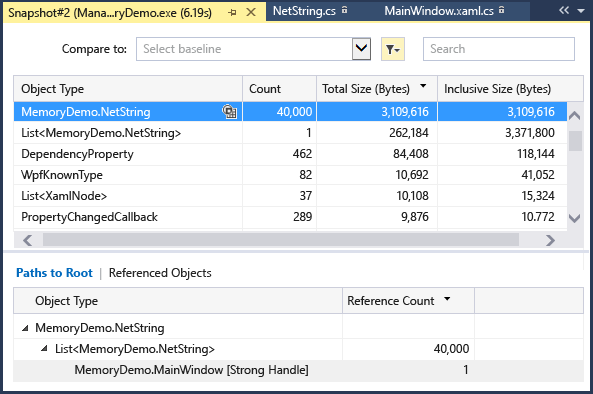
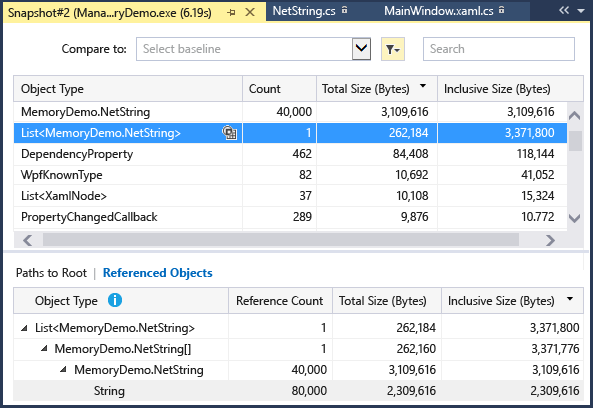
The top pane shows the count and size of the types in the snapshot, including the size of all objects that are referenced by the type (Inclusive Size).
The Paths to Root tree in the bottom pane displays the objects that reference the type selected in the upper pane. The .NET garbage collector cleans up the memory for an object only when the last type that references it has been released.
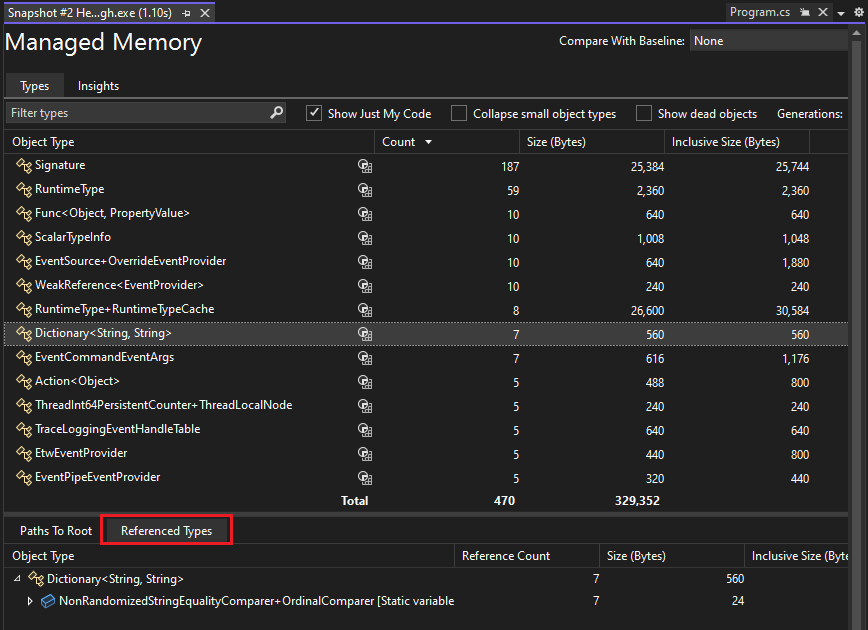
The Referenced Types tree displays the references that are held by the type selected in the upper pane.
The Referenced Types tree displays the references that are held by the type selected in the upper pane.
To display the instances of a selected type in the upper pane, click the View Instances icon next to the object type.

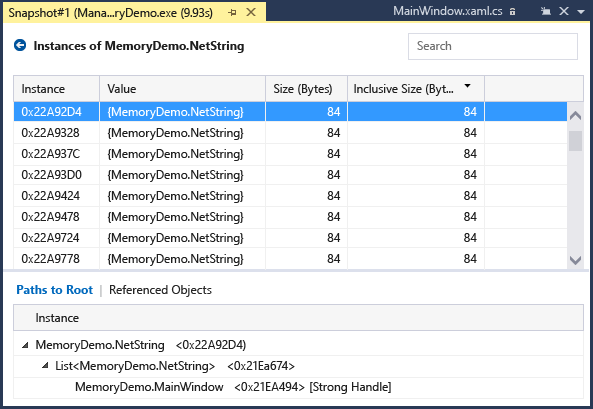
The Instances view displays the instances of the selected object in the snapshot in the upper pane. The Paths to Root and Referenced Objects pane displays the objects that reference the selected instance and the types that the selected instance references. When the debugger is stopped at the point where the snapshot was taken, you can hover over the Value cell to display the values of the object in a tool tip.
Native types reports
Choose the current link of an Allocations (Diff) or Heap Size (Diff) cell in the Memory Usage summary table of the Diagnostic Tools window.


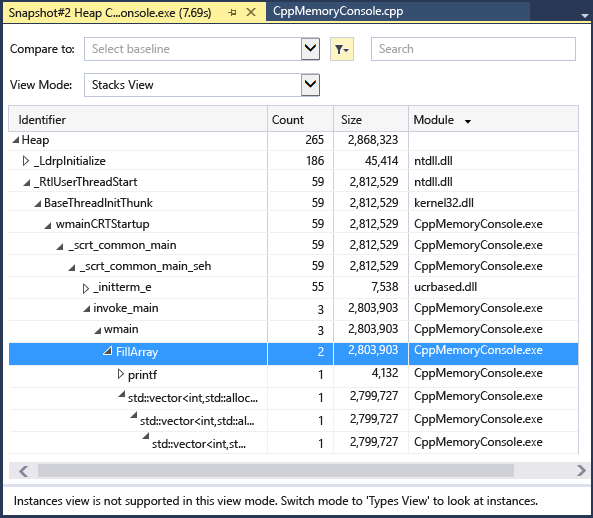
The Types View displays the number and size of the types in the snapshot.
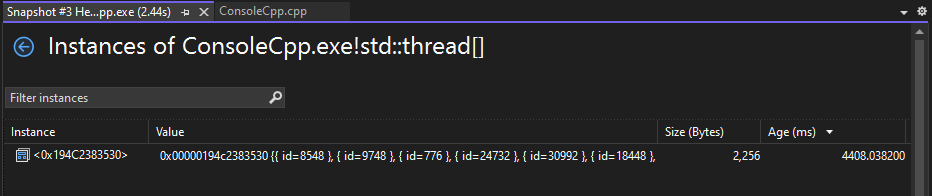
Choose the View Instances icon next to a selected type to display information about the objects of the selected type in the snapshot.
The Instances view displays each instance of the selected type. Selecting an instance displays the call stack that resulted in the creation of the instance in the Allocation Call Stack pane.

Choose the instances icon (
 ) of a selected type to display information about the objects of the selected type in the snapshot.
The Instances view displays each instance of the selected type. Selecting an instance displays the call stack that resulted in the creation of the instance in the Allocation Call Stack pane.
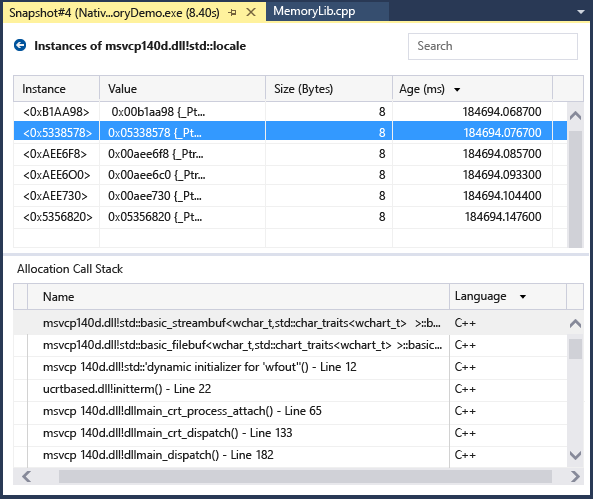
Choose Stacks to see the allocation stack for the selected type.
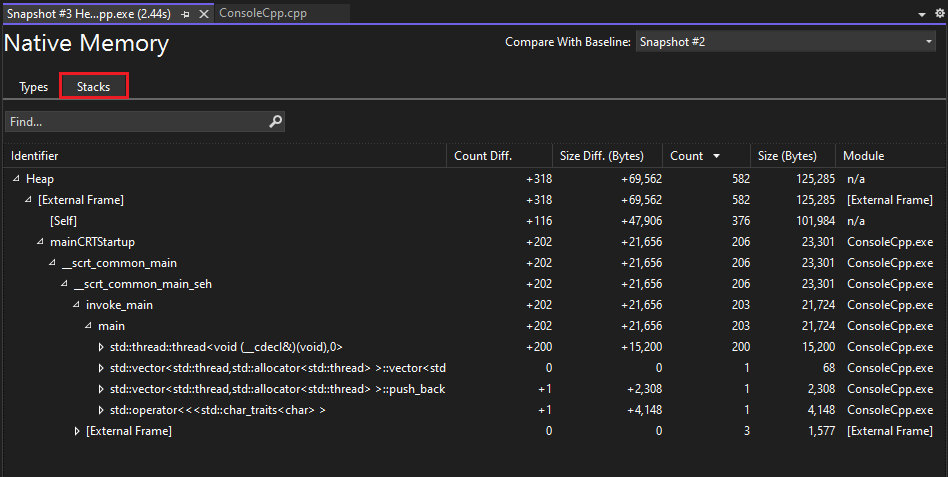

Choose Stacks View in the View Mode list to see the allocation stack for the selected type.
Memory Usage Insights
For managed memory, the Memory Analysis tool also gives multiple powerful built-in auto insights. Select the Insights tab in the Managed types reports and it shows the applicable auto insights like Duplicate strings, Sparse arrays, and Event handler leaks.

The Duplicate Strings section shows the list of strings that get allocated multiple times on the heap. In addition, this section shows the total wasted memory, that is, the (number of instances - 1) times the size of the string.
The Sparse Arrays section shows arrays that are mostly filled with zero elements, which can be inefficient in terms of performance and memory usage. The memory analysis tool will automatically detect these arrays and show you how much memory is being wasted due to these zero values.
The Event Handler Leaks section, available in Visual Studio 2022 version 17.9 Preview 1, shows potential memory leaks that can occur when one object subscribes to another object's event. If the publisher of the event outlives the subscriber, the subscriber remains alive, even if there are no other references to it. This can lead to memory leaks, where unused memory isn't properly freed, causing the application to use more and more memory over time.
Certain types are known to have fields that can be read to determine the size of the native memory they're holding onto. The Insights tab shows fake native memory nodes in the object graph, which are retained by their parent objects such that the UI will recognize them and display their size and reference graph.

Change (Diff) reports
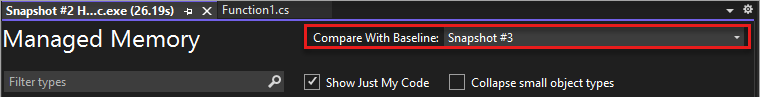
Choose the change link in a cell of the summary table of the Memory Usage tab on the Diagnostic Tools window.
Choose a snapshot in the Compare To list of a managed or native report.
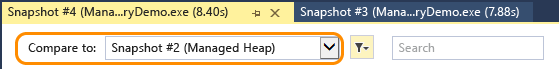
The change report adds columns (marked with (Diff)) to the base report that show the difference between the base snapshot value and the comparison snapshot. Here's how a Native Type View diff report might look:

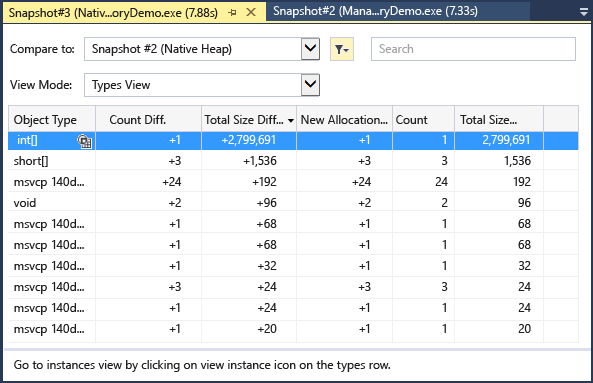
The top pane shows the count and size of the types in the snapshot, including the size of all objects that are referenced by the type (Inclusive Size).
Blogs and videos
Analyze CPU and Memory While Debugging
Visual C++ Blog: Memory Profiling in Visual C++ 2015
Next steps
In this tutorial, you've learned how to collect and analyze memory usage data. If you already completed the tour of the profiler, you may want to read about a general approach to optimizing code using the profiling tools.
In this tutorial, you've learned how to collect and analyze memory usage data while debugging. You may want to find out more about analyzing memory usage in release builds using the Performance Profiler.