Note
Access to this page requires authorization. You can try signing in or changing directories.
Access to this page requires authorization. You can try changing directories.
APPLIES TO: ![]() Power BI Report Builder
Power BI Report Builder ![]() Power BI Desktop
Power BI Desktop
This article provides information and links to several sample Power BI paginated reports to download and explore. They demonstrate typical ways you can use paginated reports.
Prerequisites
License requirements for Power BI paginated reports (.rdl files) are the same as for Power BI reports (.pbix files).
- You don't need a license to download Power BI Report Builder from the Microsoft Download Center for free.
- With a free license, you can publish paginated reports to My Workspace in the Power BI service. For more information, see Feature availability for users with free licenses in the Power BI service.
- With a Power BI Pro license or a PPU license, you can publish paginated reports to other workspaces. You also need at least a contributor role in the workspace.
- You need Build permission for the dataset.
- Now you're ready to download these sample paginated reports from GitHub. You don't need a GitHub account.
Download the reports
To download the reports successfully, you need to download the repo as a zip file and then extract them. Paginated reports are .rdl files.
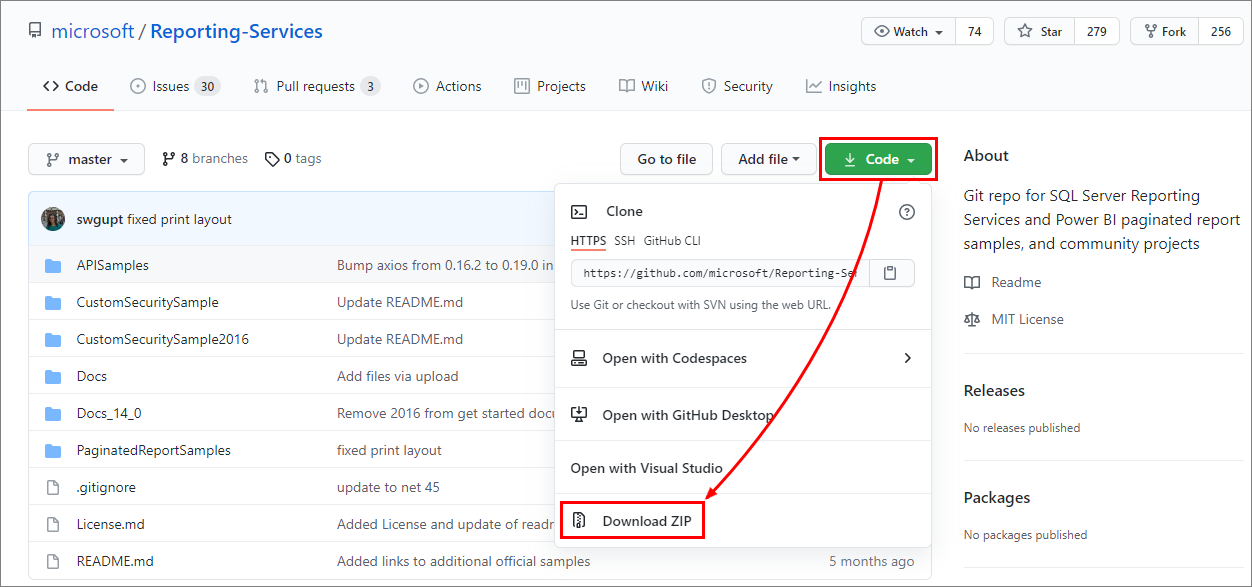
Open the Reporting Services GitHub repo.
Select the arrow on the green Code button > Download ZIP.
Open the file, select Extract all, and choose a location for the files. By default, the folder name is Reporting-Services-master.
Open the Reporting-Services-master folder, then open the PaginatedReportSamples folder.
Note
You can delete all the other folders in the Reporting-Services-master folder. They contain other samples you don't need.
Select one of the .rdl files to open it in Power BI Report Builder.
Now you can publish the paginated report to the Power BI service.
Invoice
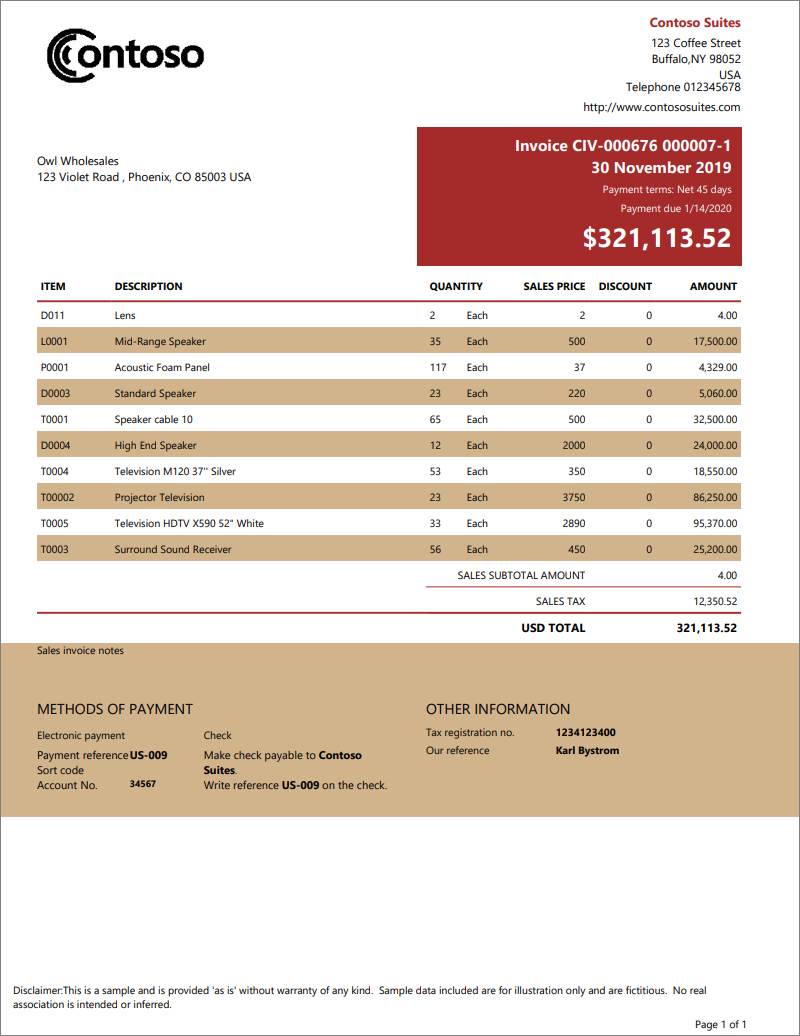
This paginated report is a self-contained invoice. The scenario for this report is that you want a print-ready invoice. It needs to show the total sales with details listing item descriptions, quantities, discounts, and cost.
This sample highlights unique characteristics for creating real-world invoices, such as:
- A tablix (the data region underlying both tables and matrixes). It displays dynamically generated user-specific content as well as theme.
- A rectangular data region placed at each row of the tablix of the report body.
- Report items such as text boxes and lines.
- A report parameter to select the content dynamically. The content that is shown applies to a specific subject by using expression placeholders.
Data source: Included in the .rdl file
Labels
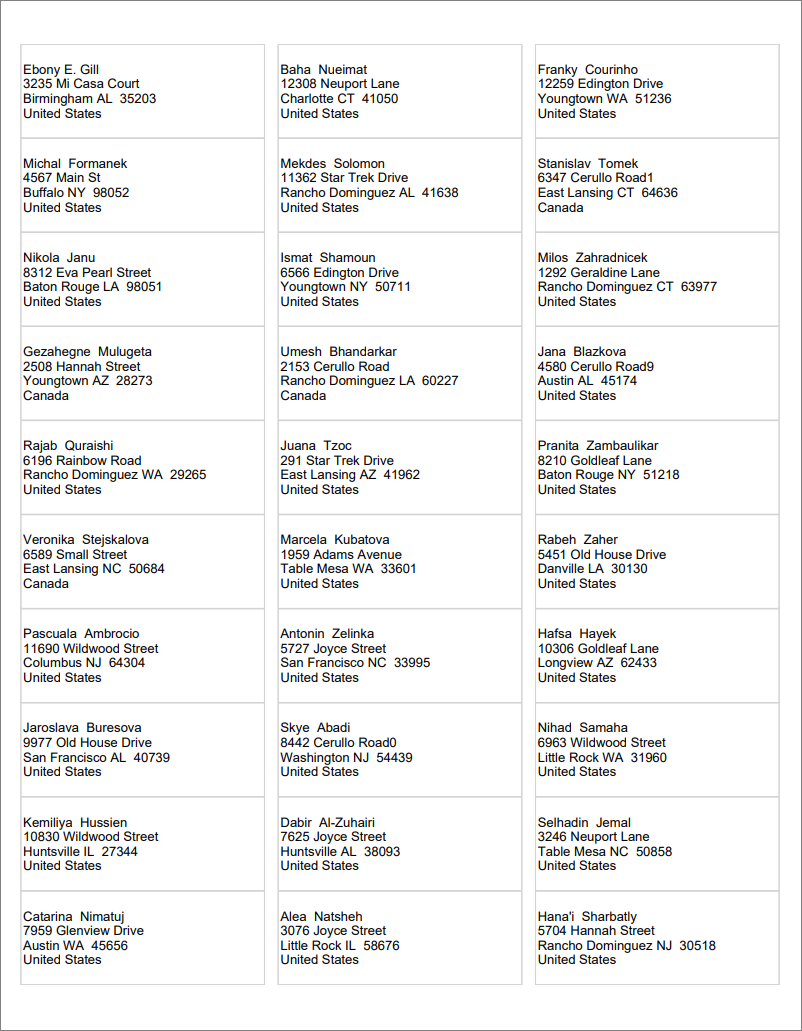
This is a self-contained paginated report sample. It's a multi-column report perfectly sized to fit the print layout of the mailing label template.
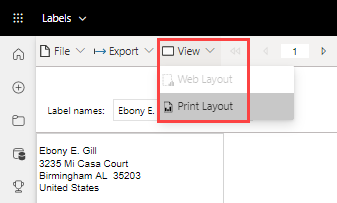
View the report
When you run this report in Report Builder, it appears to have only one column.
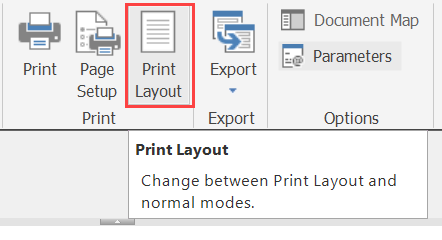
Select Print Layout to see what it will look like when you print it.
Likewise, when you upload this report to the Power BI service and open it there, it opens with only one column.
Select View > Print Layout to see the multicolumn view.
Report characteristics
Label reports are simple, but have a few unique characteristics to create a paginated label:
- A tablix with a fixed column count of three, with defined column spacing.
- A rectangular data region that repeats across rows and columns on the printed page.
- A report parameter to select the content to be shown in each rectangular data region.
Data source: Included in the .rdl
Mailing letter
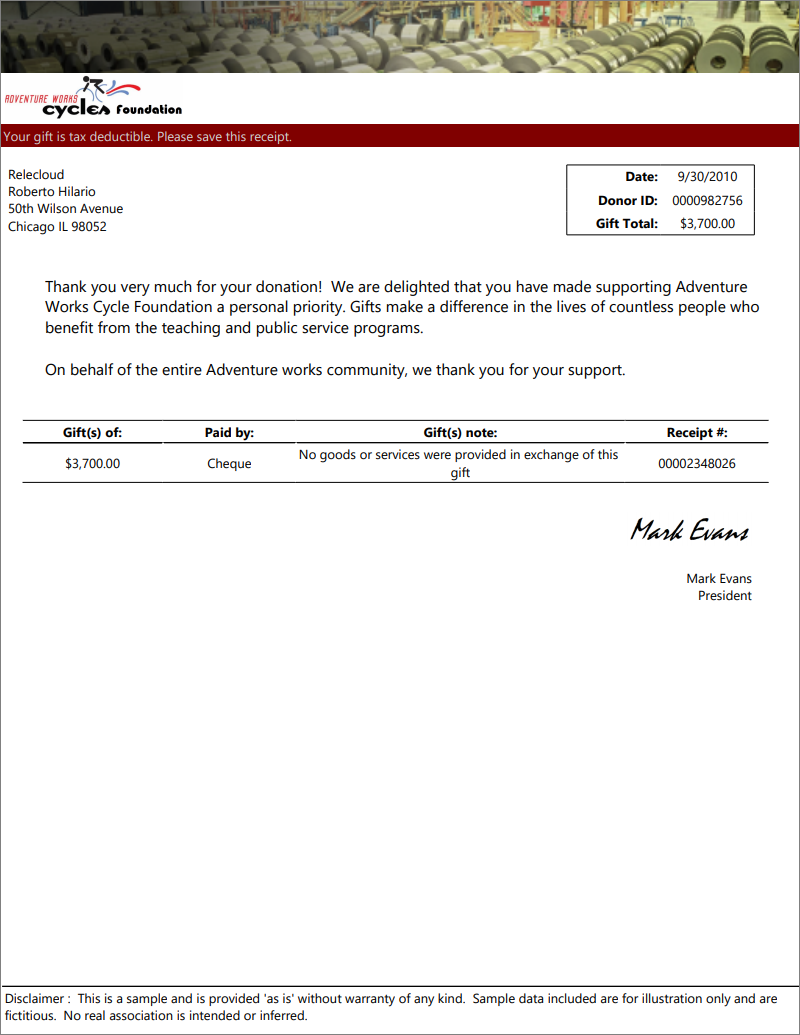
This self-contained paginated report sample is designed for creating real world mailing letters. The scenario for this report is that you want a print-ready letter with dynamic content.
This sample has unique characteristics, such as:
- A rectangular data region is placed at different sections of the report body.
- Images to personalize the letter.
- A tablix data region (the data region underlying both tables and matrixes). The tablix displays dynamically generated user-specific content.
- Report items such as text boxes and lines.
- A report parameter to select the content dynamically. The content that is shown applies to a specific subject by using expression placeholders.
Data source: Included in the .rdl
Transcript
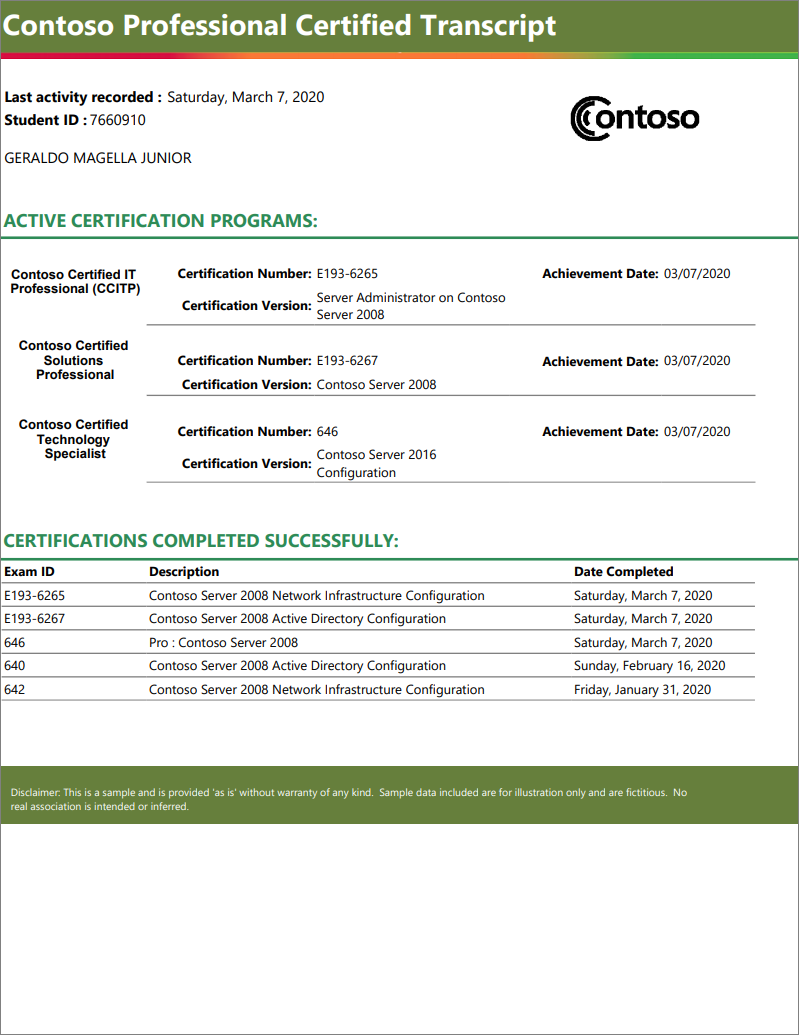
The scenario for this report is that you want a print-ready transcript. It needs to contain dynamic content listing program description details and dates for each student.
This self-contained paginated report sample has unique characteristics such as:
- A tablix data region (the data region underlying both tables and matrixes). The tablix displays dynamically generated user-specific content using nested rows groups.
- Rectangular data regions are placed in different sections of the report body.
- Report items such as text boxes and lines.
Data source: Included in the .rdl
Sales Performance
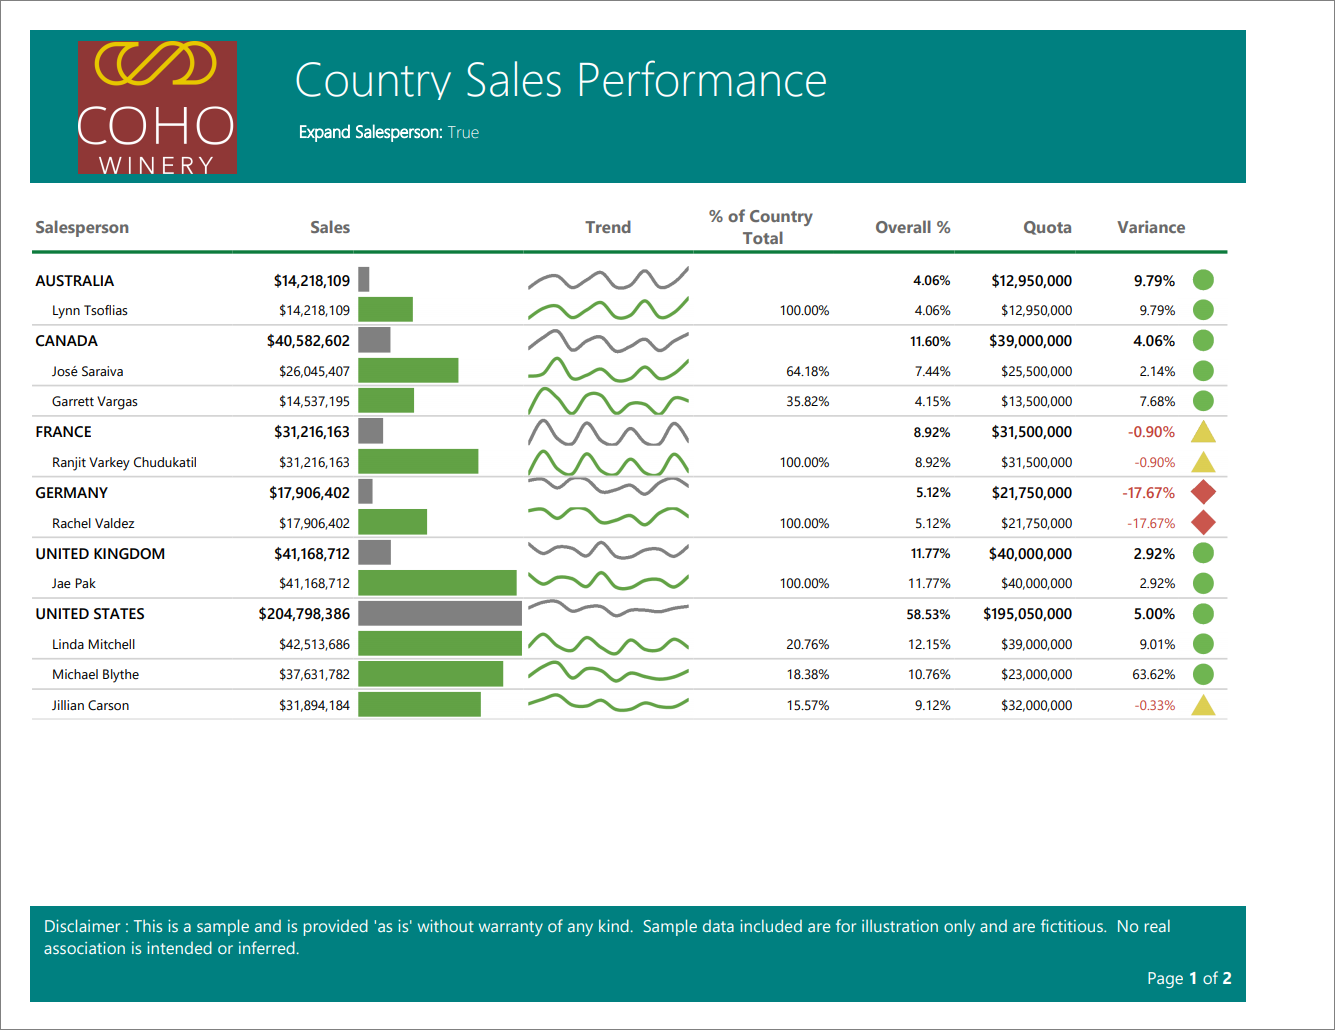
Country Sales Performance is a self-contained paginated report sample. The scenario for this report is that you want a print-ready invoice to see total sales and details. It showcases these features:
- The use of a parameter to expand details in the table.
- Headers and footers.
- Report items such as text boxes, lines, and rectangles using expression placeholders.
- Data bars.
- Trendlines.
- Gauge panels.
Data source: Included in the .rdl
Regional Sales
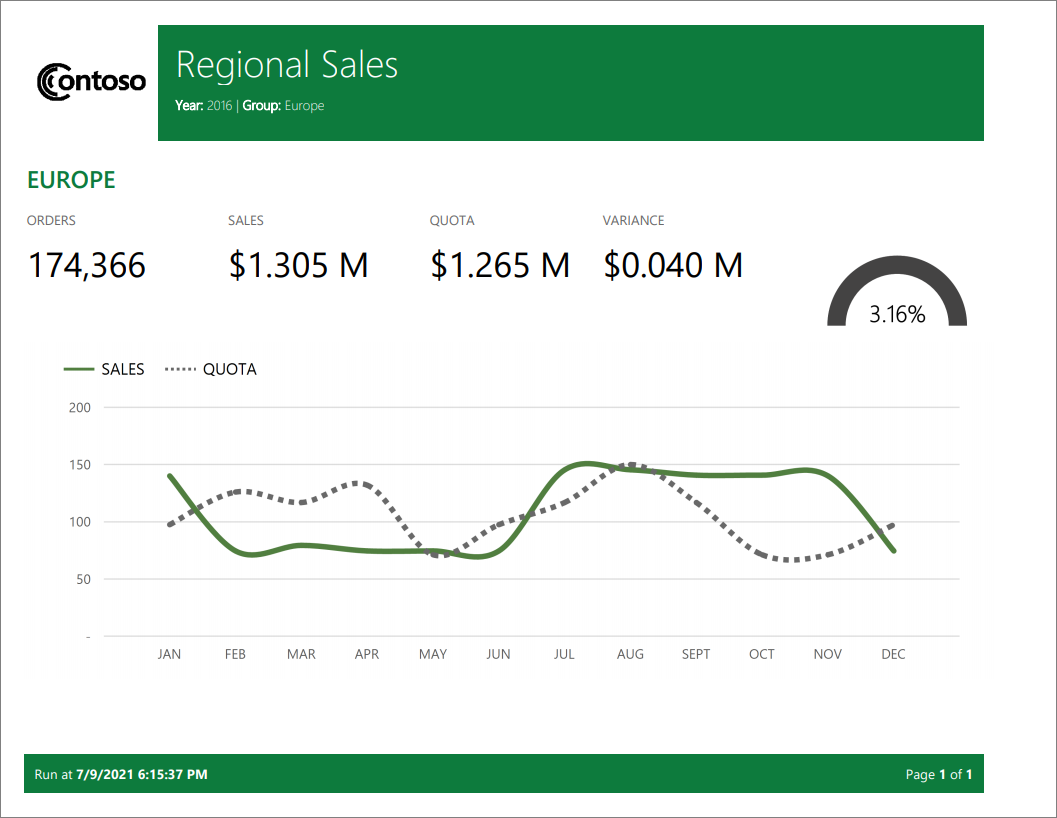
Regional Sales is a self-contained paginated report sample. The scenario for this report is that you want a print-ready report to see total sales vs. quota. It showcases these features:
- The use of a parameter to show selected details in the table.
- Headers and footers.
- Report items such as text boxes, lines, and rectangles using expression placeholders.
- Gauge panels.
- Line chart placed inside the table.
Data source: Included in the .rdl
Organization Expenditures
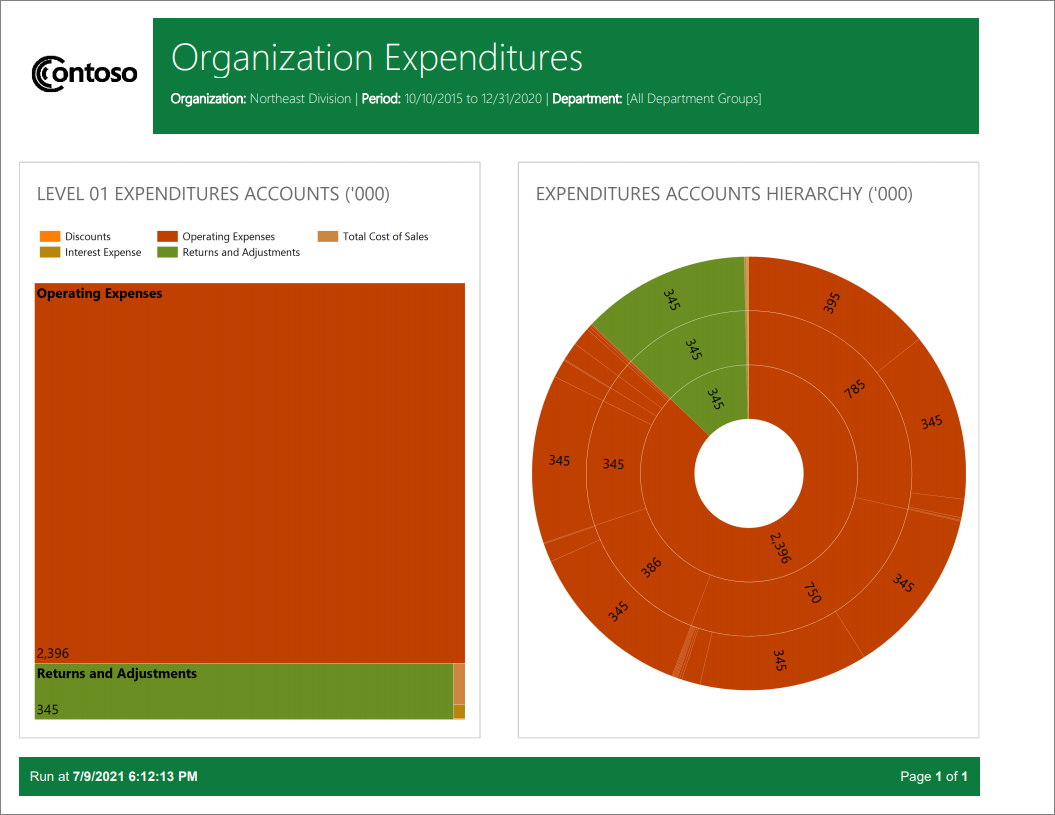
Organization Expenditures is a self-contained paginated report sample. The scenario for this report is that you want a print-ready expense report to see breakdown of expenses in your organization. It showcases these features:
- Headers and footers.
- Report items such as text boxes, lines, and rectangles using expression placeholders.
- Charts such as treemap and sun burst.
Data source: Included in the .rdl
Next steps
View a paginated report in the Power BI service
More questions? Try the Power BI Community