Diagnostic logs - Azure Content Delivery Network
Important
Azure CDN Standard from Microsoft (classic) will be retired on September 30, 2027. To avoid any service disruption, it's important that you migrate your Azure CDN Standard from Microsoft (classic) profiles to Azure Front Door Standard or Premium tier by September 30, 2027. For more information, see Azure CDN Standard from Microsoft (classic) retirement.
Azure CDN from Edgio was retired on January 15, 2025. For more information, see Azure CDN from Edgio retirement FAQ.
With Azure diagnostic logs, you can view core analytics and save them into one or more destinations including:
- Azure Storage account
- Log Analytics workspace
- Azure Event Hubs
This feature is available on content delivery network endpoints for all pricing tiers.
Diagnostics logs allow you to export basic usage metrics from your content delivery network endpoint to different kinds sources so that you can consume them in a customized way. You can do the following types of data export:
- Export data to blob storage, export to CSV, and generate graphs in Excel.
- Export data to Event Hubs and correlate with data from other Azure services.
- Export data to Azure Monitor logs and view data in your own Log Analytics workspace
An Azure Content Delivery Network profile is required for the following steps. Refer to Create an Azure Content Delivery Network profile and endpoint before you continue.
Enable logging with the Azure portal
Follow these steps enable logging for your Azure Content Delivery Network endpoint:
Sign in to the Azure portal.
In the Azure portal, navigate to All resources > your-cdn-profile.
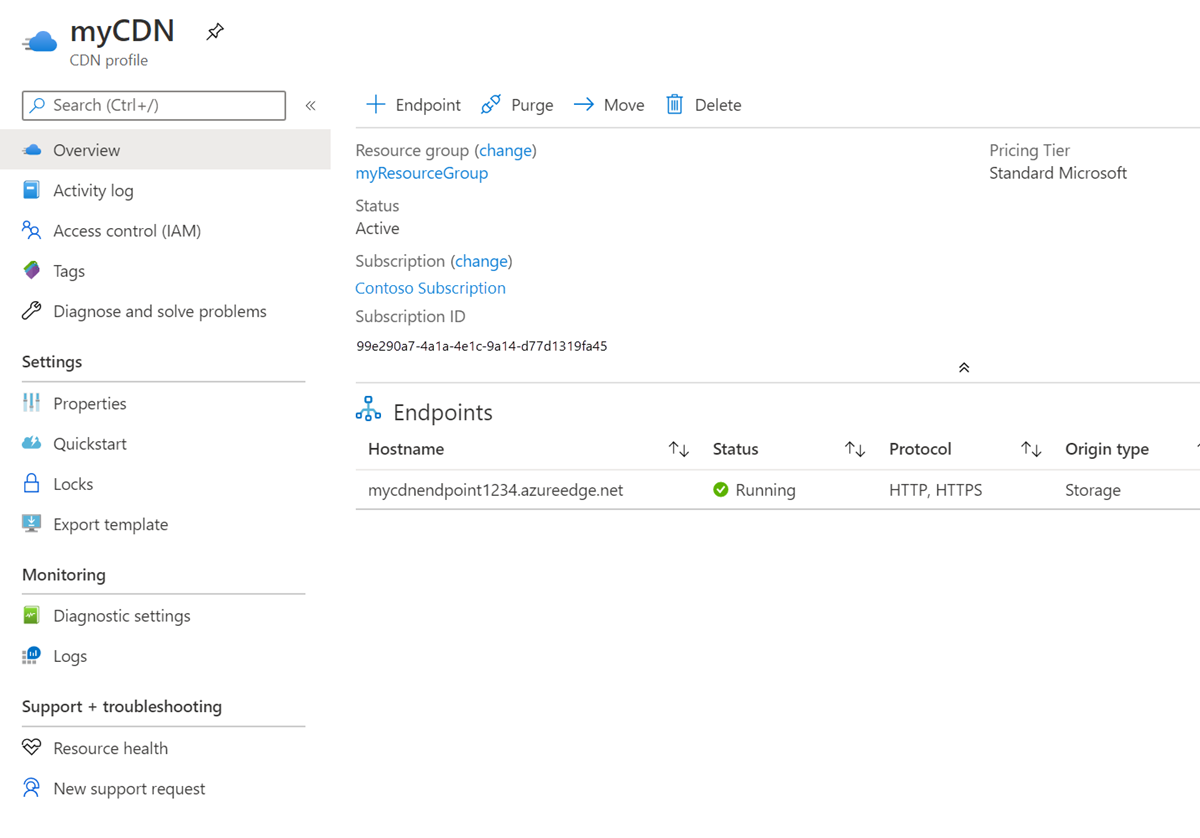
Select the content delivery network endpoint for which you want to enable diagnostics logs:
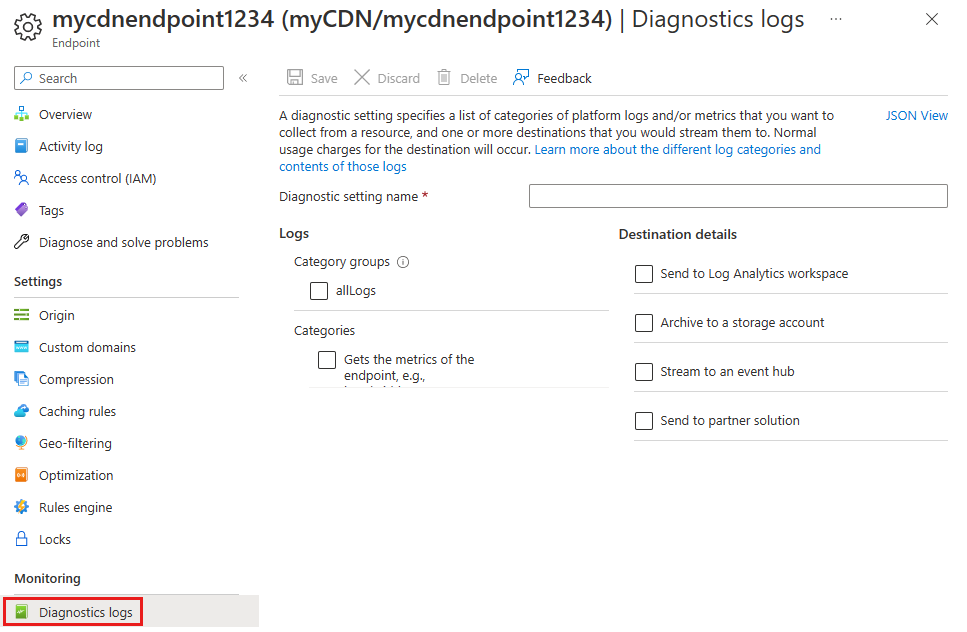
Select Diagnostics logs in the Monitoring section:
Enable logging with Azure Storage
To use a storage account to store the logs, follow these steps:
Note
A storage account is required to complete these steps. Refer to: Create an Azure Storage account for more information.
For Diagnostic setting name, enter a name for your diagnostic log settings.
Select Archive to a storage account, then select CoreAnalytics.
For Retention (days), choose the number of retention days. A retention of zero days stores the logs indefinitely.
Select the subscription and storage account for the logs.
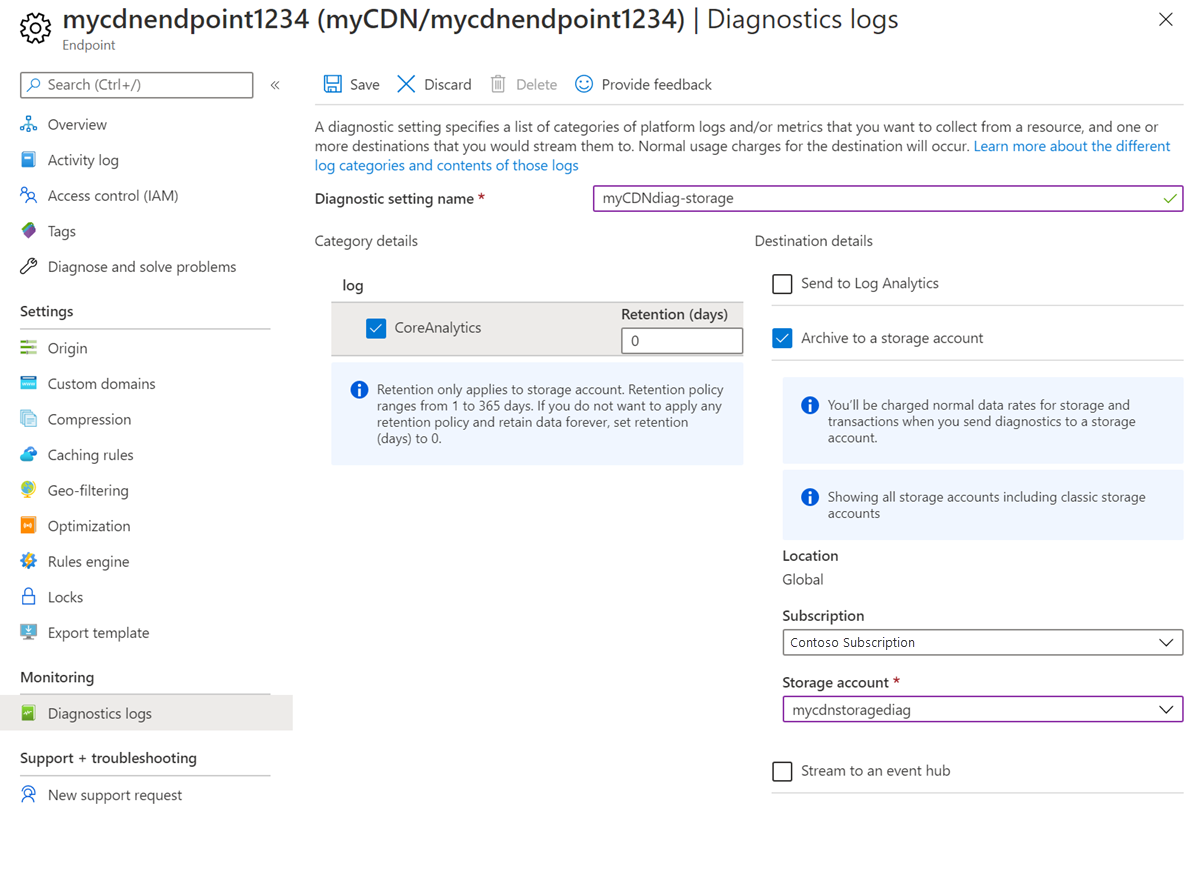
Select Save.
Send to Log Analytics
To use Log Analytics for the logs, follow these steps:
Note
A Log Analytics workspace is required to complete these steps. Refer to: Create a Log Analytics workspace in the Azure portal for more information.
For Diagnostic setting name, enter a name for your diagnostic log settings.
Select Send to Log Analytics, then select CoreAnalytics.
Select the subscription and Log Analytics workspace for the logs.
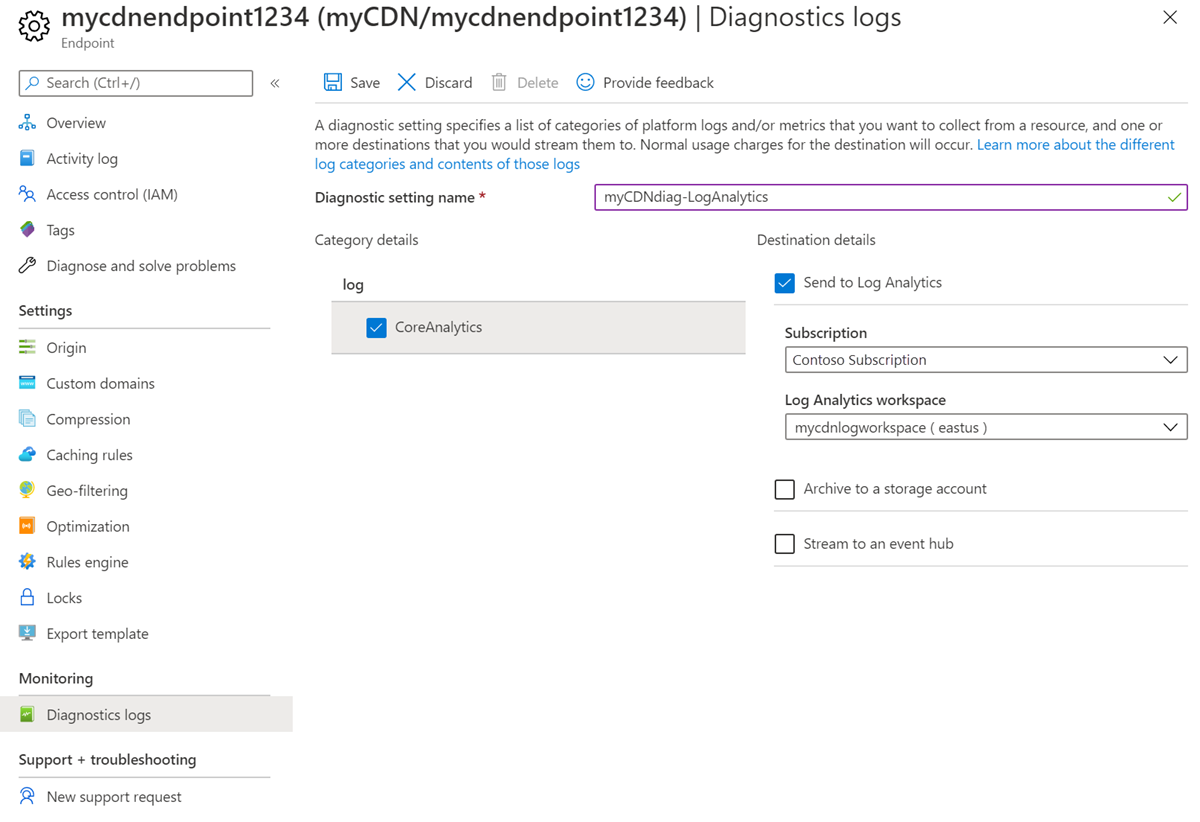
Select Save.
Stream to an event hub
To use an event hub for the logs, follow these steps:
Note
An event hub is required to complete these steps. Refer to: Quickstart: Create an event hub using Azure portal for more information.
For Diagnostic setting name, enter a name for your diagnostic log settings.
Select Stream to an event hub, then select CoreAnalytics.
Select the subscription and event hub namespace for the logs.
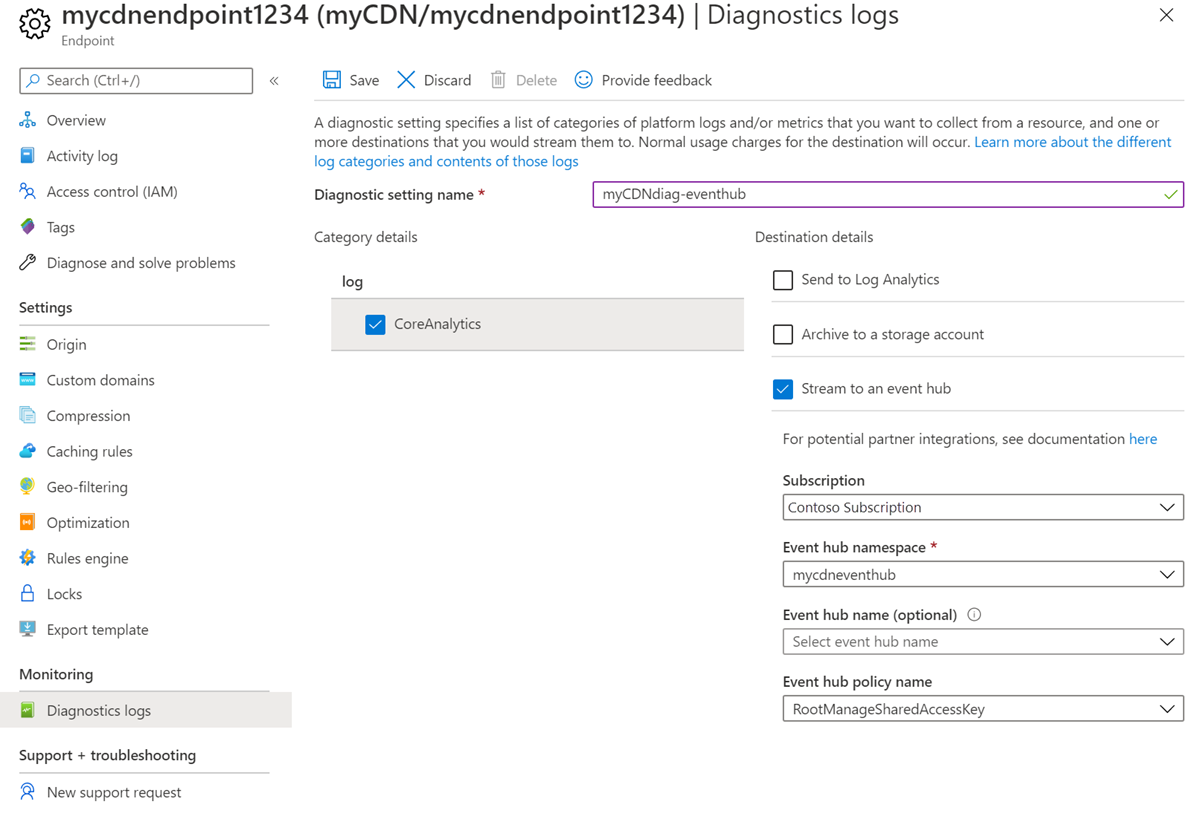
Select Save.
Enable logging with PowerShell
The following example shows how to enable diagnostic logs via the Azure PowerShell Cmdlets.
Note
We recommend that you use the Azure Az PowerShell module to interact with Azure. To get started, see Install Azure PowerShell. To learn how to migrate to the Az PowerShell module, see Migrate Azure PowerShell from AzureRM to Az.
Enable diagnostic logs in a storage account
Sign in to Azure PowerShell:
Connect-AzAccountTo enable Diagnostic Logs in a storage account, enter these commands. Replace the variables with your values:
$rsg = <your-resource-group-name>
$cdnprofile = <your-cdn-profile-name>
$cdnendpoint = <your-cdn-endpoint-name>
$storageacct = <your-storage-account-name>
$diagname = <your-diagnostic-setting-name>

$cdn = Get-AzCdnEndpoint -ResourceGroupName $rsg -ProfileName $cdnprofile -EndpointName $cdnendpoint

$storage = Get-AzStorageAccount -ResourceGroupName $rsg -Name $storageacct

Set-AzDiagnosticSetting -Name $diagname -ResourceId $cdn.id -StorageAccountId $storage.id -Enabled $true -Categories CoreAnalytics
Enable diagnostics logs for Log Analytics workspace
Sign in to Azure PowerShell:
Connect-AzAccountTo enable Diagnostic Logs for a Log Analytics workspace, enter these commands. Replace the variables with your values:
$rsg = <your-resource-group-name>
$cdnprofile = <your-cdn-profile-name>
$cdnendpoint = <your-cdn-endpoint-name>
$workspacename = <your-log-analytics-workspace-name>
$diagname = <your-diagnostic-setting-name>

$cdn = Get-AzCdnEndpoint -ResourceGroupName $rsg -ProfileName $cdnprofile -EndpointName $cdnendpoint

$workspace = Get-AzOperationalInsightsWorkspace -ResourceGroupName $rsg -Name $workspacename

Set-AzDiagnosticSetting -Name $diagname -ResourceId $cdn.id -WorkspaceId $workspace.ResourceId -Enabled $true -Categories CoreAnalytics
Enable diagnostics logs for event hub namespace
Sign in to Azure PowerShell:
Connect-AzAccountTo enable Diagnostic Logs for a Log Analytics workspace, enter these commands. Replace the variables with your values:
$rsg = <your-resource-group-name>
$cdnprofile = <your-cdn-profile-name>
$cdnendpoint = <your-cdn-endpoint-name>
$eventhubname = <your-event-hub-namespace-name>
$diagname = <your-diagnostic-setting-name>

$cdn = Get-AzCdnEndpoint -ResourceGroupName $rsg -ProfileName $cdnprofile -EndpointName $cdnendpoint

Set-AzDiagnosticSetting -Name $diagname -ResourceId $cdn.id -EventHubName $eventhubname -Enabled $true -Categories CoreAnalytics
Consuming diagnostics logs from Azure Storage
This section describes the schema of content delivery network core analytics, organization in an Azure Storage account, and provides sample code to download the logs in a CSV file.
Using Microsoft Azure Storage Explorer
To download the tool, see Azure Storage Explorer. After downloading and installing the software, configure it to use the same Azure Storage account that was configured as a destination to the content delivery network Diagnostics Logs.
- Open Microsoft Azure Storage Explorer
- Locate the storage account
- Expand the Blob Containers node under this storage account.
- Select the container named insights-logs-coreanalytics.
- Results show up on the right-hand pane, starting with the first level, as resourceId=. Continue selecting each level until you find the file PT1H.json. For an explanation of the path, see Blob path format.
- Each blob PT1H.json file represents the analytics logs for one hour for a specific content delivery network endpoint or its custom domain.
- The schema of the contents of this JSON file is described in the section schema of the core analytics logs.
Blob path format
Core analytics logs are generated every hour and the data is collected and stored inside a single Azure blob as a JSON payload. Storage explorer tool interprets '/' as a directory separator and shows the hierarchy. The path to the Azure blob appears as if there's a hierarchical structure and represents the blob name. The name of the blob follows the following naming convention:
resourceId=/SUBSCRIPTIONS/{Subscription Id}/RESOURCEGROUPS/{Resource Group Name}/PROVIDERS/MICROSOFT.CDN/PROFILES/{Profile Name}/ENDPOINTS/{Endpoint Name}/ y=/m=/d=/h=/m=/PT1H.json
Description of fields:
| Value | Description |
|---|---|
| Subscription ID | ID of the Azure subscription in globally unique identifier (GUID) format. |
| Resource Group Name | Name of the resource group to which the content delivery network resources belong. |
| Profile Name | Name of the content delivery network Profile |
| Endpoint Name | Name of the content delivery network Endpoint |
| Year | Four-digit representation of the year, for example, 2017 |
| Month | Two-digit representation of the month number. 01=January ... 12=December |
| Day | Two-digit representation of the day of the month |
| PT1H.json | Actual JSON file where the analytics data is stored |
Exporting the core analytics data to a CSV file
To access core analytics, sample code for a tool is provided. This tool allows downloading the JSON files into a flat comma-separated file format, which can be used to create charts or other aggregations.
Here's how you can use the tool:
- Visit the GitHub link: https://github.com/Azure-Samples/azure-cdn-samples/tree/master/CoreAnalytics-ExportToCsv
- Download the code.
- Follow the instructions to compile and configure.
- Run the tool.
- The resulting CSV file shows the analytics data in a simple flat hierarchy.
Log data delays
Microsoft log data is delayed by up to 1 hour. This delay is due to the time it takes to process and store the data.
Diagnostic log types for content delivery network core analytics
Microsoft currently offers core analytics logs only, which contain metrics showing HTTP response statistics and egress statistics as seen from the content delivery network POPs/edges.
Core analytics metrics details
The following table shows a list of metrics available in the core analytics logs.
Not all metrics are available from all providers, although such differences are minimal. The table also displays whether a given metric is available from a provider. The metrics are available for only those content delivery network endpoints that have traffic on them.
| Metric | Description |
|---|---|
| RequestCountTotal | Total number of request hits during this period. |
| RequestCountHttpStatus2xx | Count of all requests that resulted in a 2xx HTTP code (for example, 200, 202). |
| RequestCountHttpStatus3xx | Count of all requests that resulted in a 3xx HTTP code (for example, 300, 302). |
| RequestCountHttpStatus4xx | Count of all requests that resulted in a 4xx HTTP code (for example, 400, 404). |
| RequestCountHttpStatus5xx | Count of all requests that resulted in a 5xx HTTP code (for example, 500, 504). |
| RequestCountHttpStatusOthers | Count of all other HTTP codes (outside of 2xx-5xx). |
| RequestCountHttpStatus200 | Count of all requests that resulted in a 200 HTTP code response. |
| RequestCountHttpStatus206 | Count of all requests that resulted in a 206 HTTP code response. |
| RequestCountHttpStatus302 | Count of all requests that resulted in a 302 HTTP code response. |
| RequestCountHttpStatus304 | Count of all requests that resulted in a 304 HTTP code response. |
| RequestCountHttpStatus404 | Count of all requests that resulted in a 404 HTTP code response. |
| RequestCountCacheHit | Count of all requests that resulted in a Cache hit. The asset was served directly from the POP to the client. |
| RequestCountCacheMiss | Count of all requests that resulted in a Cache miss. A Cache miss means the asset wasn't found on the POP closest to the client, and was retrieved from the origin. |
| RequestCountCacheNoCache | Count of all requests to an asset that are prevented from being cached because of a user configuration on the edge. |
| RequestCountCacheUncacheable | Count of all requests to assets that are prevented from getting cached by the asset's Cache-Control and Expires headers. This count indicates that it shouldn't be cached on a POP or by the HTTP client. |
| EgressTotal | Outbound data transfer in GB |
| EgressHttpStatus2xx | Outbound data transfer* for responses with 2xx HTTP status codes in GB. |
| EgressHttpStatus3xx | Outbound data transfer for responses with 3xx HTTP status codes in GB. |
| EgressHttpStatus4xx | Outbound data transfer for responses with 4xx HTTP status codes in GB. |
| EgressHttpStatus5xx | Outbound data transfer for responses with 5xx HTTP status codes in GB. |
| EgressHttpStatusOthers | Outbound data transfer for responses with other HTTP status codes in GB. |
| EgressCacheHit | Outbound data transfer for responses that were delivered directly from the content delivery network cache on the content delivery network POPs/Edges. |
| EgressCacheMiss | Outbound data transfer for responses that weren't found on the nearest POP server, and retrieved from the origin server. |
| EgressCacheNoCache | Outbound data transfer for assets that are prevented from being cached because of a user configuration on the edge. |
| EgressCacheUncacheable | Outbound data transfer for assets that are prevented from getting cached by the asset's Cache-Control and, or Expires headers. Indicates that it shouldn't be cached on a POP or by the HTTP client. |
*Outbound data transfer refers to traffic delivered from content delivery network POP servers to the client.
Schema of the core analytics logs
All logs are stored in JSON format and each entry has string fields according to the following schema:
    "records": [
        {
            "time": "2017-04-27T01:00:00",
            "resourceId": "<ARM Resource Id of the CDN Endpoint>",
            "operationName": "Microsoft.Cdn/profiles/endpoints/contentDelivery",
            "category": "CoreAnalytics",
            "properties": {
                "DomainName": "<Name of the domain for which the statistics is reported>",
                "RequestCountTotal": integer value,
                "RequestCountHttpStatus2xx": integer value,
                "RequestCountHttpStatus3xx": integer value,
                "RequestCountHttpStatus4xx": integer value,
                "RequestCountHttpStatus5xx": integer value,
                "RequestCountHttpStatusOthers": integer value,
                "RequestCountHttpStatus200": integer value,
                "RequestCountHttpStatus206": integer value,
                "RequestCountHttpStatus302": integer value,
                "RequestCountHttpStatus304": integer value,
                "RequestCountHttpStatus404": integer value,
                "RequestCountCacheHit": integer value,
                "RequestCountCacheMiss": integer value,
                "RequestCountCacheNoCache": integer value,
                "RequestCountCacheUncacheable": integer value,
                "RequestCountCacheOthers": integer value,
                "EgressTotal": double value,
                "EgressHttpStatus2xx": double value,
                "EgressHttpStatus3xx": double value,
                "EgressHttpStatus4xx": double value,
                "EgressHttpStatus5xx": double value,
                "EgressHttpStatusOthers": double value,
                "EgressCacheHit": double value,
                "EgressCacheMiss": double value,
                "EgressCacheNoCache": double value,
                "EgressCacheUncacheable": double value,
                "EgressCacheOthers": double value,
            }
        }

    ]
}
Where time represents the start time of the hour boundary for which the statistics is reported. A metric unsupported by a content delivery network provider, instead of a double or integer value, results in a null value. This null value indicates the absence of a metric, and is different from a value of 0. One set of these metrics per domain is configured on the endpoint.
Example properties:
{
     "DomainName": "azurecdntest.azureedge.net",
     "RequestCountTotal": 480,
     "RequestCountHttpStatus2xx": 480,
     "RequestCountHttpStatus3xx": 0,
     "RequestCountHttpStatus4xx": 0,
     "RequestCountHttpStatus5xx": 0,
     "RequestCountHttpStatusOthers": 0,
     "RequestCountHttpStatus200": 480,
     "RequestCountHttpStatus206": 0,
     "RequestCountHttpStatus302": 0,
     "RequestCountHttpStatus304": 0,
     "RequestCountHttpStatus404": 0,
     "RequestCountCacheHit": null,
     "RequestCountCacheMiss": null,
     "RequestCountCacheNoCache": null,
     "RequestCountCacheUncacheable": null,
     "RequestCountCacheOthers": null,
     "EgressTotal": 0.09,
     "EgressHttpStatus2xx": null,
     "EgressHttpStatus3xx": null,
     "EgressHttpStatus4xx": null,
     "EgressHttpStatus5xx": null,
     "EgressHttpStatusOthers": null,
     "EgressCacheHit": null,
     "EgressCacheMiss": null,
     "EgressCacheNoCache": null,
     "EgressCacheUncacheable": null,
     "EgressCacheOthers": null
}