Note
Access to this page requires authorization. You can try signing in or changing directories.
Access to this page requires authorization. You can try changing directories.
This tutorial shows how to use the Stream Analytics no code editor to compute aggregates on real-time data streams and store them in Azure Synapse Analytics.
In this tutorial, you learn how to:
- Deploy an event generator that sends data to your event hub
- Create a Stream Analytics job by using the no code editor
- Review input data and schema
- Select fields to group by and define aggregations like count
- Configure Azure Synapse Analytics to which results are written
- Run the Stream Analytics job
- Visualize data in Power BI
Prerequisites
Before you start, make sure you complete the following steps:
- If you don't have an Azure subscription, create a free account.
- Deploy the TollApp event generator to Azure. Use this link to Deploy TollApp Azure Template. Set the
intervalparameter to 1. Use a new resource group for this step. - Create an Azure Synapse Analytics workspace with a Dedicated SQL pool.
- Create a table named
carsummaryby using your Dedicated SQL pool. Run the following SQL script:CREATE TABLE carsummary ( Make nvarchar(20), CarCount int, times datetime ) WITH ( CLUSTERED COLUMNSTORE INDEX ) ;
Use no code editor to create a Stream Analytics job
Locate the resource group where you deployed the TollApp event generator.
Select the Azure Event Hubs namespace.
On the Event Hubs namespace page, select Event Hubs under Entities in the left menu.
Select the
entrystreaminstance.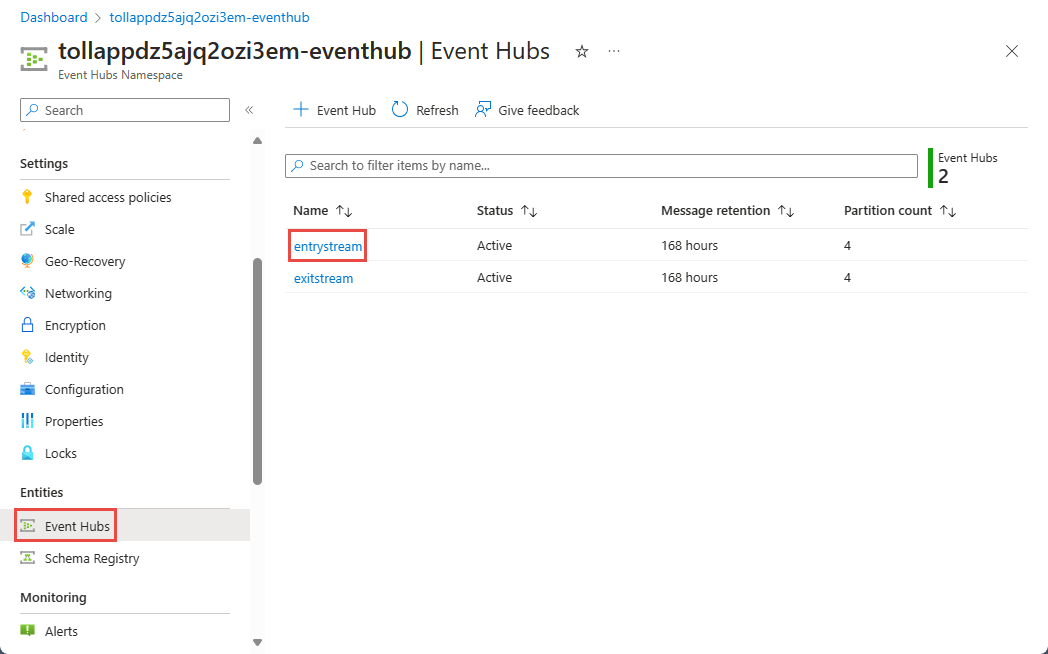
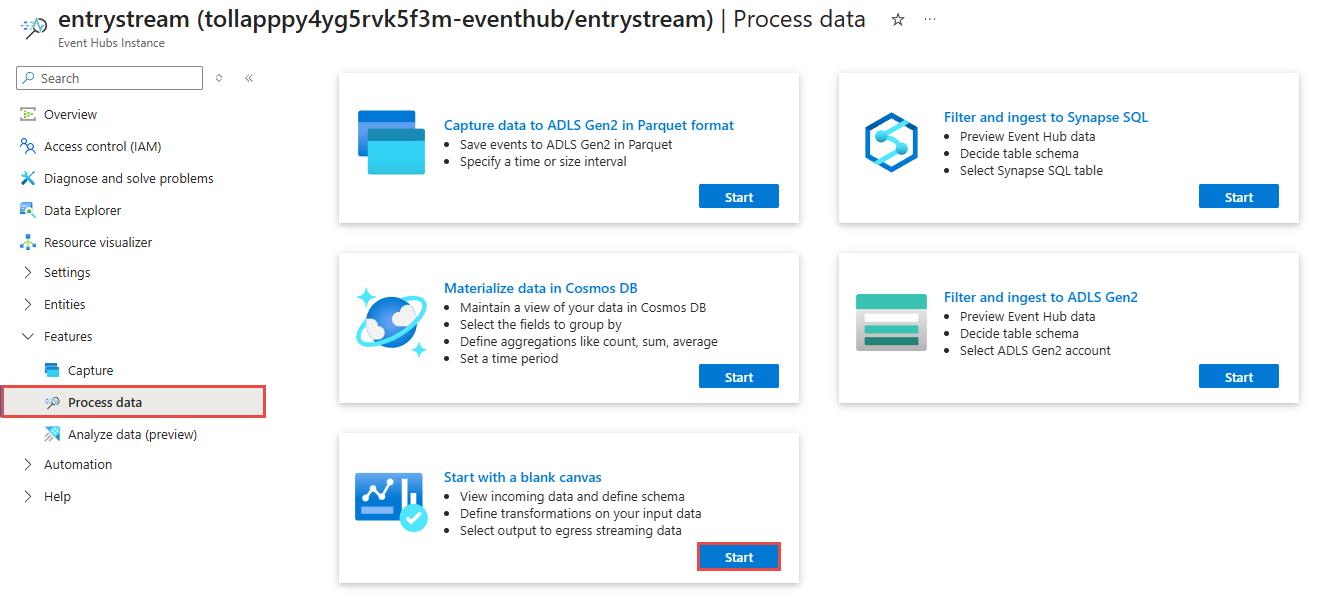
Under the Features section, go to Process data and then select start on the Start with blank canvas template.
Name your job
carsummaryand select Create.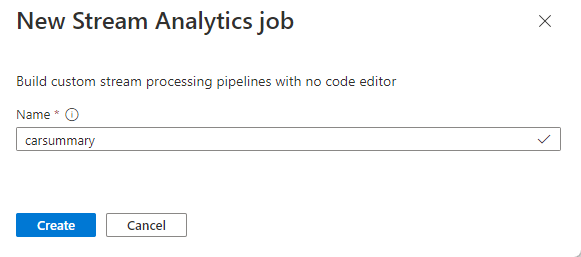
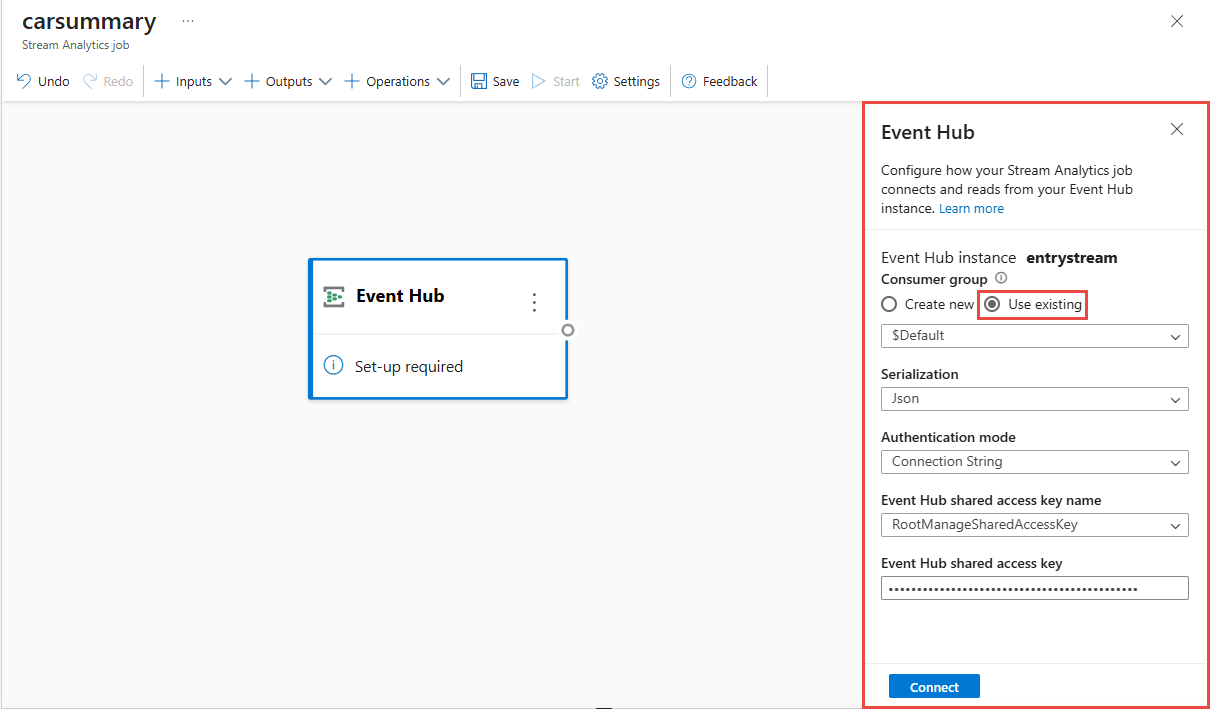
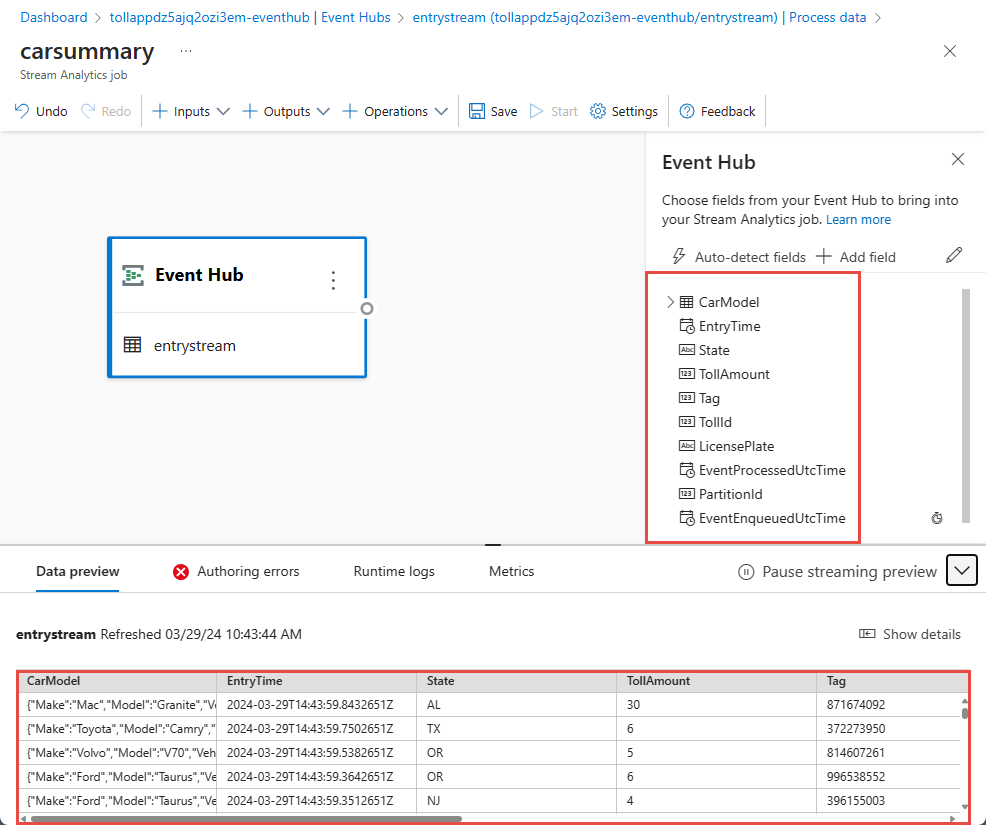
On the event hub configuration page, confirm the following settings, and then select Connect.
For Consumer group, select Use existing, and then select Default.
For Serialization type, confirm that JSON is selected.
For Authentication mode, confirm that Connection String is used to connect to your event hub: Connection string.
Within a few seconds, you see sample input data and the schema. You can choose to drop fields, rename fields, or change data types.
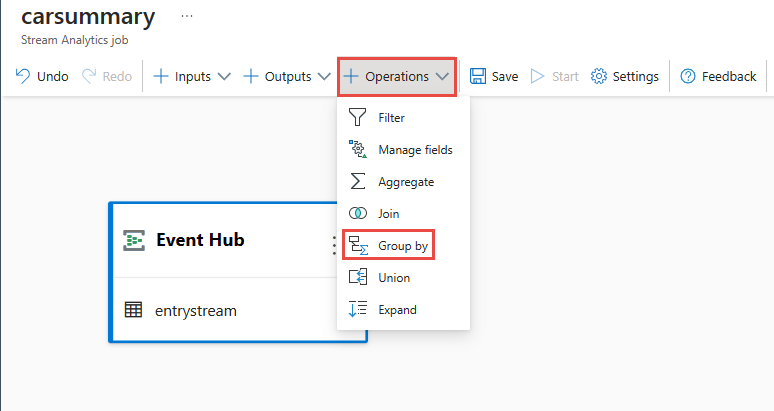
Select Operations on the command bar and then select Group by.
Select the Group by tile on the canvas and connect it to the event hub tile.
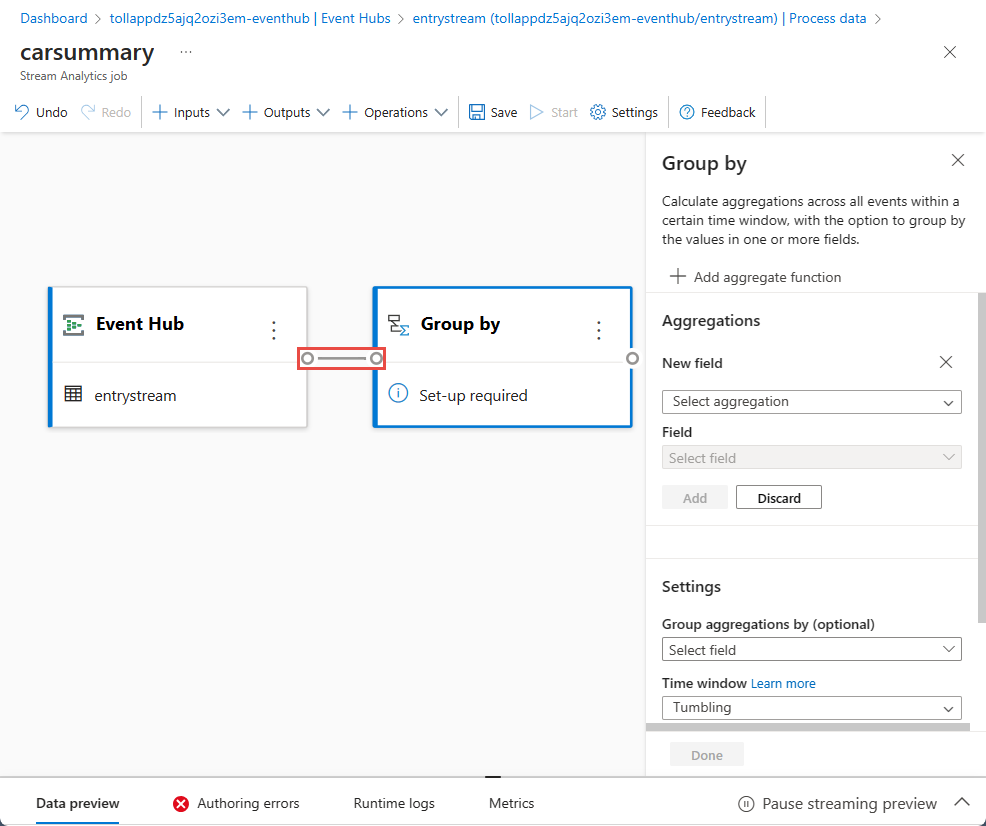
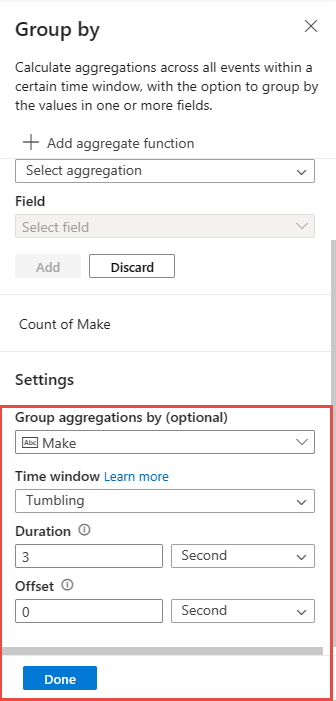
Configure the Group by tile by specifying:
Aggregation as Count.
Field as Make, which is a nested field inside CarModel.
Select Add.
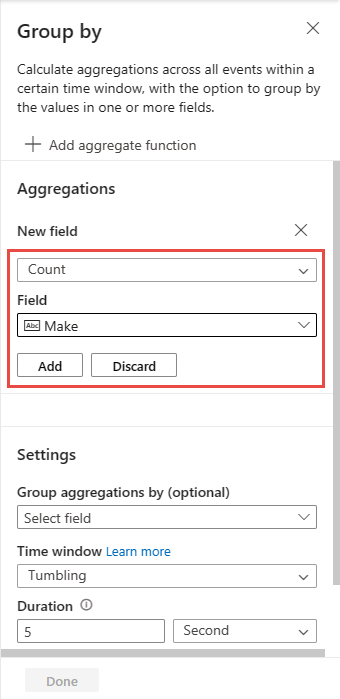
In the Settings section:
For Group aggregations by, select Make.
For Time window, confirm that the value is set to Tumbling.
For Duration, enter 3 minutes.
Select Done at the bottom of the page.
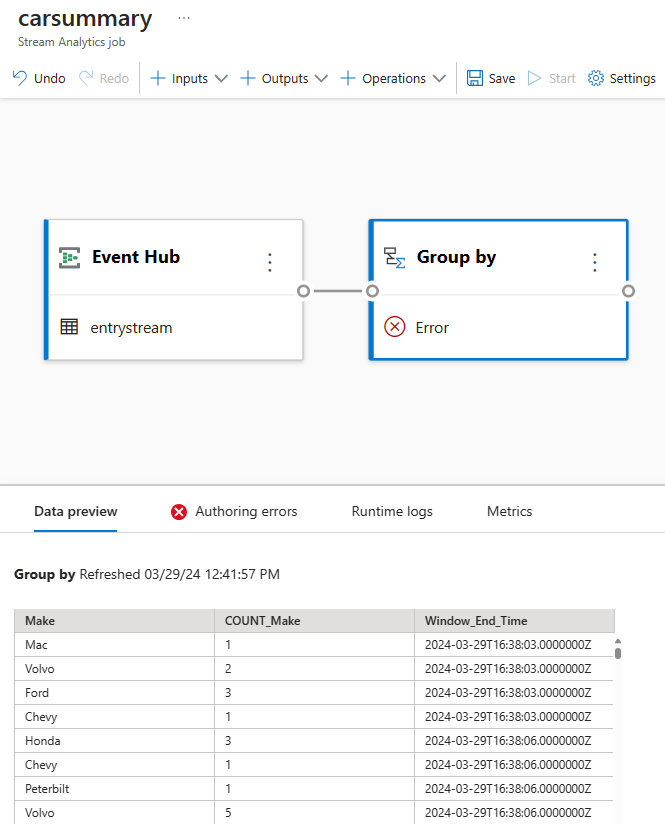
Select Group by, and notice the grouped data in the Data preview tab at the bottom of the page.
On the command bar, select Operations and then Manage fields.
Connect Group by and Manage fields tiles.
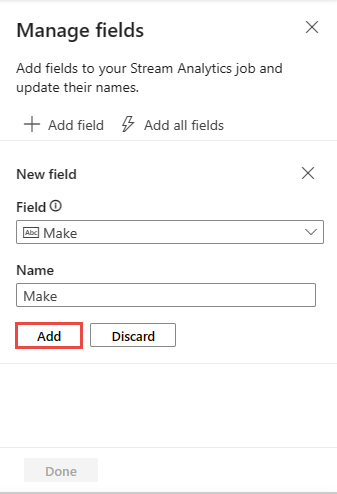
On the Manage fields page, follow these steps:
Add the Make field as shown in the following image, and then select Add.
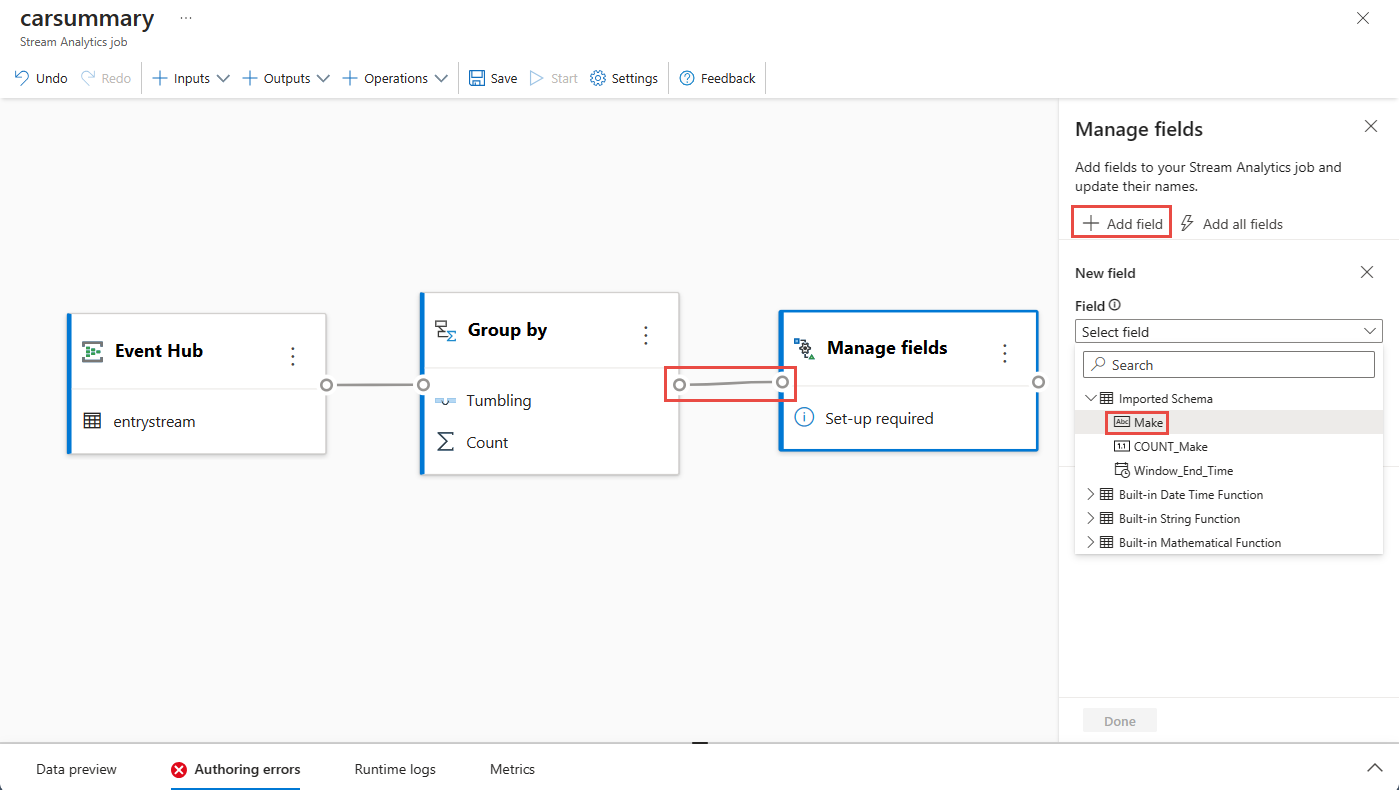
Select Add.
Select Add all fields on the Manage fields configuration page.
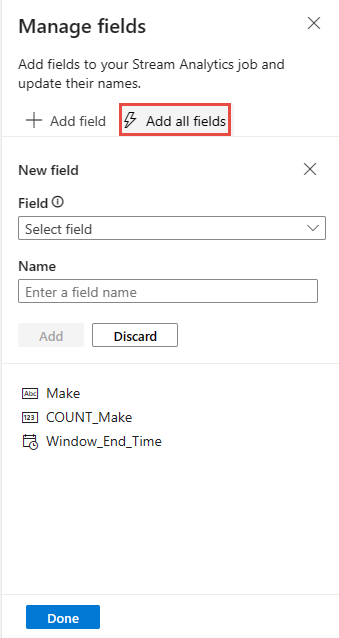
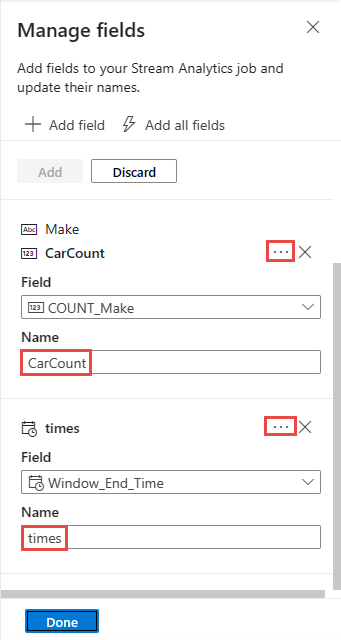
Select ... next to the fields, and select Edit to rename them.
COUNT_make to CarCount
Window_End_Time to times
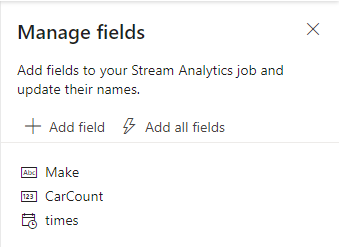
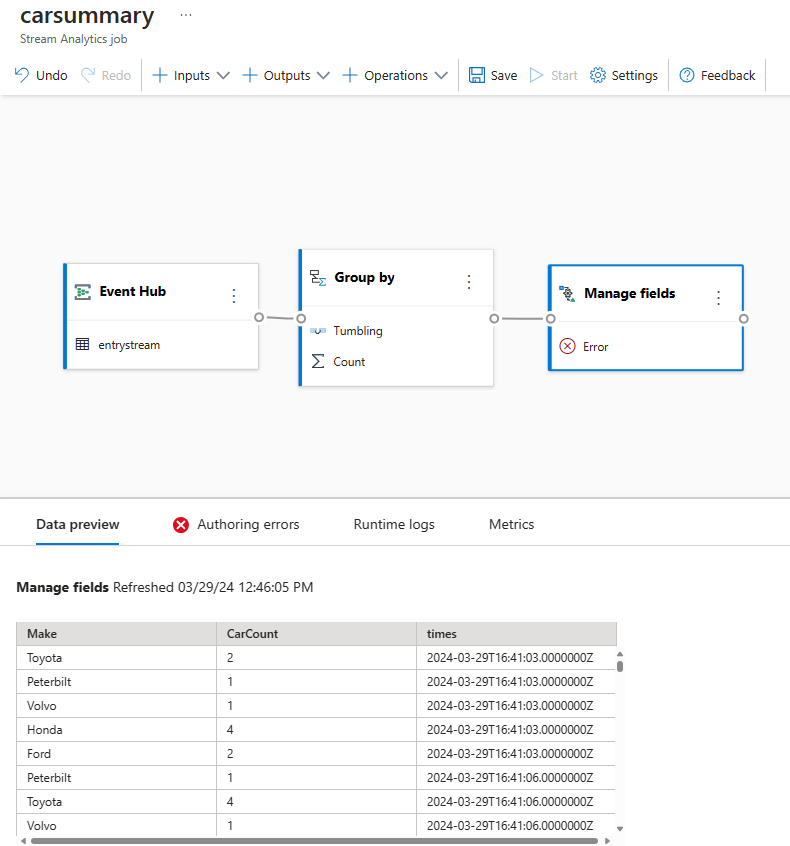
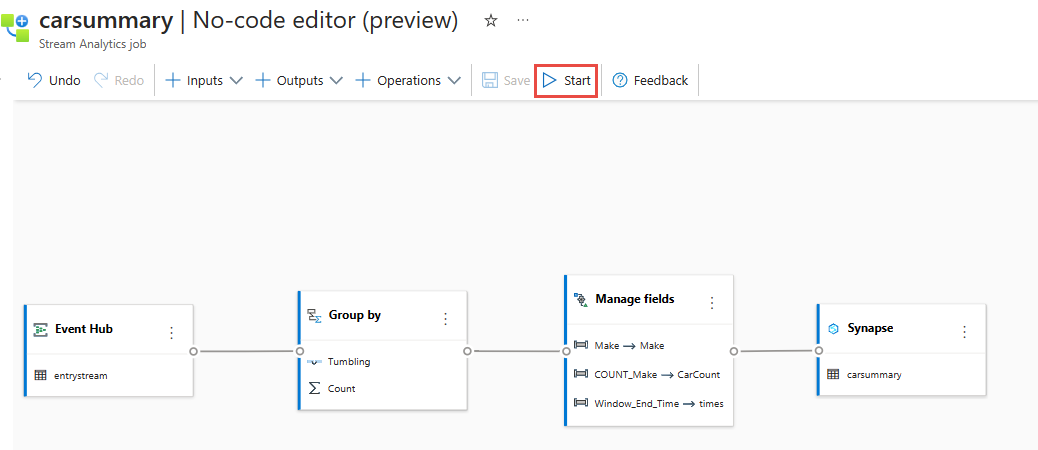
Select Done on the Manage fields page. The Manage fields page should look as shown in the following image.
Select Manage fields tile, and see the data flowing into the operation in the Data preview tab at the bottom of the page.
On the command bar, select Outputs, and then select Synapse.
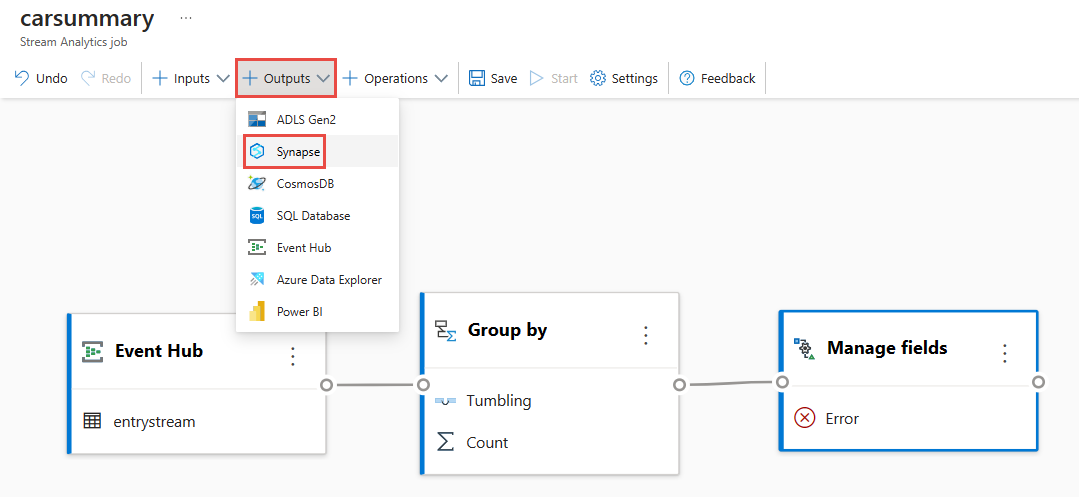
Connect the Synapse tile to the Manage fields tile on your canvas.
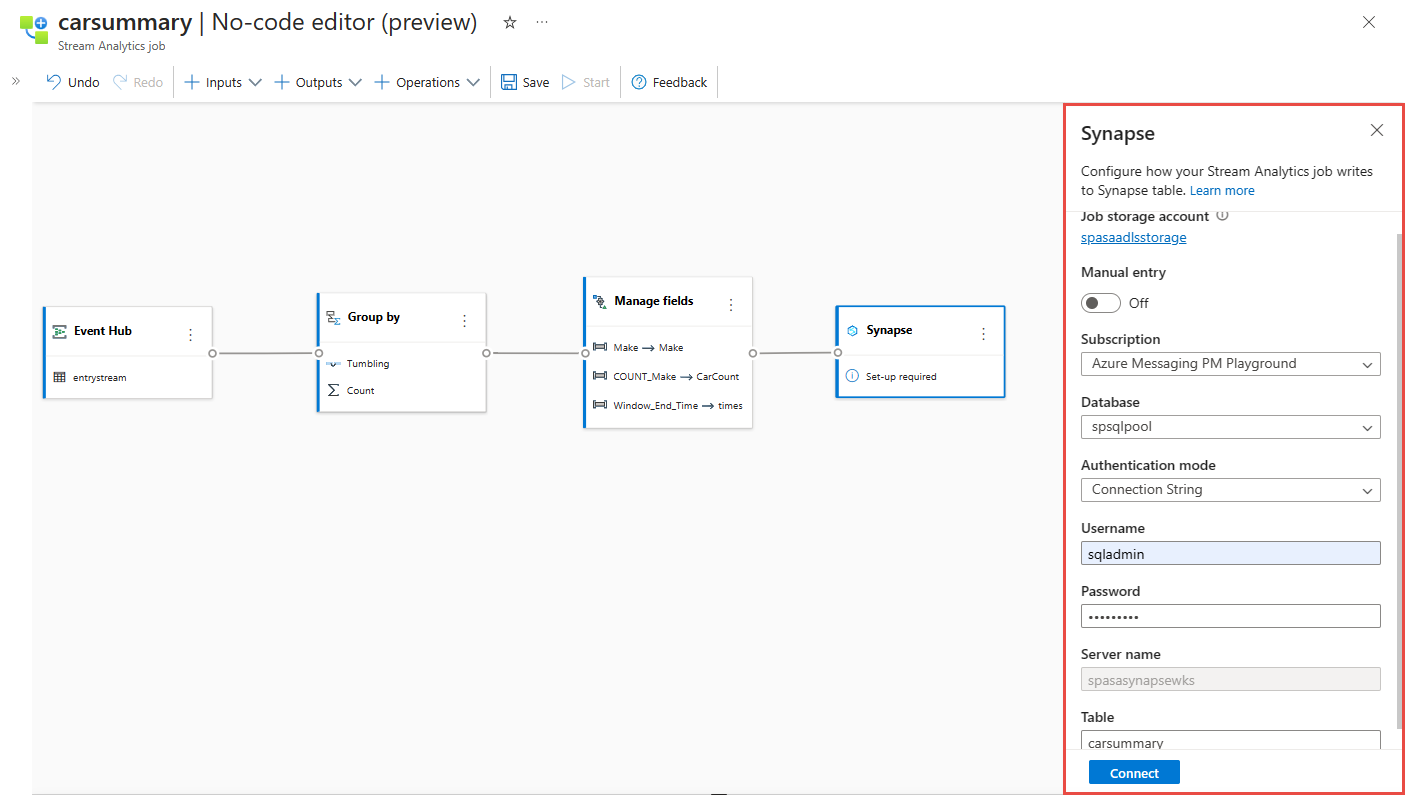
On the Synapse settings page, follow these steps:
If the Job storage account isn't already set, select the Azure Data Lake Storage account in the resource group. It's the storage account that is used by Synapse SQL to load data into your data warehouse.
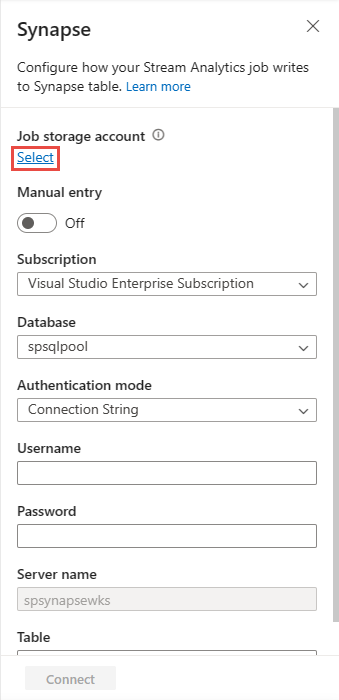
Select the Azure subscription where your Azure Synapse Analytics is located.
Select the database of the Dedicated SQL pool that you used to create the
carsummarytable in the previous section.Enter username and password to authenticate.
Enter table name as
carsummary.Select Connect. You see sample results that are written to your Synapse SQL table.
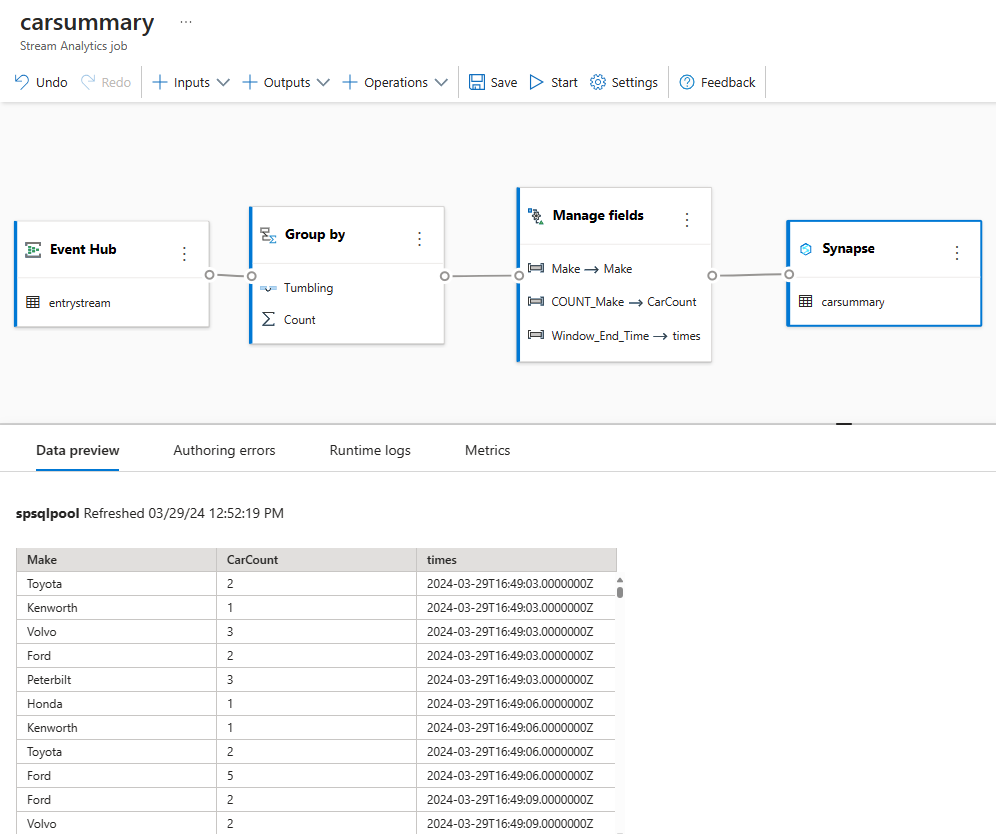
Select Synapse tile and see the Data preview tab at the bottom of the page. You see the data flowing into the dedicated SQL pool.
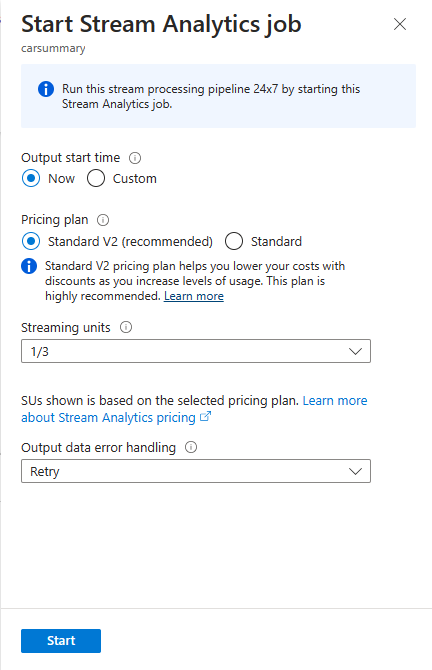
Select Save in the top ribbon to save your job and then select Start.
On the Start Stream Analytics Job page, select Start to run your job.
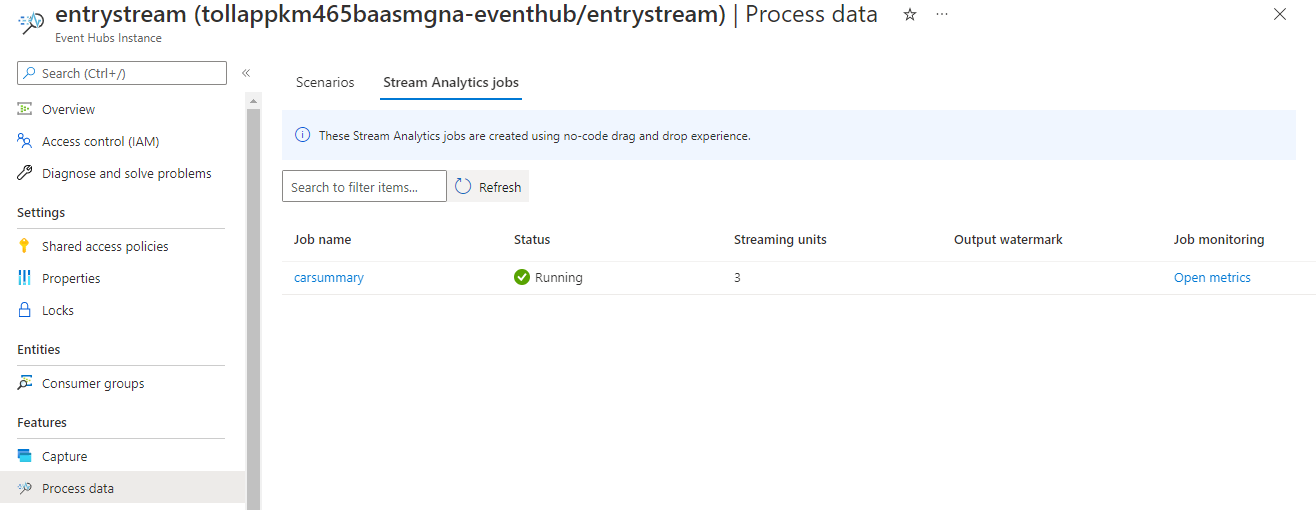
You then see a list of all Stream Analytics jobs created using the no code editor. And within two minutes, your job goes to a Running state. Select the Refresh button on the page to see the status change from Created -> Starting -> Running.


Create a Power BI visualization
Download the latest version of Power BI Desktop.
Use the Power BI connector for Azure Synapse SQL.
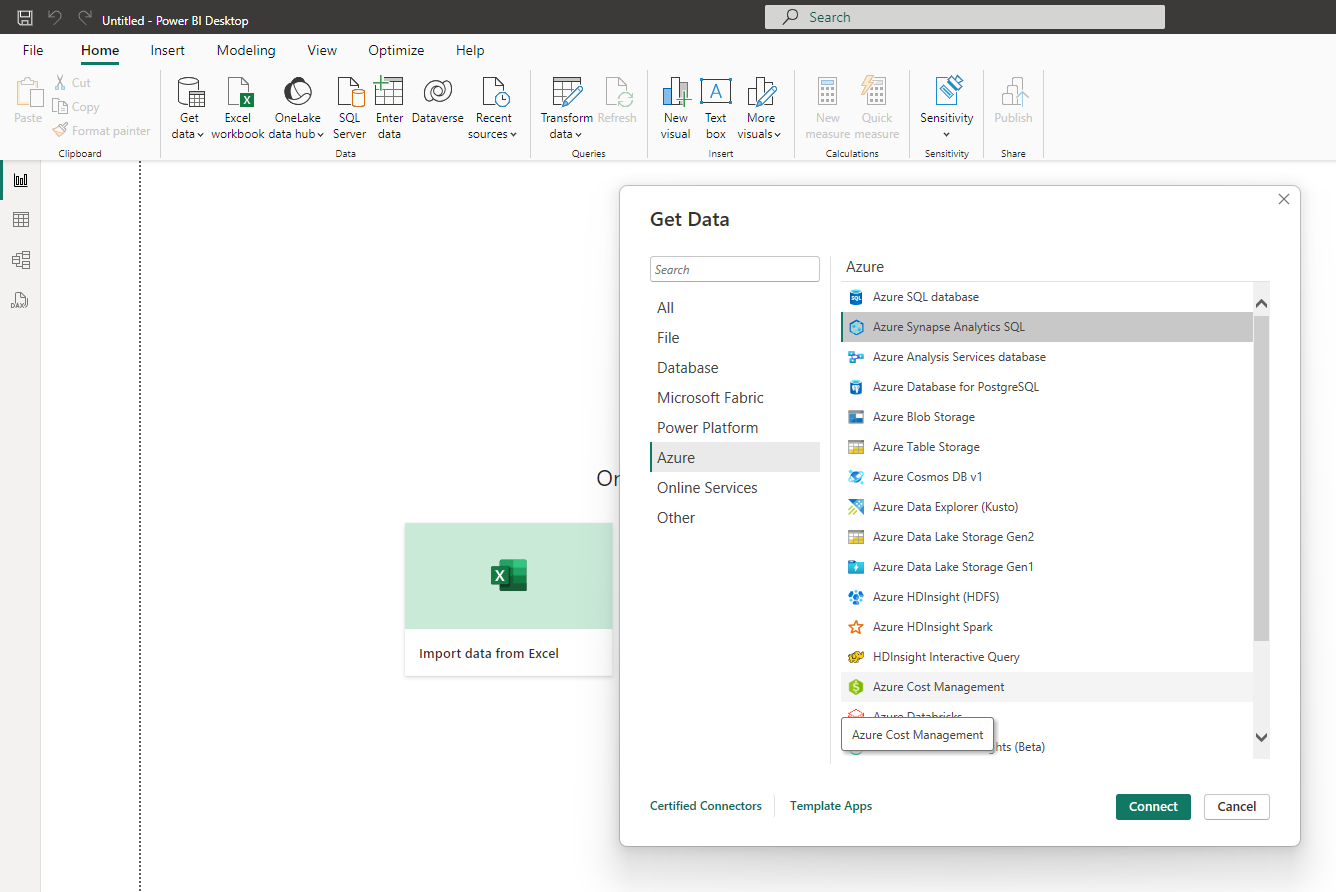
Connect to your database by using DirectQuery, and use this query to fetch data from your database
SELECT [Make],[CarCount],[times]
FROM [dbo].[carsummary]
WHERE times >= DATEADD(day, -1, GETDATE())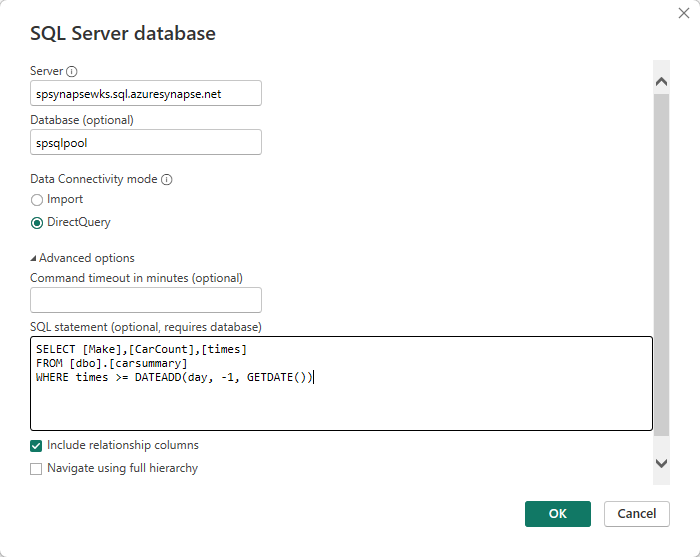
Switch to the Database tab, and enter your credentials (user name and password) to connect to the database and run the query.
Select Load to load data into Power BI.
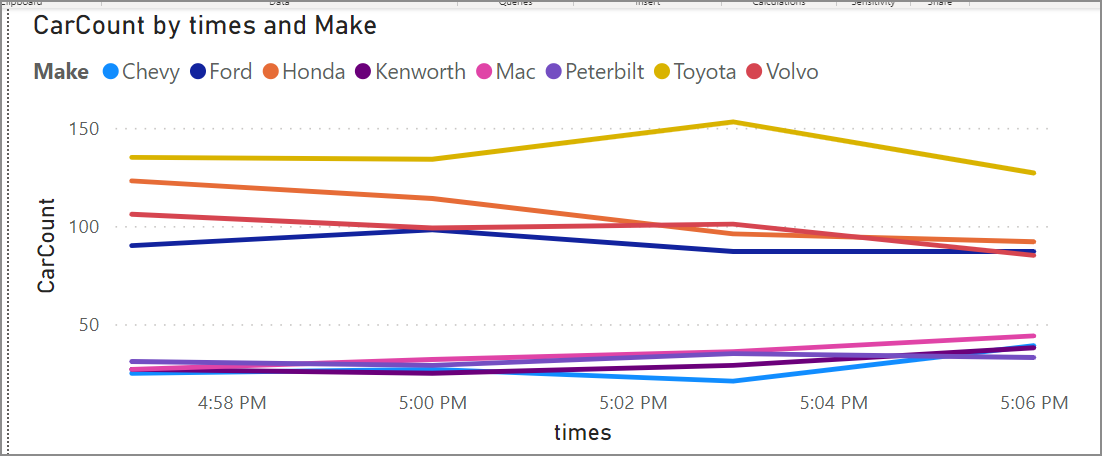
You can then create a line chart with
- X-axis as times
- Y-axis as CarCount
- Legend as Make
You see a chart that you can publish. You can configure automatic page refresh and set it to 3 minutes to get a real-time view.


More options
Besides Azure Synapse SQL, you can also use SQL Database as the no-code editor output to receive the streaming data. Then use the Power BI connector to connect to the SQL Database with your database by using DirectQuery to build the real-time dashboard.
It's also a good option to build the real-time dashboard with your streaming data. For more information about the SQL Database output, see Transform and ingest to SQL Database.
Clean up resources
- Locate your Event Hubs instance and see the list of Stream Analytics jobs under the Process Data section. Stop any running jobs.
- Go to the resource group you used while deploying the TollApp event generator.
- Select Delete resource group. To confirm deletion, type the name of the resource group.
Next steps
In this tutorial, you created a Stream Analytics job by using the no code editor to define aggregations and write results to Azure Synapse Analytics. You then used Power BI to build a real-time dashboard to see the results produced by the job.