Note
Access to this page requires authorization. You can try signing in or changing directories.
Access to this page requires authorization. You can try changing directories.
Microsoft Fabric is an all-in-one analytics solution for enterprises that covers everything from data movement to data science, real-time analytics, and business intelligence. It offers a comprehensive suite of services, including data lake, data engineering, and data integration, all in one place. For more information, see What is Microsoft Fabric?
This tutorial walks you through an end-to-end scenario from data acquisition to data consumption. It helps you build a basic understanding of Fabric, including the different experiences and how they integrate, as well as the professional and citizen developer experiences that come with working on this platform. This tutorial isn't intended to be a reference architecture, an exhaustive list of features and functionality, or a recommendation of specific best practices.
Lakehouse end-to-end scenario
Traditionally, organizations have been building modern data warehouses for their transactional and structured data analytics needs. And data lakehouses for big data (semi/unstructured) data analytics needs. These two systems ran in parallel, creating silos, data duplication, and increased total cost of ownership.
Fabric with its unification of data store and standardization on Delta Lake format allows you to eliminate silos, remove data duplication, and drastically reduce total cost of ownership.
With the flexibility offered by Fabric, you can implement either lakehouse or data warehouse architectures or combine them together to get the best of both with simple implementation. In this tutorial, you're going to take an example of a retail organization and build its lakehouse from start to finish. It uses the medallion architecture where the bronze layer has the raw data, the silver layer has the validated and deduplicated data, and the gold layer has highly refined data. You can take the same approach to implement a lakehouse for any organization from any industry.
This tutorial explains how a developer at the fictional Wide World Importers company from the retail domain completes the following steps:
Sign in to your Power BI account and sign up for the free Microsoft Fabric trial. If you don't have a Power BI license, sign up for a Fabric free license and then you can start the Fabric trial.
Build and implement an end-to-end lakehouse for your organization:
- Create a Fabric workspace.
- Create a lakehouse.
- Ingest data, transform data, and load it into the lakehouse. You can also explore the OneLake, one copy of your data across lakehouse mode and SQL analytics endpoint mode.
- Connect to your lakehouse using the SQL analytics endpoint and create a semantic model and build a report to analyze sales data across different dimensions.
- Optionally, you can orchestrate and schedule data ingestion and transformation flow with a pipeline. Pipelines include Lakehouse-focused activities such as the Lakehouse Maintenance activity (to automate Delta table upkeep with OPTIMIZE and VACUUM) and the Refresh SQL Endpoint activity (to keep the SQL analytics endpoint synchronized after data loads). The pipeline expression builder also includes Copilot assistance for quicker, more accurate expression authoring. For details, see Lakehouse Maintenance activity.
Clean up resources by deleting the workspace and other items.
Architecture
The following image shows the lakehouse end-to-end architecture. The components involved are described in the following list.

Data sources: Fabric makes it quick and easy to connect to Azure Data Services, as well as other cloud-based platforms and on-premises data sources, for streamlined data ingestion.
Ingestion: You can quickly build insights for your organization using more than 200 native connectors. These connectors are integrated into the Fabric pipeline and utilize the user-friendly drag-and-drop data transformation with dataflow. Additionally, with the Shortcut feature in Fabric you can connect to existing data, without having to copy or move it. OneLake shortcuts can also reference data products across tenants through OneLake external data sharing, giving you access to live, governed operational data without copying or building ETL pipelines. Fabric also includes high-performance, vectorized file readers for common formats such as CSV (with JSON support coming) to reduce ingestion latency.
Transform and store: Fabric standardizes on Delta Lake format. Which means all the Fabric engines can access and manipulate the same dataset stored in OneLake without duplicating data. OneLake's unified governance model ensures that data accessed through shortcuts participates in the same security and compliance policies as locally stored data, providing a single version of truth across the organization. This storage system provides the flexibility to build lakehouses using a medallion architecture or a data mesh, depending on your organizational requirement. You can choose between a low-code or no-code experience for data transformation, utilizing either pipelines/dataflows or notebook/Spark for a code-first experience. Lakehouse tables also support performance optimizations such as Z-ordering and Liquid Clustering to improve query performance and manage data layout at scale. Additionally, Materialized Lake Views are available to precompute and cache results over lakehouse data, which speeds up repeated analytics. Operationalization can include automated maintenance of Lakehouse Delta tables via the Lakehouse Maintenance activity in pipelines and triggering a SQL analytics endpoint refresh as part of post-load steps—see the optional pipeline orchestration step in the scenario overview above for details.
Consume: Power BI can consume data from the Lakehouse for reporting and visualization. Each Lakehouse has a built-in TDS endpoint, the SQL analytics endpoint, for easy connectivity and querying of data in the Lakehouse tables from other reporting tools. Pipeline orchestration can include a step to refresh the Lakehouse SQL analytics endpoint to ensure schema and metadata are current for reporting tools after data loads—see the optional pipeline orchestration step in the scenario overview above for details.
Through cross-tenant data sharing, reports, semantic models, and AI/data science workloads can also consume shared OneLake data across organizational boundaries, enabling collaboration without data duplication.
Sample dataset
This tutorial uses the Wide World Importers (WWI) sample database that you import into the lakehouse in the next tutorial. For the lakehouse end-to-end scenario, the dataset includes sufficient data to explore the scale and performance capabilities of the Fabric platform.
Wide World Importers (WWI) is a wholesale novelty goods importer and distributor operating from the San Francisco Bay area. As a wholesaler, WWI's customers mostly include companies who resell to individuals. WWI sells to retail customers across the United States including specialty stores, supermarkets, computing stores, tourist attraction shops, and some individuals. WWI also sells to other wholesalers via a network of agents who promote the products on WWI's behalf. To learn more about their company profile and operation, see Wide World Importers sample databases for Microsoft SQL.
In general, data is brought from transactional systems or line-of-business applications into a lakehouse. However, for simplicity in this tutorial, you use the dimensional model provided by WWI as the initial data source. You ingest the data into a lakehouse and transform it through different stages (Bronze, Silver, and Gold) of a medallion architecture.
Data model
While the WWI dimensional model contains numerous fact tables, this tutorial uses the Sale fact table and its correlated dimensions. The following example illustrates the WWI data model:

Data and transformation flow
As described earlier, this tutorial uses the sample data from Wide World Importers (WWI) sample data to build an end-to-end lakehouse. In this implementation, the sample data is stored in an Azure Data storage account in Parquet file format for all the tables. However, in real-world scenarios, data would typically originate from various sources and in diverse formats.
The following image shows the source, destination, and data transformation:

Data Source: The source data is in Parquet file format and in an unpartitioned structure. It's stored in a folder for each table. In this tutorial, you set up a pipeline to ingest the complete historical or onetime data to the lakehouse.
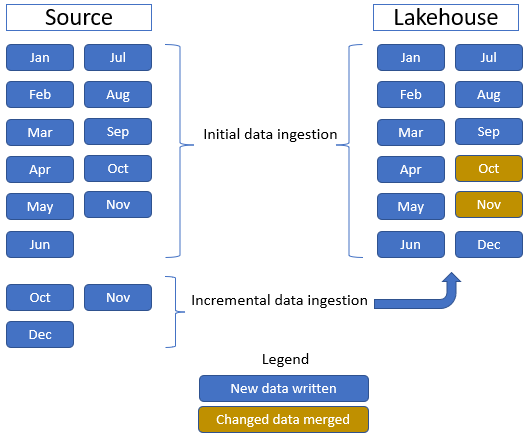
In this tutorial, you use the Sale fact table, which has one parent folder with historical data for 11 months (with one subfolder for each month) and another folder containing incremental data for three months (one subfolder for each month). During the initial data ingestion, 11 months of data are ingested into the lakehouse table. When the incremental data arrives, the updated October and November data is merged with the existing data, and the new December data is written to the lakehouse table as shown in the following image:
Lakehouse: In this tutorial, you create a lakehouse, ingest data into the files section of the lakehouse, and then create delta lake tables in the Tables section of the lakehouse.
Transform: For data preparation and transformation, this tutorial covers two different approaches: notebooks and Spark for a code-first experience, and pipelines and dataflows for a low-code or no-code experience. The latest Fabric runtime includes a native execution engine that delivers significant performance improvements over open-source Spark for notebook and Spark job workloads. The pipeline expression builder includes Copilot assistance to help author expressions and build pipeline logic for quicker, more accurate expression generation.
Consume: Power BI can consume data from the lakehouse for reporting and visualization. Each lakehouse has a built-in TDS endpoint called the SQL analytics endpoint for easy connectivity and querying of data in the lakehouse tables from other reporting tools. You can also use Direct Lake over OneLake to let Power BI query lakehouse tables directly without import or a dedicated semantic model refresh cycle. Additionally, you can make your data available to non-Microsoft reporting tools by using the TDS/SQL analytics endpoint to connect and run SQL queries for analytics.
For Spark SQL workloads specifically, ODBC-compatible clients can connect using the Microsoft ODBC Driver for Microsoft Fabric Data Engineering (Preview) with Microsoft Entra ID authentication (interactive, Azure CLI, service principal, certificate, or access token).
