ESG data estate (preview)
![]() Microsoft Cloud for Sustainability - Free trial
Microsoft Cloud for Sustainability - Free trial

Important
Some or all of this functionality is available as part of a preview release. The content and the functionality are subject to change.
The ESG data estate (preview) capability allows you to combine ESG data from various sources into a standard schema that provides data models for environmental, social, and governance records. You can then use the standardized data to compute quantitative metrics that meet disclosure reporting requirements, such as Corporate Sustainability Reporting Directive (CSRD). You can also use aggregated datasets in analytics. External applications can access the aggregated datasets for other scenarios, such as data audits and CSRD report generation.
The items deployed in this capability include notebooks and data lakes that transform, compute, and store data from its raw form to computed ESG metrics based on standardized ESG data models.
This solution deploys these four data lakes:
Ingested Raw Data: Stores raw data from external data sources.
Processed ESG Data: Stores harmonized data conforming to a standardized ESG data model.
Computed ESG Metrics: Stores computed ESG metrics and aggregated analytical datasets.
ConfigAndDemoData: Stores certain transformation libraries, reference, and demo data.
All resources that this solution deploys are prebuilt and deployed into your Fabric workspace. The resources are open, and you can customize them to meet your needs.
ESG data estate (preview) includes the following features:
Import and transform Sustainability Manager data
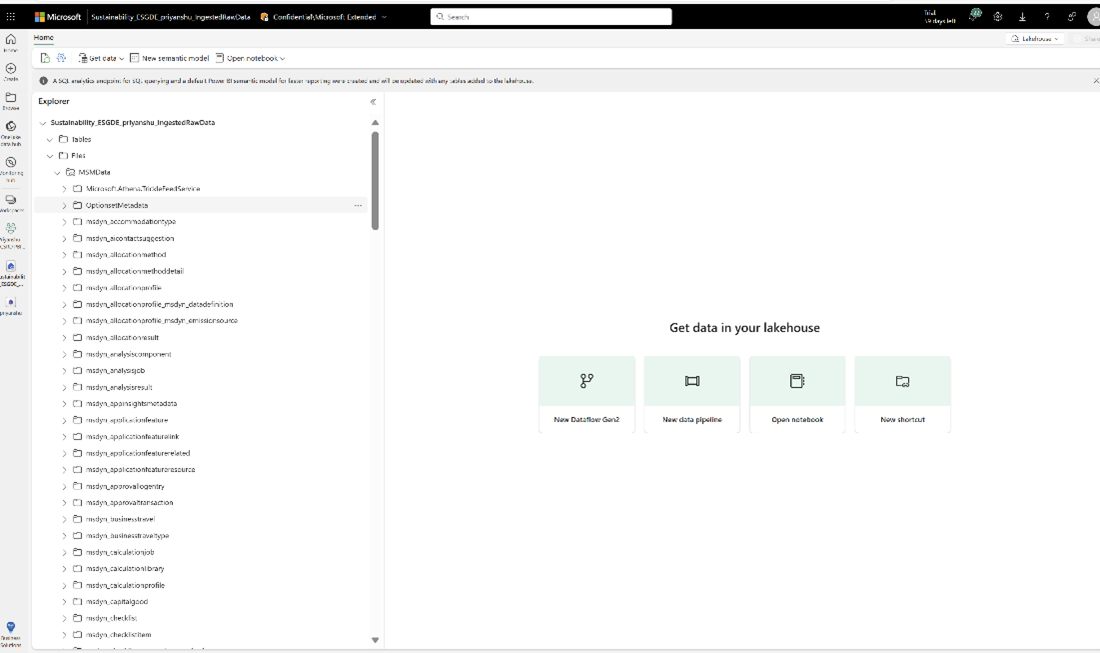
You can bring data from disparate data sources to your ESG data estate. This capability deploys the IngestedRawData lakehouse, or data lake, in your Fabric workspace. This lakehouse stores the source data as is.
After the source data integrates with the IngestedRawData lakehouse, you can unify and harmonize the data into the Microsoft Cloud for Sustainability ESG data model schema.
This capability also deploys demo data to your Fabric workspace. This demo data is present in the ESG data model schema, so you can directly load the demo data for exploring the capability.
These steps show you how to integrate emissions, water, and waste data from Sustainability Manager and transform it into the ESG data model schema. Then you can use the transformed data for computing analytical datasets and metrics.
Prerequisites
Deploy ESG data estate (preview) in your Fabric workspace.
You should have Microsoft Sustainability Manager installed and set up in your Dataverse environment.
You should have an Azure Data Lake Storage Gen2 storage account.
You must have the Dataverse system administrator security role.
You must have an Azure Data Lake Storage Gen2 account and Owner and Storage Blob Data Contributor role access. Your storage account must enable hierarchical namespace for both initial setup and delta sync. Allow storage account key access is required only for the initial setup.
Step 1: Set up Azure Synapse Link
In this step, you set up an Azure Synapse Link for the Sustainability Manager environment from which you want to bring data into the ESG data estate.
Open the Power Apps portal. On the top right, select your Dataverse environment that has Sustainability Manager installed.
Select Azure Synapse Link from the left pane and select New link. If it doesn't already appear, select More, select Discover all, select Data Management, and then select Azure Synapse Link.
Leave Connect to your Azure Synapse Analytics workspace unchecked. You run the integration and transformation scripts on Fabric, not Synapse.
Enter your storage account and subscription details and select Next. You can only select a storage account located in the same location as your environment. For example, if your environment is in the West US, your storage account should be in West US or West US2.
Select all your Sustainability Manager tables from the list and select Save. You can filter by msdyn_ to view the relevant tables.
An Azure Synapse Link to your storage account is created, and the selected tables are exported to the storage account. You can add or remove the tables in the link by going back to Azure Synapse Link, selecting the link you created, and then selecting Manage tables.
Open your Data Lake Storage Gen2 account that was provided while creating the link in prior steps. A new container starting with Dataverse- is created in your storage account with all the selected tables exported in folder structure in CSV format along with a model.json file that contains the schema for all the tables. Your Sustainability Manager data is now available in your own storage account.
Step 2: Link the Data Lake Storage container
In this step, you link the Data Lake Storage container with Sustainability Manager data to the IngestedRawData lakehouse of the deployed capability using the Fabric shortcut functionality.
Open the workspace in Fabric in which you deployed the Sustainability solution. To open the solution, select it from the list view. Select the ESG data estate (preview) capability from the Manage deployed capabilities list view to reach managed capability page.
From the ESG data estate managed capability page, select the IngestedRawData lakehouse.
Select New shortcut from the ellipses menu of Files. In the New shortcut dialog box, select the Azure Data Lake Storage Gen2 tile, and then provide the following connection details to connect to the Data Lake Storage container that has the exported Sustainability Manager data.
- URL: Go to the Data Lake Storage account and from the left blade select Endpoint. Then copy the end point for Data Lake Storage and paste it in the URL field.
- Connection: Select Create new connection.
- Authentication kind: Select Organization account, sign in to your Data Lake Storage account, and then select Next.
For the shortcut name, enter MSMData, set the sub path as the container name that contains the Sustainability Manager data prefixed with /, and then select Create. The Sustainability Manager data is successfully integrated with the data lake under Files.

Step 3: Transform data
After the Sustainability Manager data integrates into the IngestedRawData lakehouse, unify and harmonize the data by transforming it into the ESG data model schema. During deployment, ProcessedESGData lakehouse was created in the workspace for storing the harmonized data.
The ESG data model schema covers ESG data entities. They link to other data entities that describe other functional areas of a company, such as HR, IT, or finance production.
For transforming Sustainability Manager data to Cloud for Sustainability ESG data model schema, the capability provides notebooks that use prebuilt transformation technologies provided as libraries stored in the ConfigAndDemoData lakehouse in your workspace.
Important
Don't change any files in the ConfigAndDemoData folder, because the transformation logic for Sustainability Manager data might not work.
Load the linked Sustainability Manager data as tables. The transformation libraries require the source data to be in delta table format. You can run the LoadMSMDataToIngestedRawDataLakehouseTables notebook. This notebook loads the linked Sustainability Manager data to lakehouse tables. After you run the notebook successfully, you can validate the data in IngestedRawData lakehouse tables.
Load reference data in the ProcessedESGData lakehouse tables. Reference data refers to tables that are mostly static like unit of measure or country/region.
Currently the Sustainability Manager reference data in the ESG data model schema is deployed as part of the ESG data estate capability. You can view the reference data files from the Reference Data folder in the ConfigAndDemoData lakehouse. Run the LoadReferenceTables notebook for loading the reference data to ProcessedESGData lakehouse tables.
Transform Sustainability Manager data to Cloud for Sustainability ESG data model schema.
Run the following notebooks in sequence.
Note
You should run the second notebook only if the first one runs successfully.
- TransformMSMDataToProcessedESGDataStage1
- TransformMSMDataToProcessedESGDataStage2
Note
This preview version only supports full snapshot refresh of Sustainability Manager data and not incremental delta data refresh. The prebuilt transformation notebooks deployed with the capability also support only full snapshot refresh. We recommend that Azure Synapse link is kept in in place update mode. If you update other data into the tables populated by the notebooks in the last step and then run them, the data is overwritten. Also, don't modify the content of the transformation notebooks and the underlying libraries. If the notebooks or underlying libraries are modified, then transformation of Sustainability Manager data to the ESG data model schema might not work correctly.
External data ingestion and transformation
You can integrate your data from disparate sources into the IngestedRawData lakehouse using Fabric ingestion capabilities such as data pipelines and data flows.
After you integrate your data, you can transform it to the ESG data model schema using Fabric dataflows, or you can build and run notebooks.
Before you build the transformation logic, you can explore the ESG data model schema by using these artifacts, which are deployed in the workspace during the ESG data estate deployment.
ESGschema.json: This file provides the schema of the tables in the Cloud for Sustainability ESG data model including details around columns, primary key, and foreign key relationships for each table. This file is stored in the Config folder of the ConfigAndDemoData lakehouse.
GenerateESGTables: This notebook provides the create table function. You can use this table to create empty Cloud for Sustainability ESG data model tables for a sustainability area such as water, waste, and greenhouse gas (GHG) emissions.
Follow these steps to transform GHG emissions, water quantity, or waste generated data to the Cloud for Sustainability ESG data model schema. Then you can generate the metrics supported by the prebuilt metric generation notebooks.
Ensure that your source data works with the reference data (static data, such unit of measure, country/region, or water utilization type) in the reference data folder of the ConfigAndDemoData lakehouse. The prebuilt notebooks for generating analytical datasets and metrics use values from the reference data.
Map your source data to the following set of Cloud for Sustainability ESG data model tables. In this step, you use Fabric capabilities, such as dataflows or build and run notebooks. Then use the TransformMSMDataToProcessedESGDataStage2 notebook to further transform the data to Cloud for Sustainability ESG data model tables.
Area Table Water Asset CalculationAlgorithm Facility LegalEntity Location Party PartyBusinessMetric PartyOrganization RelatedParty Standard StandardVersion WaterRisk WaterUtilizationRawDataImport Waste Asset CalculationAlgorithm Facility LegalEntity Location Party PartyBusinessMetric PartyOrganization RelatedParty Standard StandardVersion WasteCategory WasteMaterialType WasteStream WasteQuantityRawDataImport GHG emissions Asset CalculationAlgorithm Facility GreenhouseGasEmissionFactor LegalEntity Location Party PartyBusinessMetric PartyOrganization RelatedParty Standard StandardVersion EmissionsRawDataImport To transform social data to the ESG data model schema, you use Fabric capabilities such as dataflows or build and run notebooks. To use the prebuilt notebook to generate analytical datasets and metrics for social data, map source data to these tables in the Cloud for Sustainability ESG data model schema.
Area Table Social Incident IncidentType IncidentRelatedParty Party PartyType PartyBusinessMetric MetricPurpose BusinessMetric Party PartyType EmployeeRelatedParty Employee Gender EmployeeLocation Location Country PartyHealthSafetyTrainingMetric HealthSafetyTrainingMetricType MetricPurpose EventType PartyEvent This list helps you to compute the metrics that are predefined in the capability. If you want to compute other metrics, you might need to map other tables to the ESG data model schema. You can explore the ESG data model schema to figure out the other tables to map.
Compute analytical datasets and metrics
After you standardize the data, you can create an ESG metrics mesh that consists of aggregated data sets and computed CSRD metrics that are ready for analytics and reporting. In this preview version, the computation logic for certain CSRD quantitative metrics across ESG is predefined and provided with the ESG data estate capability. You can extend and update these notebooks as required for defining other metrics and for modifying the computation logic for the already defined metrics.
Note
Aggregated data sets are denormalized aggregated datasets that have facts stored along various dimensions such as reporting year, facility, country, or organization unit. In this preview version, the reporting year definition only supports calendar year.
Prerequisites
Ensure that your data is transformed to the ESG data model schema for the sustainability areas for which you want to compute analytical data sets and CSRD metrics. If you want to explore the functionality, you can also load the demo data into the ProcessedESGData lakehouse and use that for computing metrics.
GHG emissions
Run the CreateEmissionFactTables notebook. This notebook aggregates the processed emissions data in the Cloud for Sustainability ESG data model schema into aggregated datasets and stores them as parquet files in the computedESGMetrics lakehouse. After the notebook runs successfully, the EmissionsData and NetRevenueData fact tables should appear in the ESG fact tables folder under Files in the ComputedESGMetrics lakehouse.
Run the GenerateEmissionsMetricTables notebook. This notebook generates the quantitative metrics from the aggregated datasets for GHG emissions that are part of the European Sustainability Reporting Standards (ESRS) E1 standard of CSRD. After the notebook runs successfully, computed metrics data is stored as tables in the ComputedESGMetrics lakehouse.
This notebook computes the following metrics:
- Gross scope 1 GHG emissions (E1_6_41_a)
- Gross scope 2 GHG emissions (E1_6_41_b)
- Gross scope 3 GHG emissions (E1_6_41_c)
- Total GHG emissions (E1_6_41_d)
- Total GHG emissions per net revenue (E1_6_50)
- Net revenue (E1_6_52)
Water
Run the CreateWaterFactTables notebook. This notebook aggregates the processed water usage data in the Cloud for Sustainability ESG data model schema into aggregated datasets and stores them as parquet files in the computedESGMetrics lakehouse. After the notebook runs successfully, the WaterUtilizationData and NetRevenueData datasets should appear in the ESG fact tables folder under Files in the ComputedESGMetrics lakehouse.
Run the GenerateWaterMetricTables notebook. This notebook generates the quantitative metrics from aggregated datasets for the water sustainability area that are part of the ESRS E3 standard of CSRD. After the notebook runs successfully, the computed metrics data is stored as tables in the ComputedESGMetrics lakehouse.
This notebook computes the following metrics:
- Total water consumption (E3_4_1_a)
- Total water consumption in areas of material water risk (E3_4_1_b)
- Total water recycled (E3_4_2_a)
- Water consumption revenue intensity (E3_4_3)
Waste
Run the CreateWasteFactTables notebook. This notebook aggregates the processed waste data in the Cloud for Sustainability ESG data model schema into aggregated datasets and stores them as parquet files in the computedESGMetrics lakehouse. After the notebook runs successfully, the TotalWasteGeneratedData dataset should appear in the ESG fact tables folder under Files in the ComputedESGMetrics lakehouse.
Run the GenerateWasteMetricTables notebook. This notebook generates the quantitative metrics from the aggregated dataset for the waste sustainability area that are part of ESRS E5 standard of CSRD. After the notebook runs successfully, computed metrics data is stored as tables in the ComputedESGMetrics lakehouse.
This notebook computes the following metrics:
- Total waste generated (E5_5_3_a)
- Waste by stream (E5_5_4_a)
- Total hazardous and radioactive waste (E5_5_5)
- Total nonrecycled waste (E_5_3_d)
Social and governance
Run the CreateSocialGovernanceFactTables notebook. This notebook aggregates the processed social data in the Cloud for Sustainability ESG data model schema into fact tables and stores them as parquet files in the computedESGMetrics lakehouse. After the notebook runs successfully, the required aggregated datasets are created in the ESG fact tables folder under Files in the ComputedESGMetrics lakehouse.
Run the GenerateSocialGovernanceMetricTables notebook. This notebook generates the quantitative metrics from aggregated datasets for the social and governance sustainability area that are part of ESRS 2 and ESRS S1 standards of CSRD. After the notebook runs successfully, the computed metrics data is stored as tables in the ComputedESGMetrics lakehouse.
This notebook computes the following metrics:
- Board's gender diversity (ESRS2_GOV_1_19_d)
- Percentage of independent board members (ESRS2_GOV_1_19_e)
- Number of fatalities(S1_14_84_b)
- Rate of work-related accidents (S1_14_84_c)
- Number of days lost to injuries, accidents, fatalities, or illness (S1_14_84_e)
- Gender pay gap (S1_16_92_a)
- Excessive CEO pay ratio (S1_16_92_b)
- Incidents of discrimination (S1_17_98_a)
- Violations of United Nations Global Compact (UNGC) principles and OECD (S1_17_99_a)
- Percentage of employees participated in regular performance and career development reviews(S1_13_80_a)
- Average number of training hours per person for employees (S1_13_80_b)
- Total number of employees (S1_6_51_a)
Note
This preview version only supports full snapshot refresh of Sustainability Manager data and not incremental delta data refresh. The prebuilt transformation notebooks deployed with the capability also support only full snapshot refresh. Also, if you update other data into those tables populated by these notebooks and then run them, the data is overwritten.
Visualize data and analytics
After the metrics are computed and stored as tables, you can use the prebuilt Power BI dashboard to explore the CSRD metrics, perform drill downs, or view year-over-year comparisons. These actions help you to validate whether the data is good for reporting.
Open the CSRDMetricsReportDataset semantic model from your workspace or from the ESG data estate capability detail page.
On the top left, select your file, and then select Settings. In the Data source credentials section, Select Edit credentials.
Provide your Fabric credentials in the dialog box for authenticating the ComputedESGMetrics lakehouse data source. Select the following values:
- Authentication method: OAuth2
- Privacy level setting for this data source: Organizational
Select Sign in.
After you successfully sign, go back to the semantic model home page and select Refresh now from the Refresh menu option. After the refresh completes, the dataset is refreshed with data from the ComputedESGMetrics lakehouse.
If there are any errors in the refresh, you can find the error details by viewing the Refresh history option under the Refresh menu.
Open CSRDMetricsReport from the ESG data estate capability page or from your workspace. The report should appear with various tabs such as emissions, waste, waste, and social.
Note
Data appears only for metrics that have data in the ComputedESGMetrics lakehouse.
Publish metrics data for downstream application consumption
You can filter, aggregate the metrics data present in the ComputedESGMetrics lakehouse tables and publish required subsets, or metric extracts, as JSON files. Downstream applications can then access these metric extracts for various scenarios like ESG data audits and CSRD report generation with Microsoft OneLake APIs. For example, Compliance Manager can access them to audit metrics for CSRD disclosures.
Prerequisite: For this step, ensure that metrics data is available as tables in the ComputedESGMetrics lakehouse.
As part of the capability deployment, these notebooks are available in your workspace for generating metric extracts along with required metadata for the prebuilt metrics supported by the capability:
CreateEmissionsMetricsForSpecificReportingYear_INTB: Run this notebook for generating the metric extracts and metadata for the prebuilt GHG emission metrics. Specify the reporting year for filtering the metrics data for the specified year and specify the organizational unit for aggregating the metrics data for the specified organizational unit.
To specify the organizational unit, you need to provide the PartyOrganizationPartyId. You can access this information from the PartyOrganizationData dataset that is created in the files section of the ComputedESGMetrics lakehouse while computing other aggregated datasets for the GHG emissions area. This dataset stores the organization unit name and the PartyOrganizationPartyId mapping.
CreateWaterMetricsForSpecificReportingYear_INTB: Run this notebook for generating the metric extracts and metadata for the prebuilt water metrics. This notebook filters and publishes water metric extract for a specific reporting year.
CreateWasteMetricsForSpecificReportingYear notebook_INTB: Run this notebook for generating the metric extracts and metadata for the prebuilt waste metrics. This notebook filters and publishes water metric extract for a specific reporting year.
CreateSocialGovernanceMetricsForSpecificReportingYear_INTB: Run this notebook for generating the metric extracts and metadata for the prebuilt social and governance metrics. This notebook filters and publishes social and governance metric extracts for a specific reporting year.
Note
In this preview version, the reporting year definition only supports calendar year. Also, by default, the metric extract filters the data for the specified reporting year and two prior reporting years as comparative year data. The metadata.json file is a single metadata file that has metadata for all the metric extracts. The metadata file captures details required for accessing and mapping the metrics data against the disclosure requirements (or improvement actions) in Compliance Manager’s CSRD assessment via the connector. The metadata file captures the following details for each metric extract.
| Metadata | Description |
|---|---|
| columns | Mapping of column names to column display names. |
| disclosureRequirements | Mapping of a metric extract to the disclosure requirement, or improvement action name, in the CSRD template (preview) in Compliance Manager. You can map more than one improvement action to a metric extract if the same metric extract’s data needs to be updated against the improvement actions. |
| generatedTimestamp | Timestamp of generating the metric extract. |
| metricExtractDataPath | The file path of the metric extract file within the reporting year folder. |
| metricExtractName | The name of the metric extract file. |
To generate metric extracts for a custom metric, follow these steps:
Ensure you generate the metrics data and stored it as table in the computedESGMetrics lakehouse.
Follow the pattern specified in the prebuilt notebooks (such as CreateEmissionsMetricsForSpecificReportingYear_INTB or CreateWaterMetricsForSpecificReportingYear_INTB) for generating the metric extract JSON file and for adding the metadata of the metric extract in the metadata.json file.
To map the metric extract to the CSRD disclosure requirement, go to the CSRD template (preview) in Compliance Manager and map the relevant valid improvement action name from the CSRD template.
After you generate the metric extracts, perform these steps to allow audit of metrics data for CSRD disclosures via Compliance Manager:
Create a Sustainability data solutions (preview) connector instance in Purview. The connector instance pulls metrics extract data from the lakehouse of Sustainability data solutions in Microsoft Fabric (preview) via OneLake APIs.
Create a CSRD assessment in Compliance Manager. Link the connector instance to the assessment to update the disclosure requirement (improvement action) with metric extract data pulled by the connector instance from Sustainability data solutions in Fabric (preview).

