Note
Access to this page requires authorization. You can try signing in or changing directories.
Access to this page requires authorization. You can try changing directories.
Dataflows are a self-service, cloud-based, data preparation technology. In this article, you create your first dataflow, get data for your dataflow, then transform the data and publish the dataflow.
Prerequisites
The following prerequisites are required before you start:
- A Microsoft Fabric tenant account with an active subscription. Create a free account.
- Make sure you have a Microsoft Fabric enabled Workspace: Create a workspace.
Create a dataflow
In this section, you're creating your first dataflow.
Note
As of April 2026, all new Dataflow Gen2 items are created with CI/CD and Git integration support by default. The option to create Dataflow Gen2 items without CI/CD support is no longer available. Existing non-CI/CD dataflows continue to work.
Navigate to your Microsoft Fabric workspace by navigating to the Microsoft Fabric portal, select Workspaces from the left-hand navigation pane, and then select your workspace from the list.
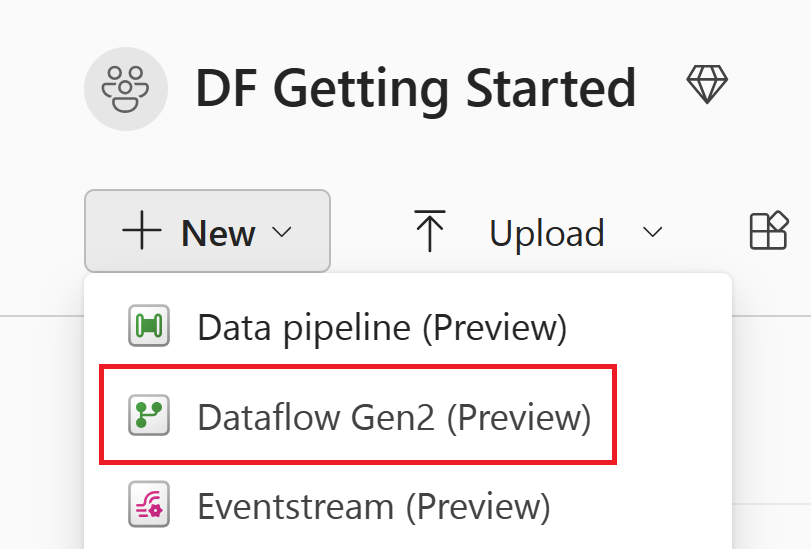
Select +New item, and then select Dataflow Gen2.
Get data
Let's get some data! In this example, you're getting data from an OData service. Use the following steps to get data in your dataflow.
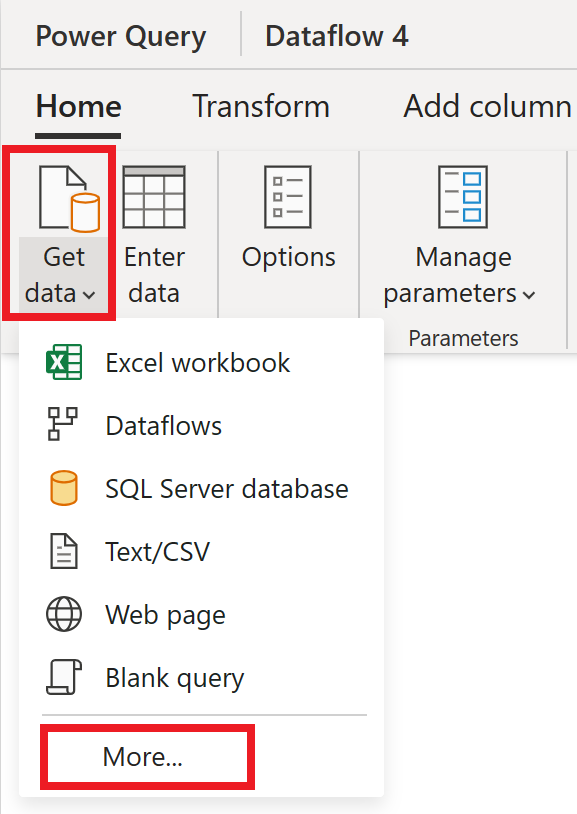
In the dataflow editor, select Get data and then select More.
In Choose data source, select View more.

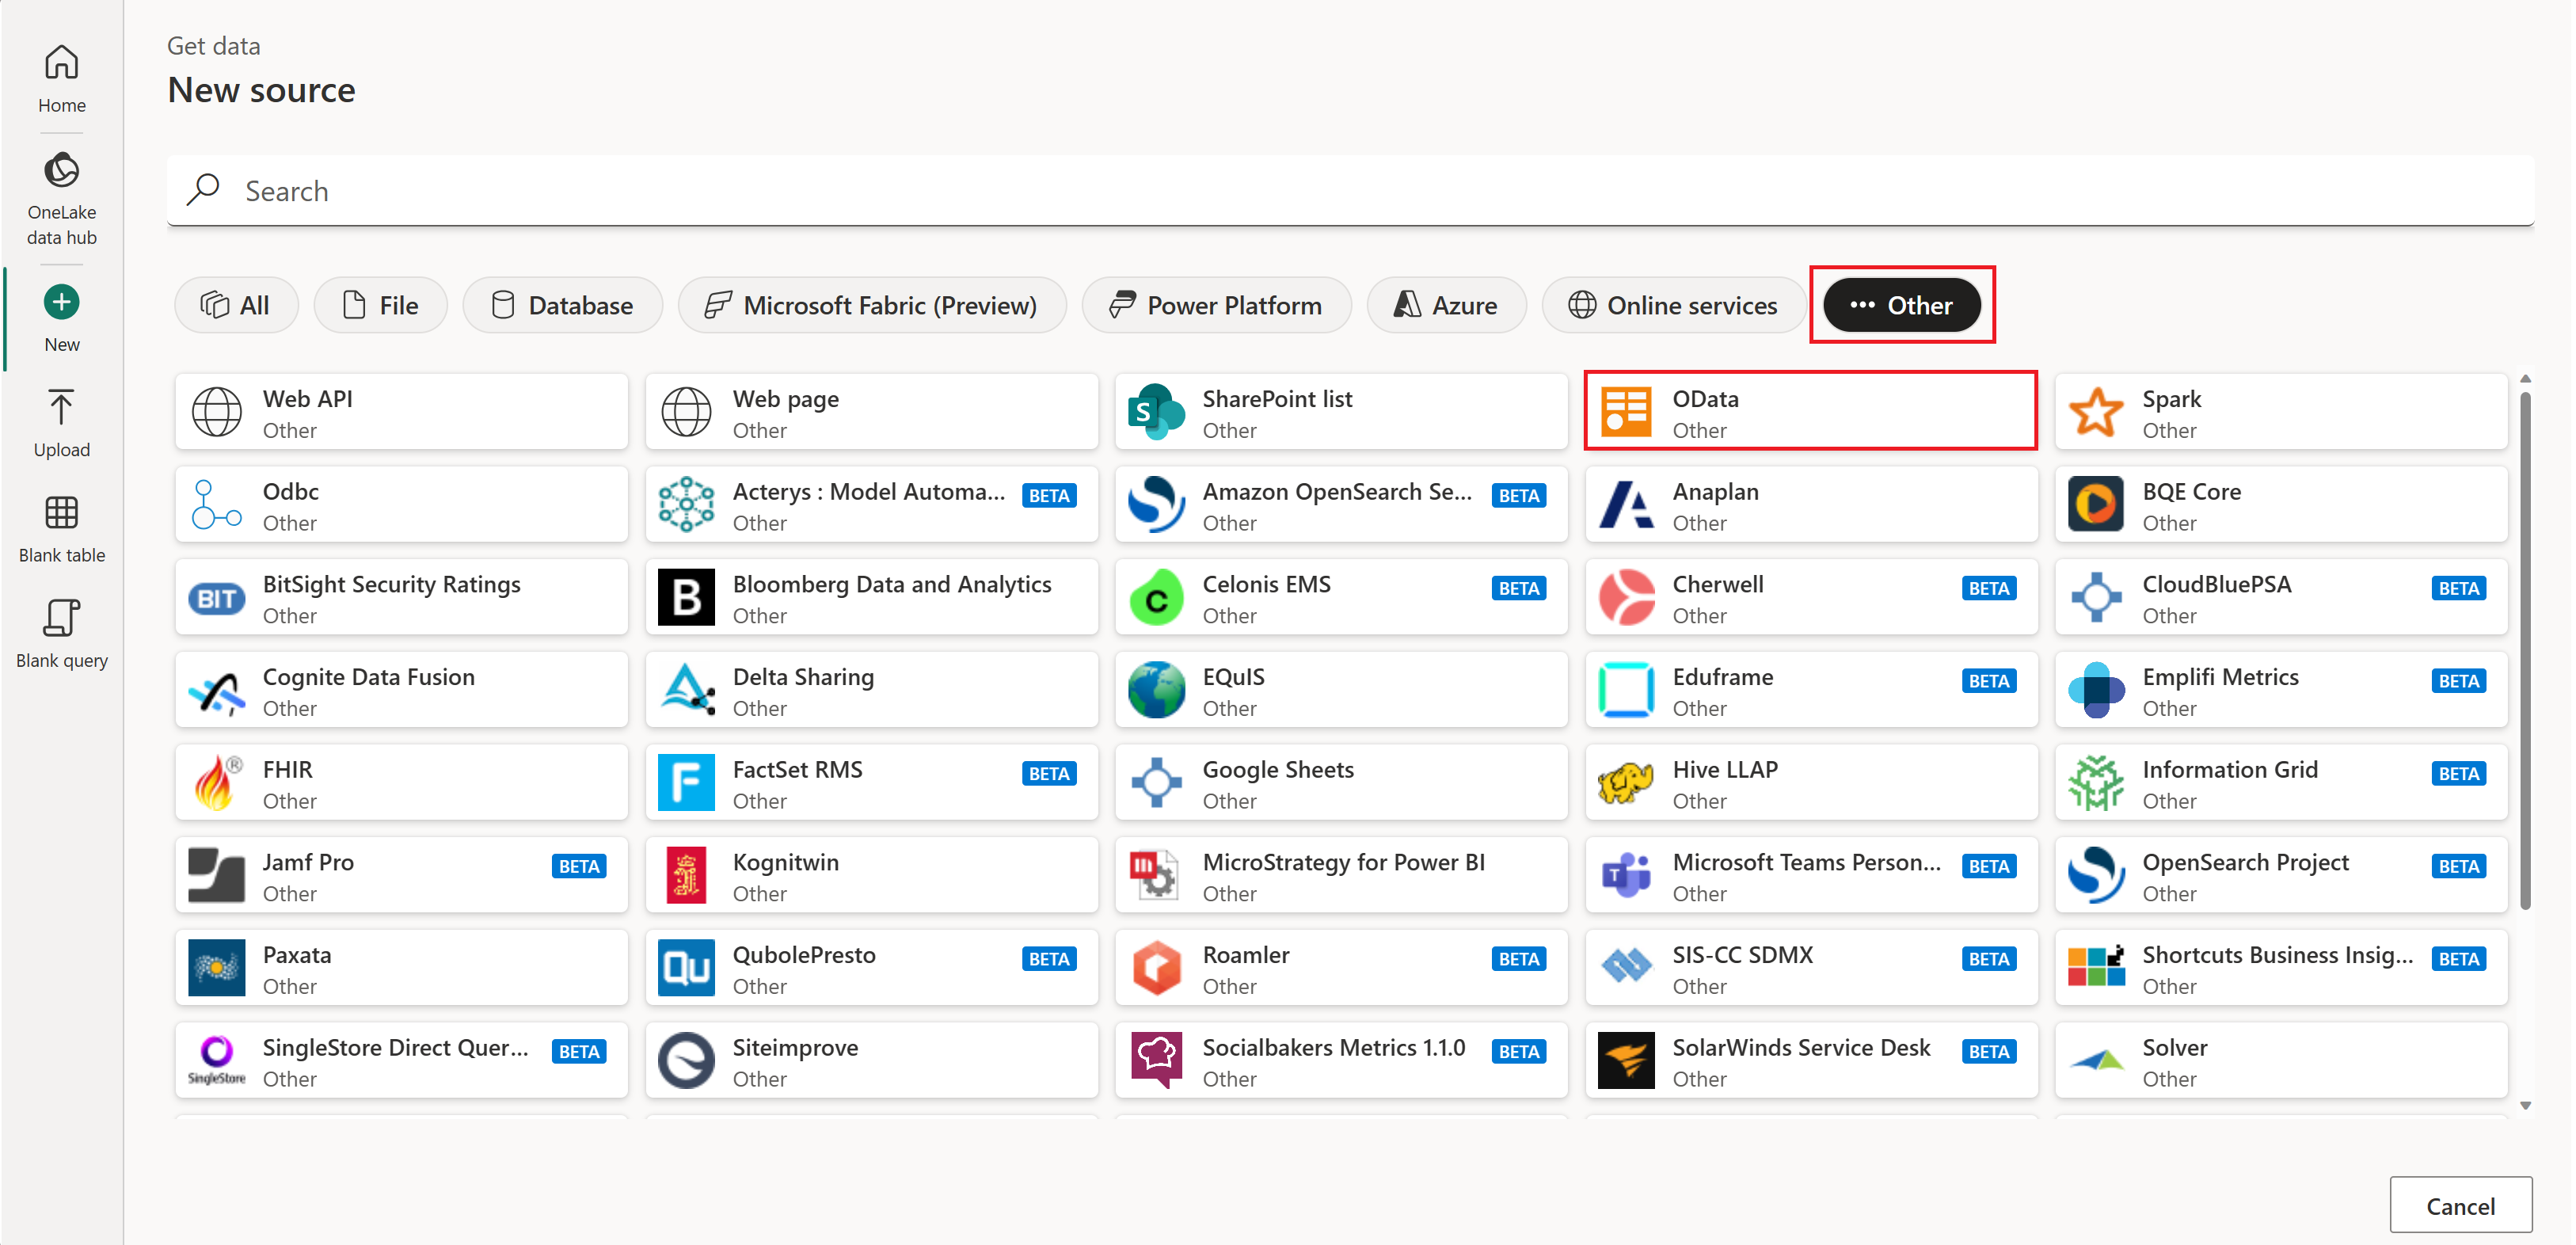
In New source, select Other > OData as the data source.
Enter the URL
https://services.odata.org/v4/northwind/northwind.svc/, and then select Next.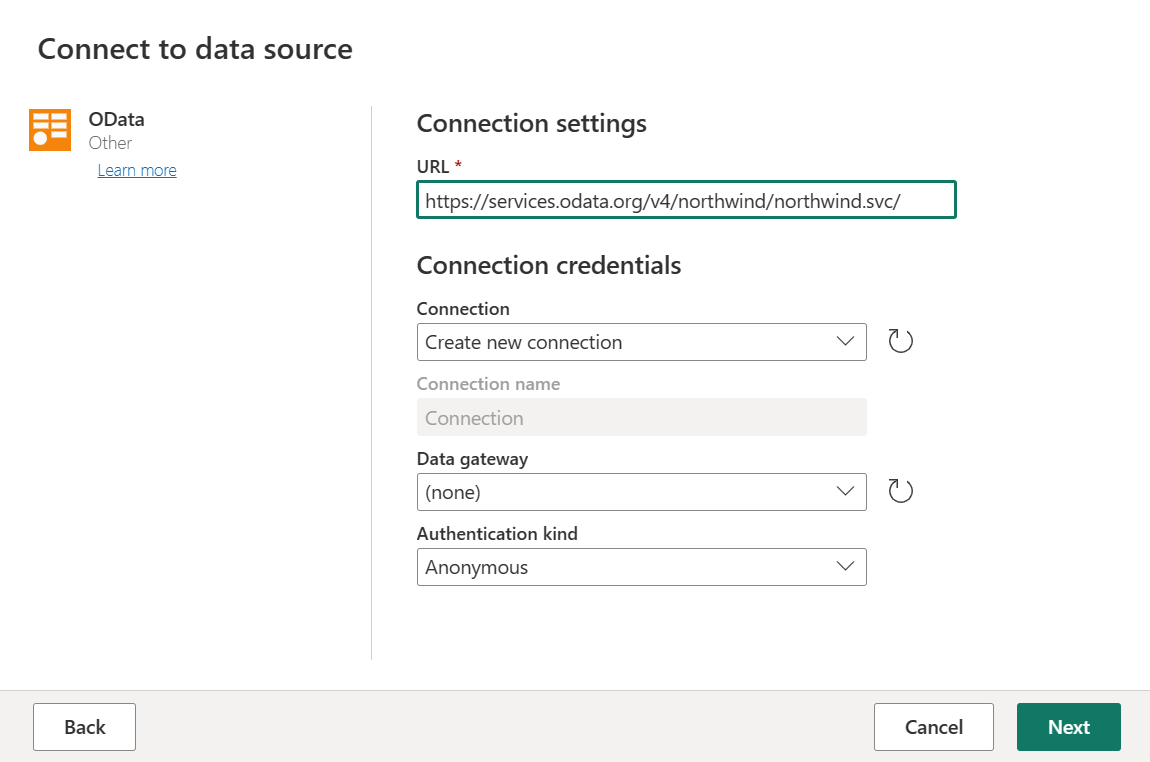
Select the Orders and Customers tables, and then select Create.


You can learn more about the get data experience and functionality in the get data overview.
Apply transformations and publish
You loaded your data into your first dataflow. Congratulations! Now it's time to apply a couple of transformations to bring this data into the shape we need.
You transform the data in the Power Query editor. You can find a detailed overview of the Power Query editor at The Power Query user interface, but this section takes you through the basic steps:
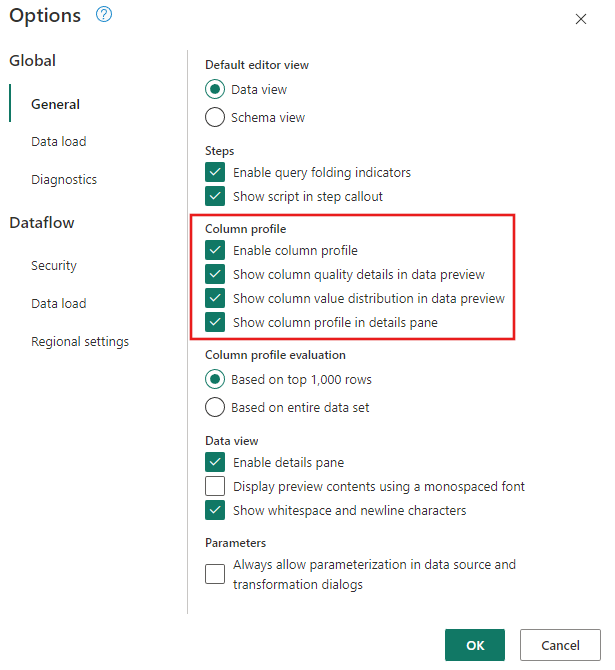
Make sure the Data Profiling tools are turned on. Go to Home > Options > Global Options, then select all the options under Column profile.
Also make sure you enable the diagram view using the Layout configurations under the View tab in the Power Query editor ribbon, or by selecting the diagram view icon on the lower right side of the Power Query window.
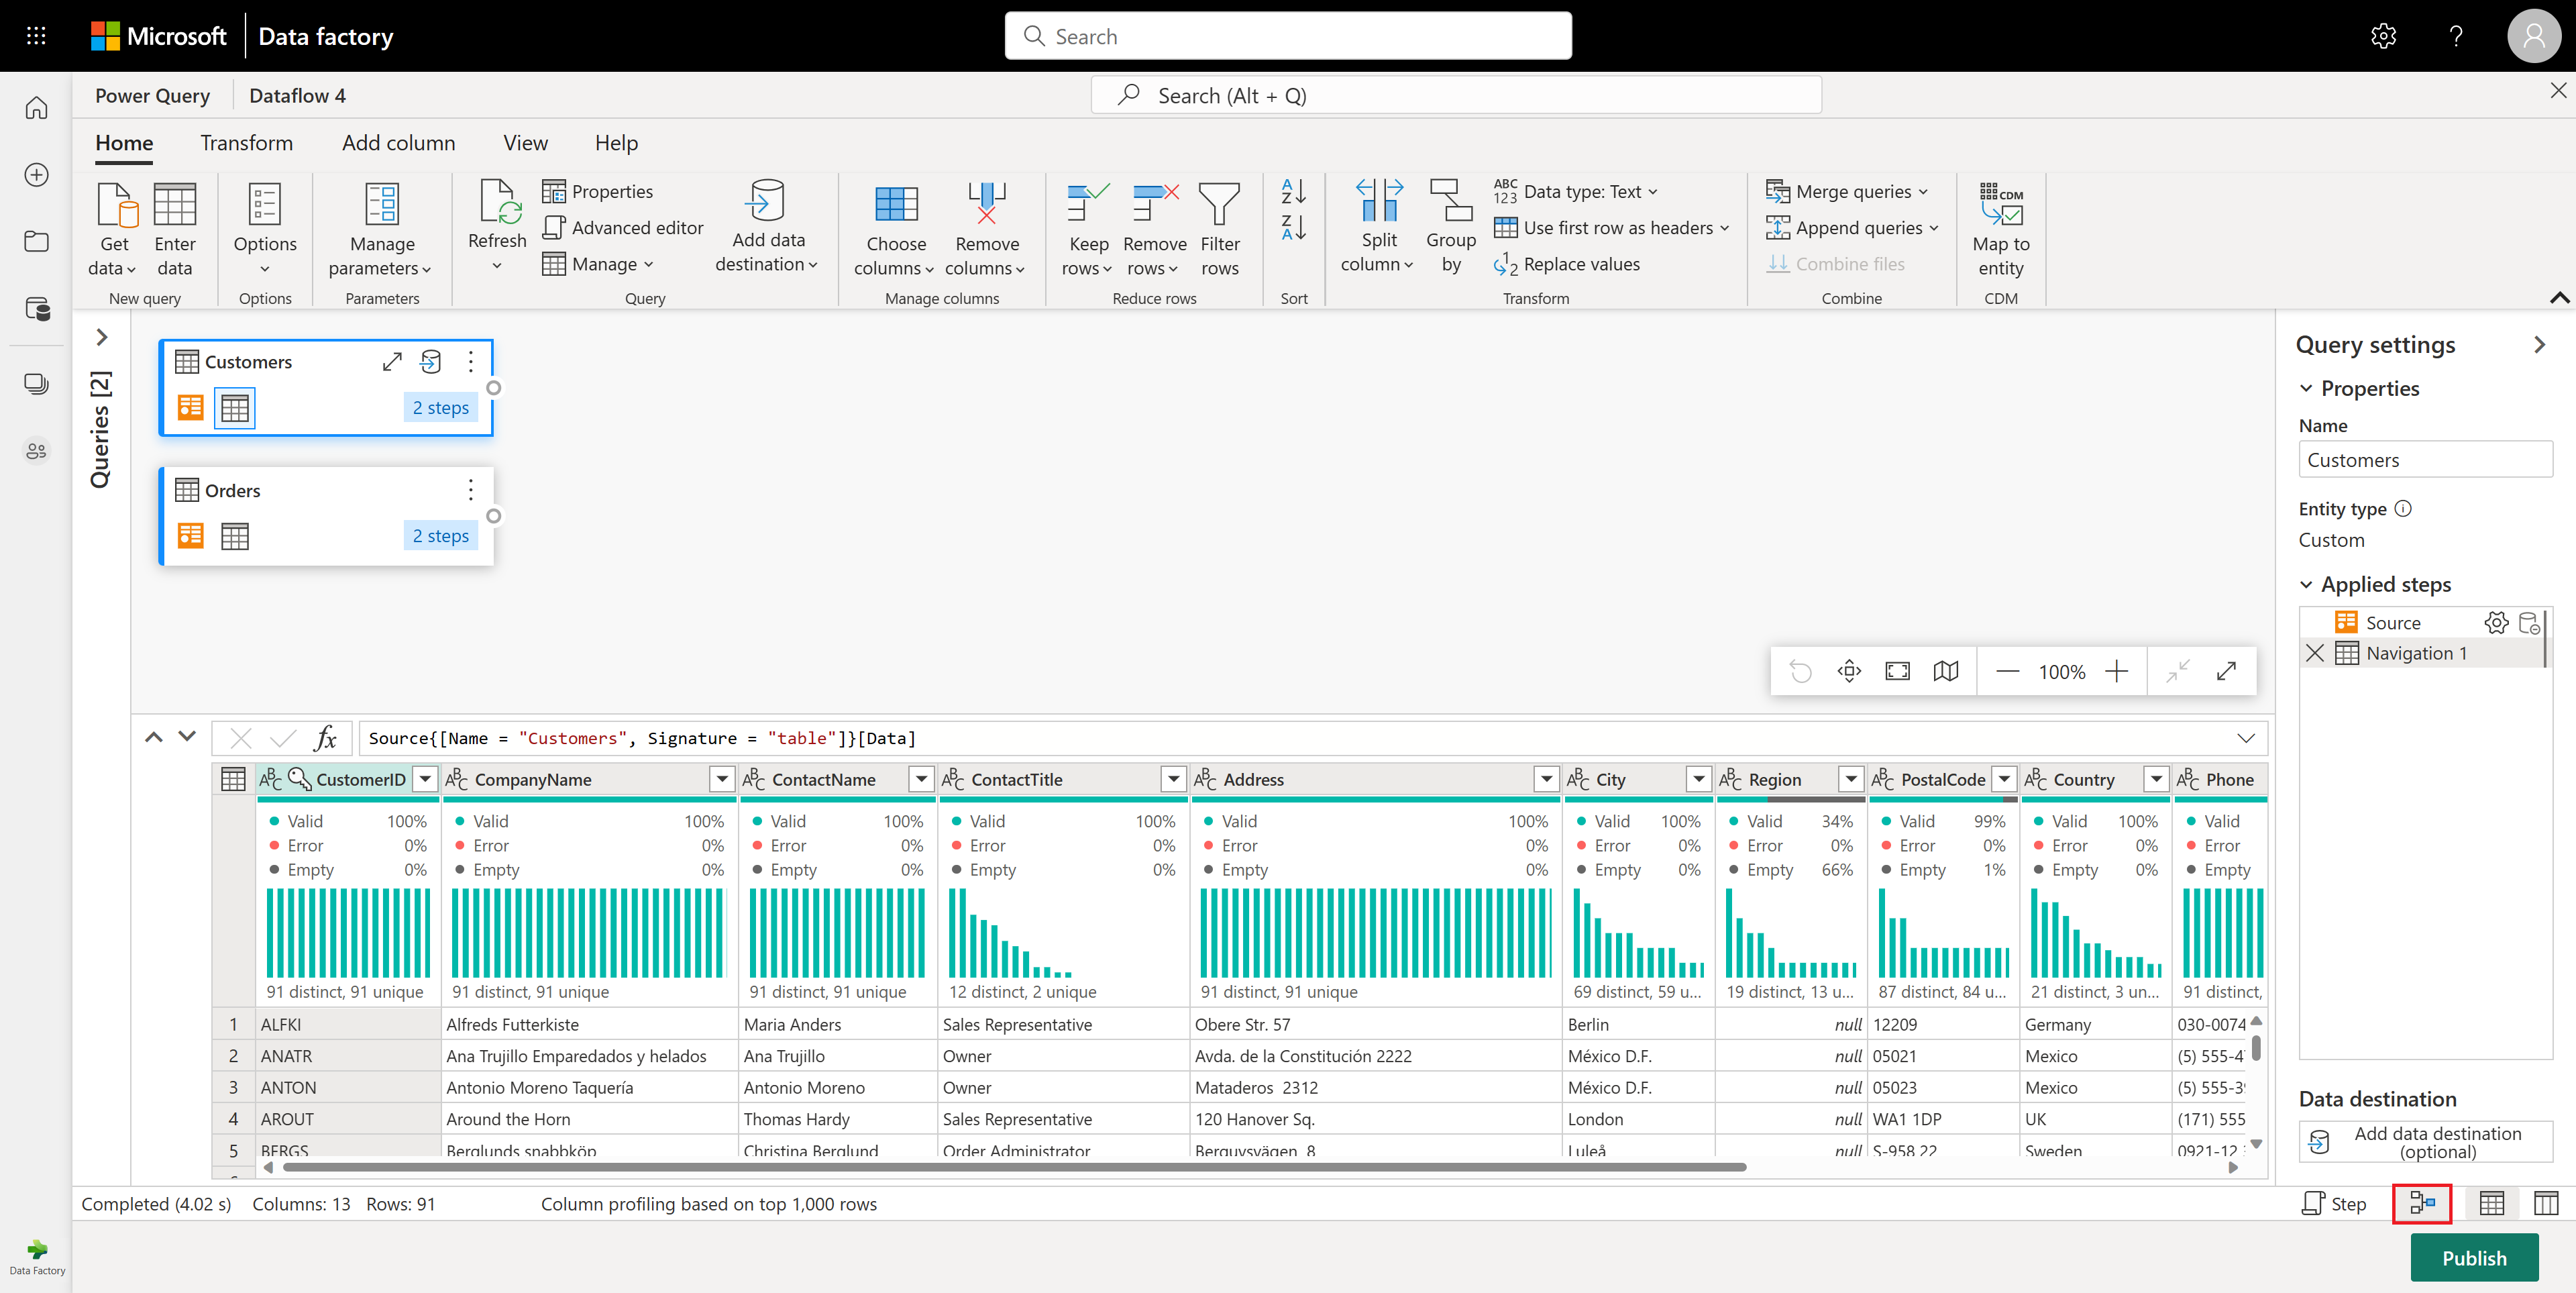
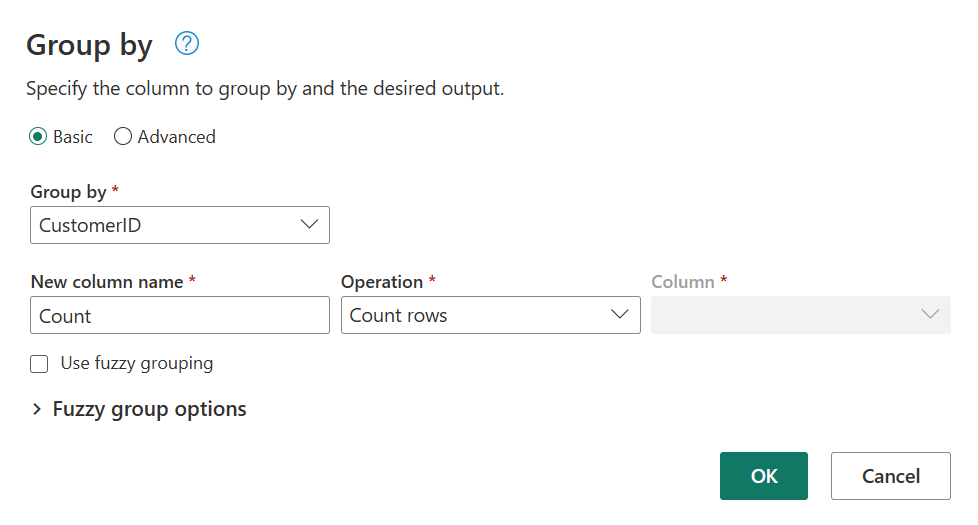
Within the Orders table, calculate the total number of orders per customer: Select the CustomerID column in the data preview and then select Group By under the Transform tab in the ribbon.

You perform a count of rows as the aggregation within Group By. You can learn more about Group By capabilities in Grouping or summarizing rows.
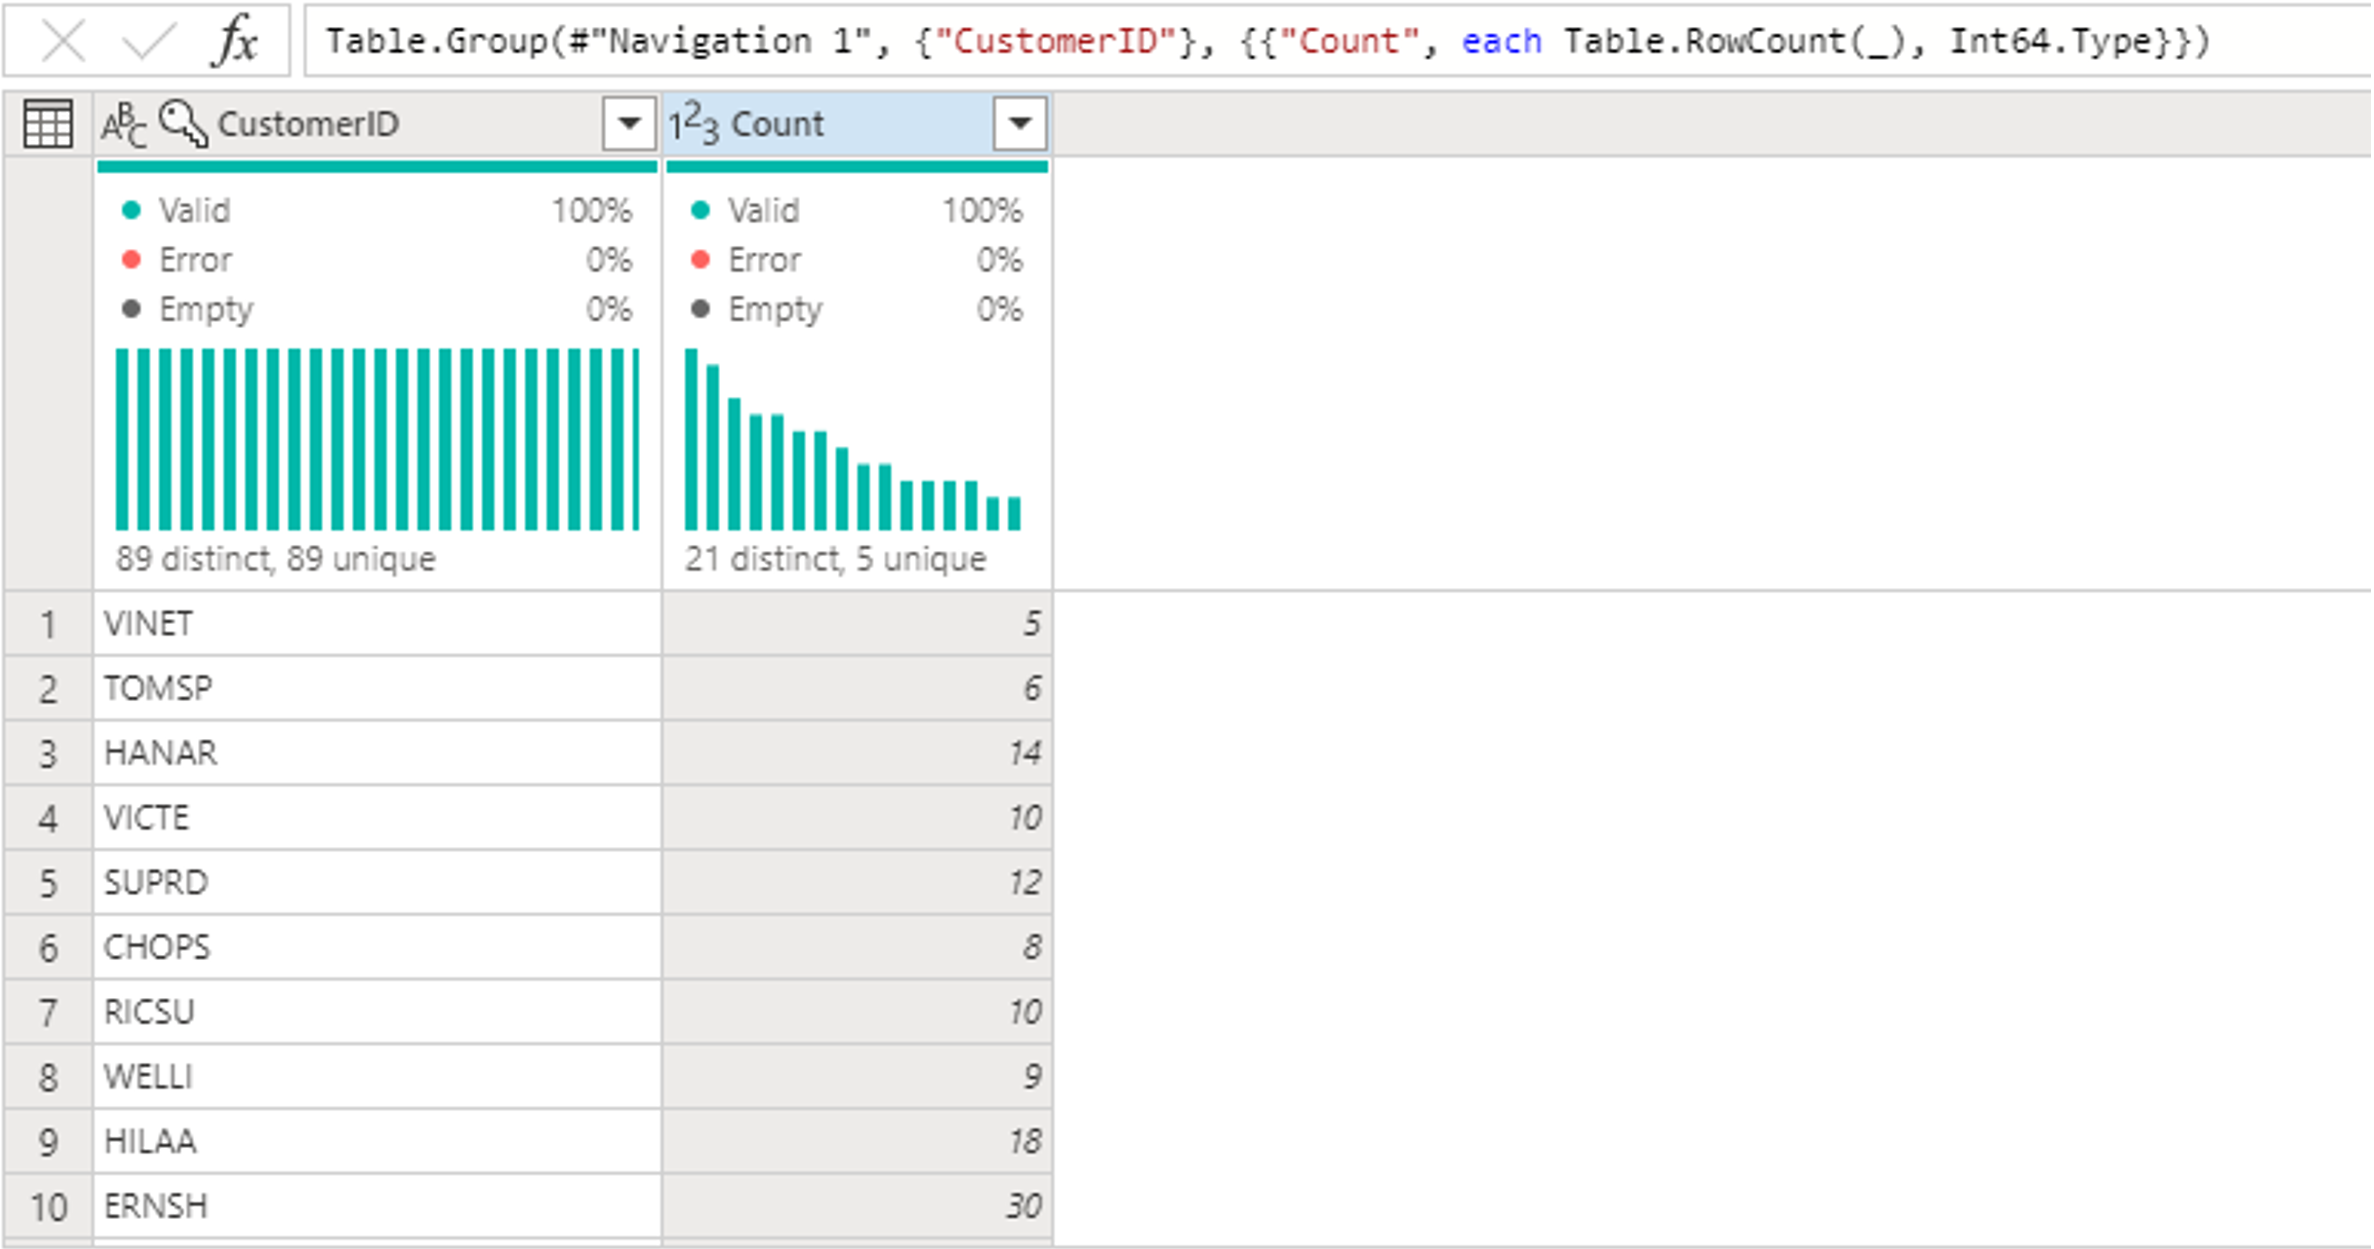
After grouping data in the Orders table, we'll obtain a two-column table with CustomerID and Count as the columns.
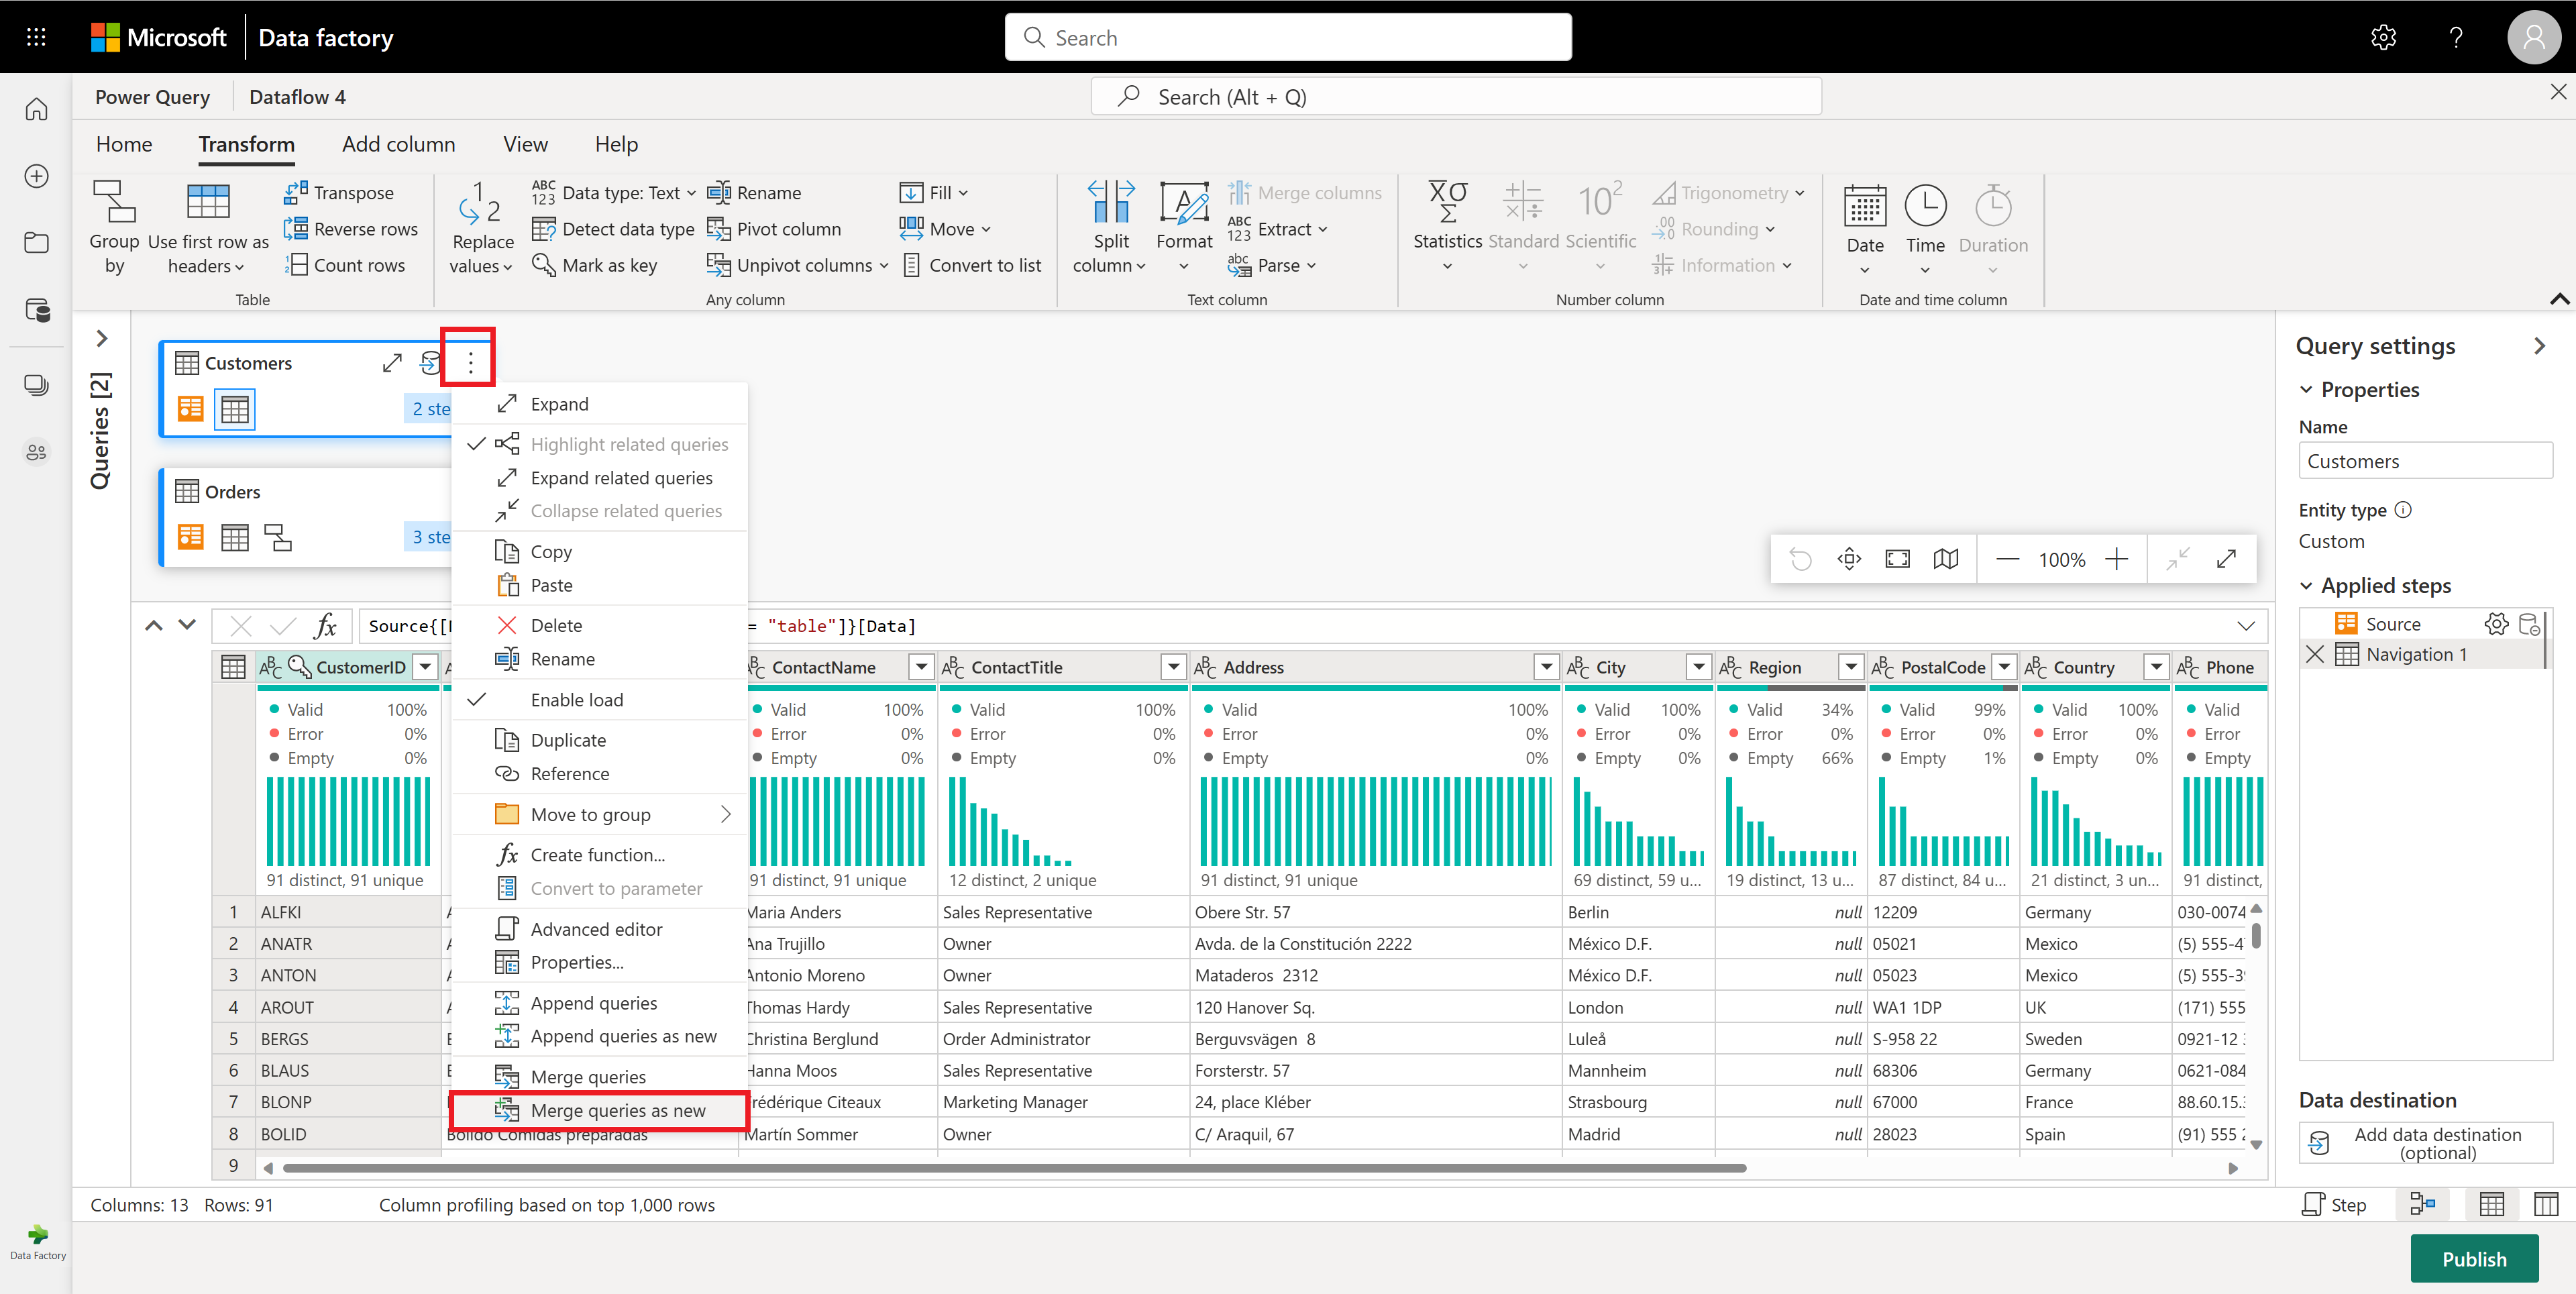
Next, you want to combine data from the Customers table with the Count of Orders per customer: Select the Customers query in the Diagram View and use the "⋮" menu to access the Merge queries as new transformation.
Configure the Merge operation by selecting CustomerID as the matching column in both tables. Then select Ok.
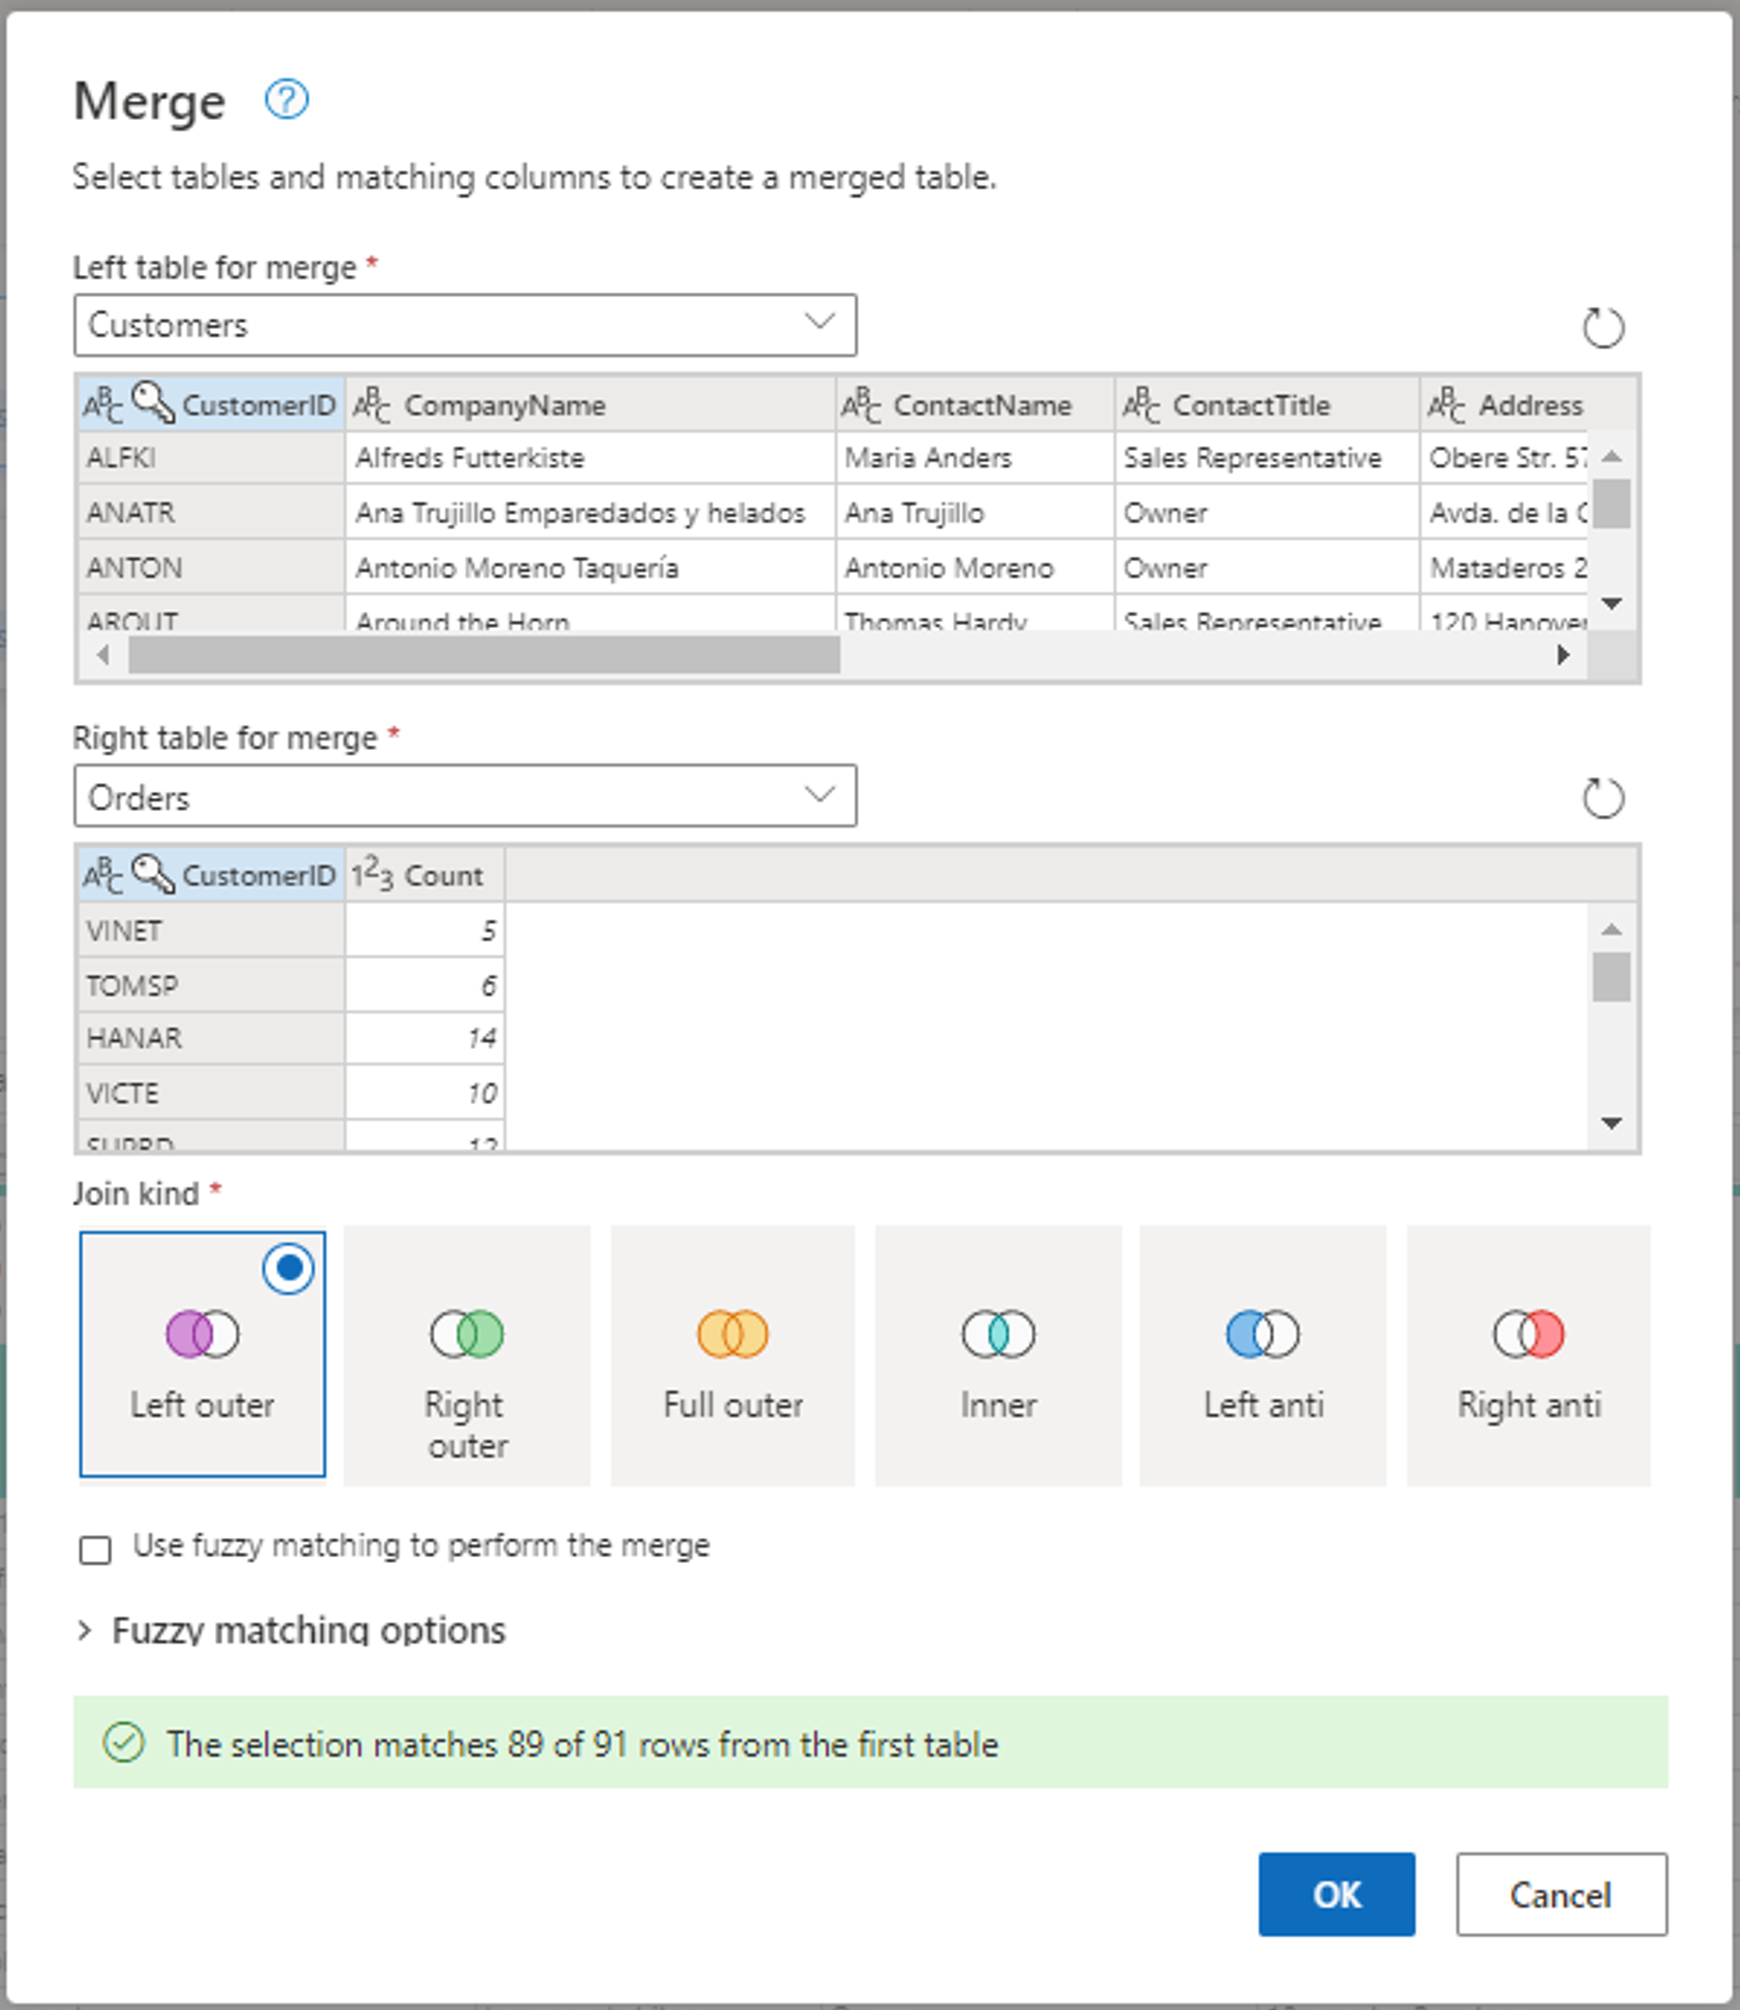
Screenshot of the Merge window, with the Left table for merge set to the Customers table and the Right table for merge set to the Orders table. The CustomerID column is selected for both the Customers and Orders tables. Also, the Join Kind is set to Left outer. All other selections are set to their default value.
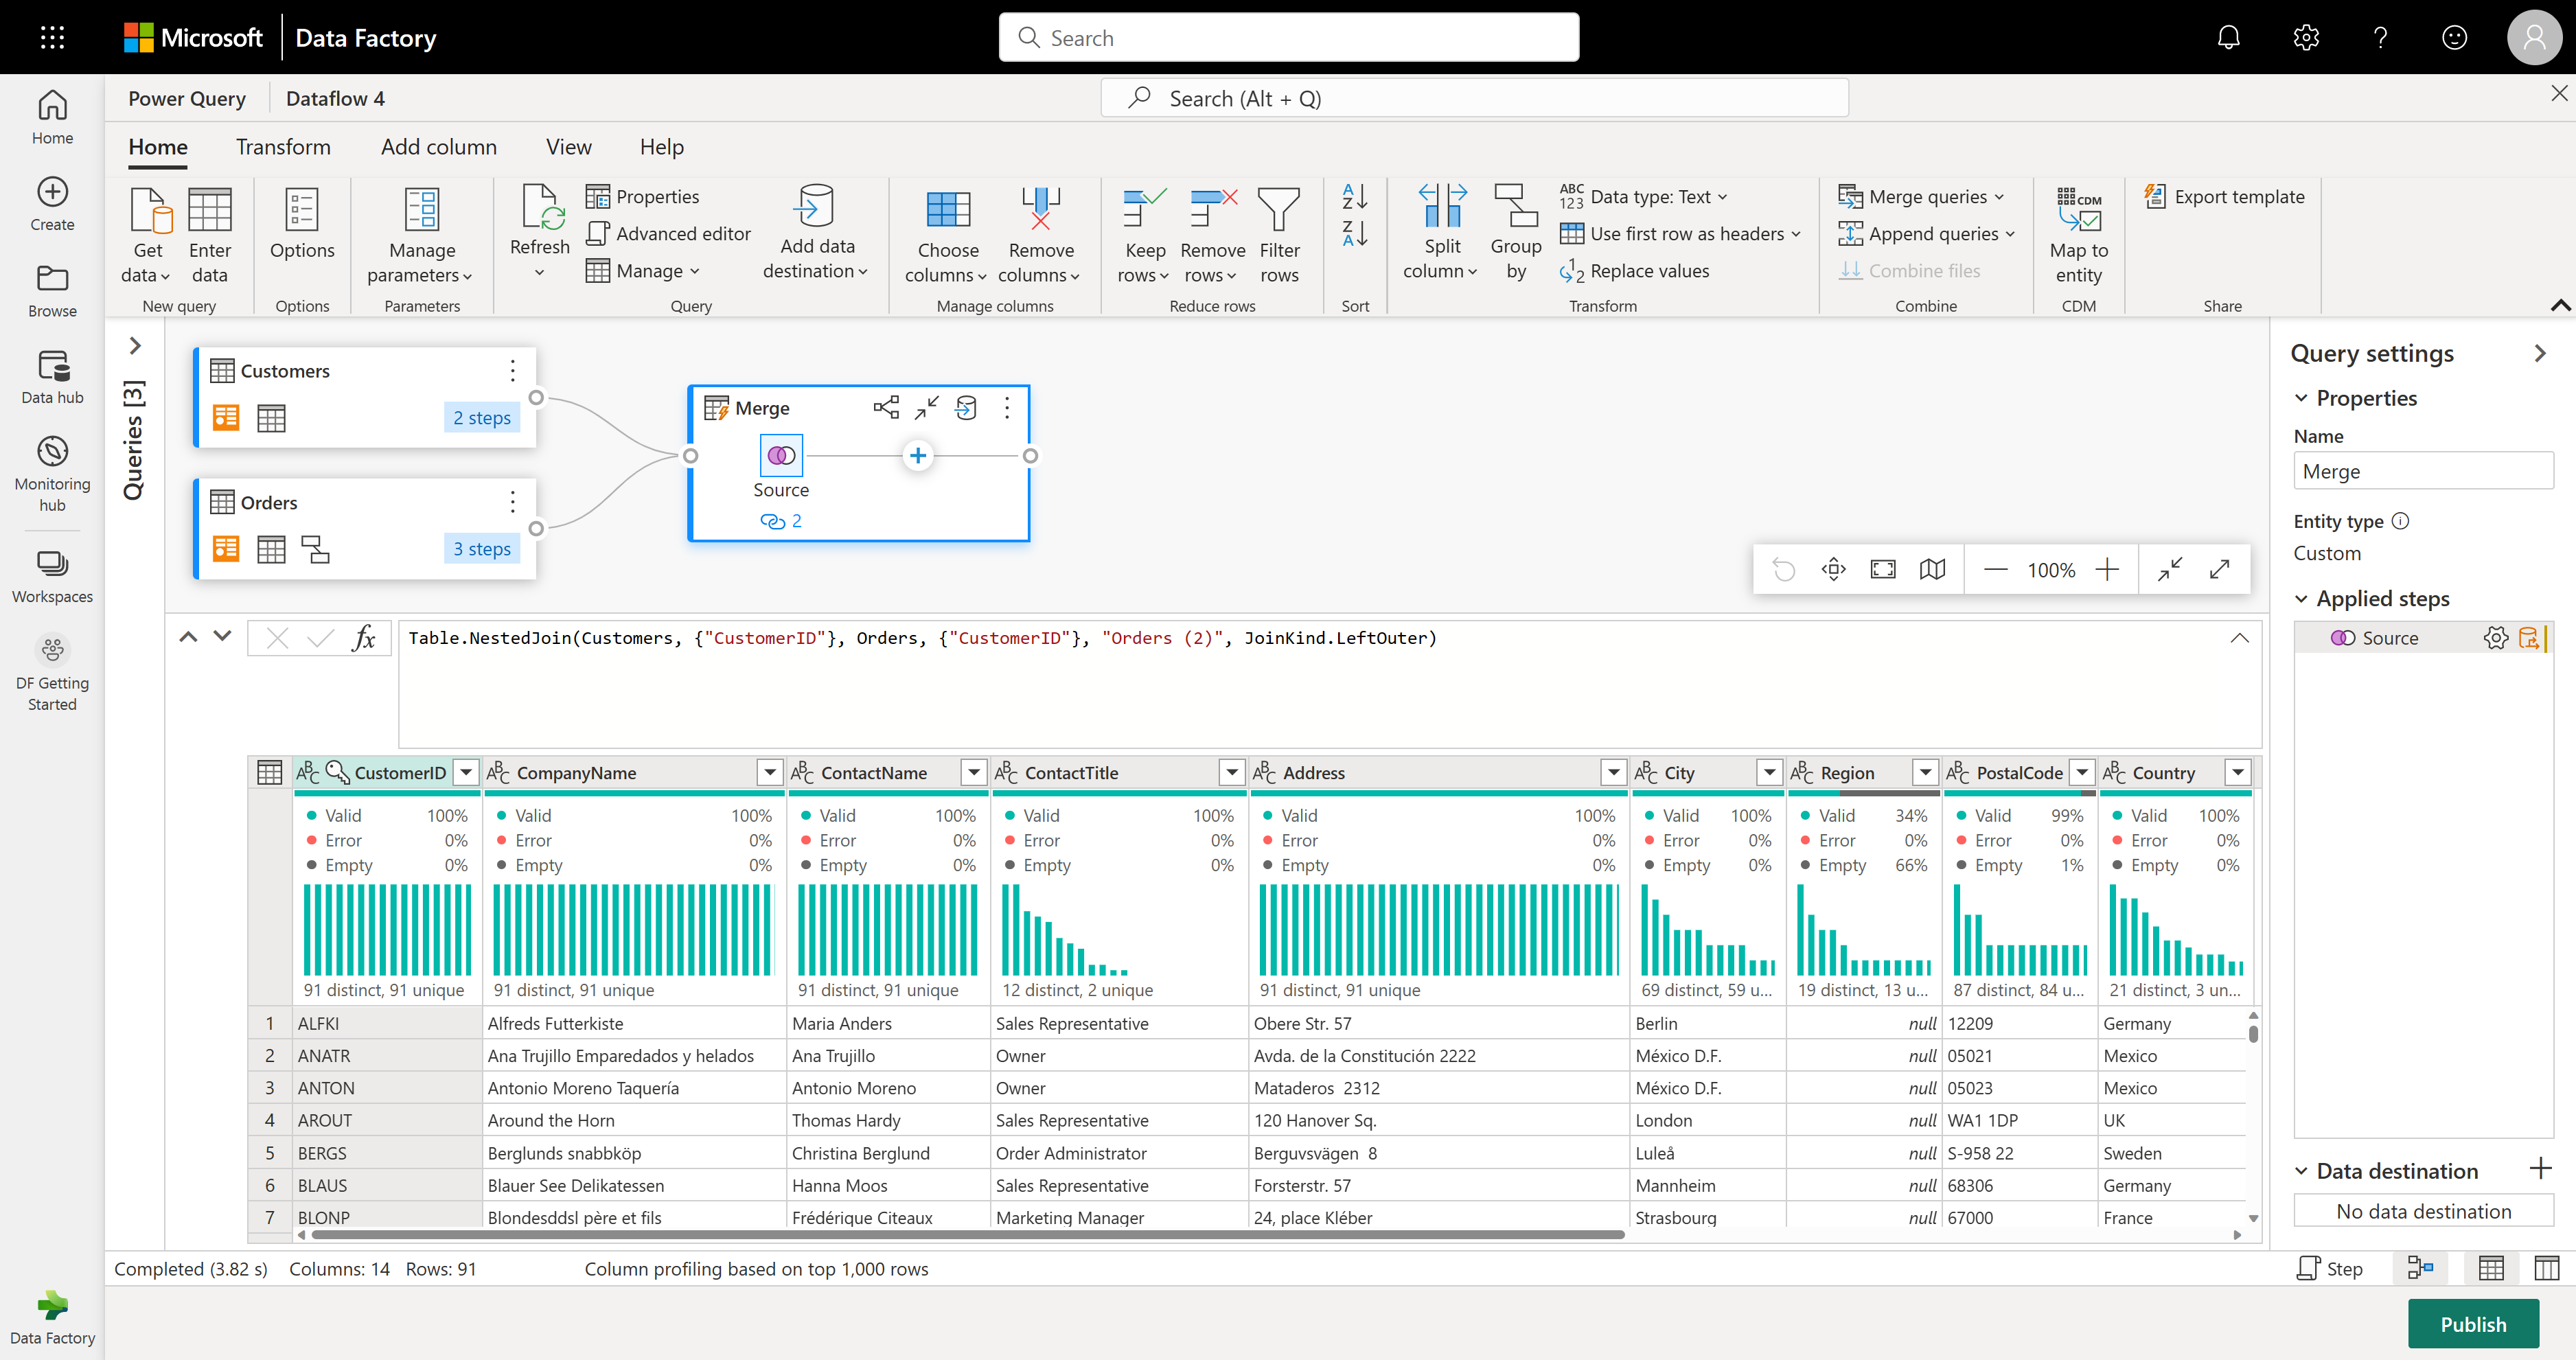
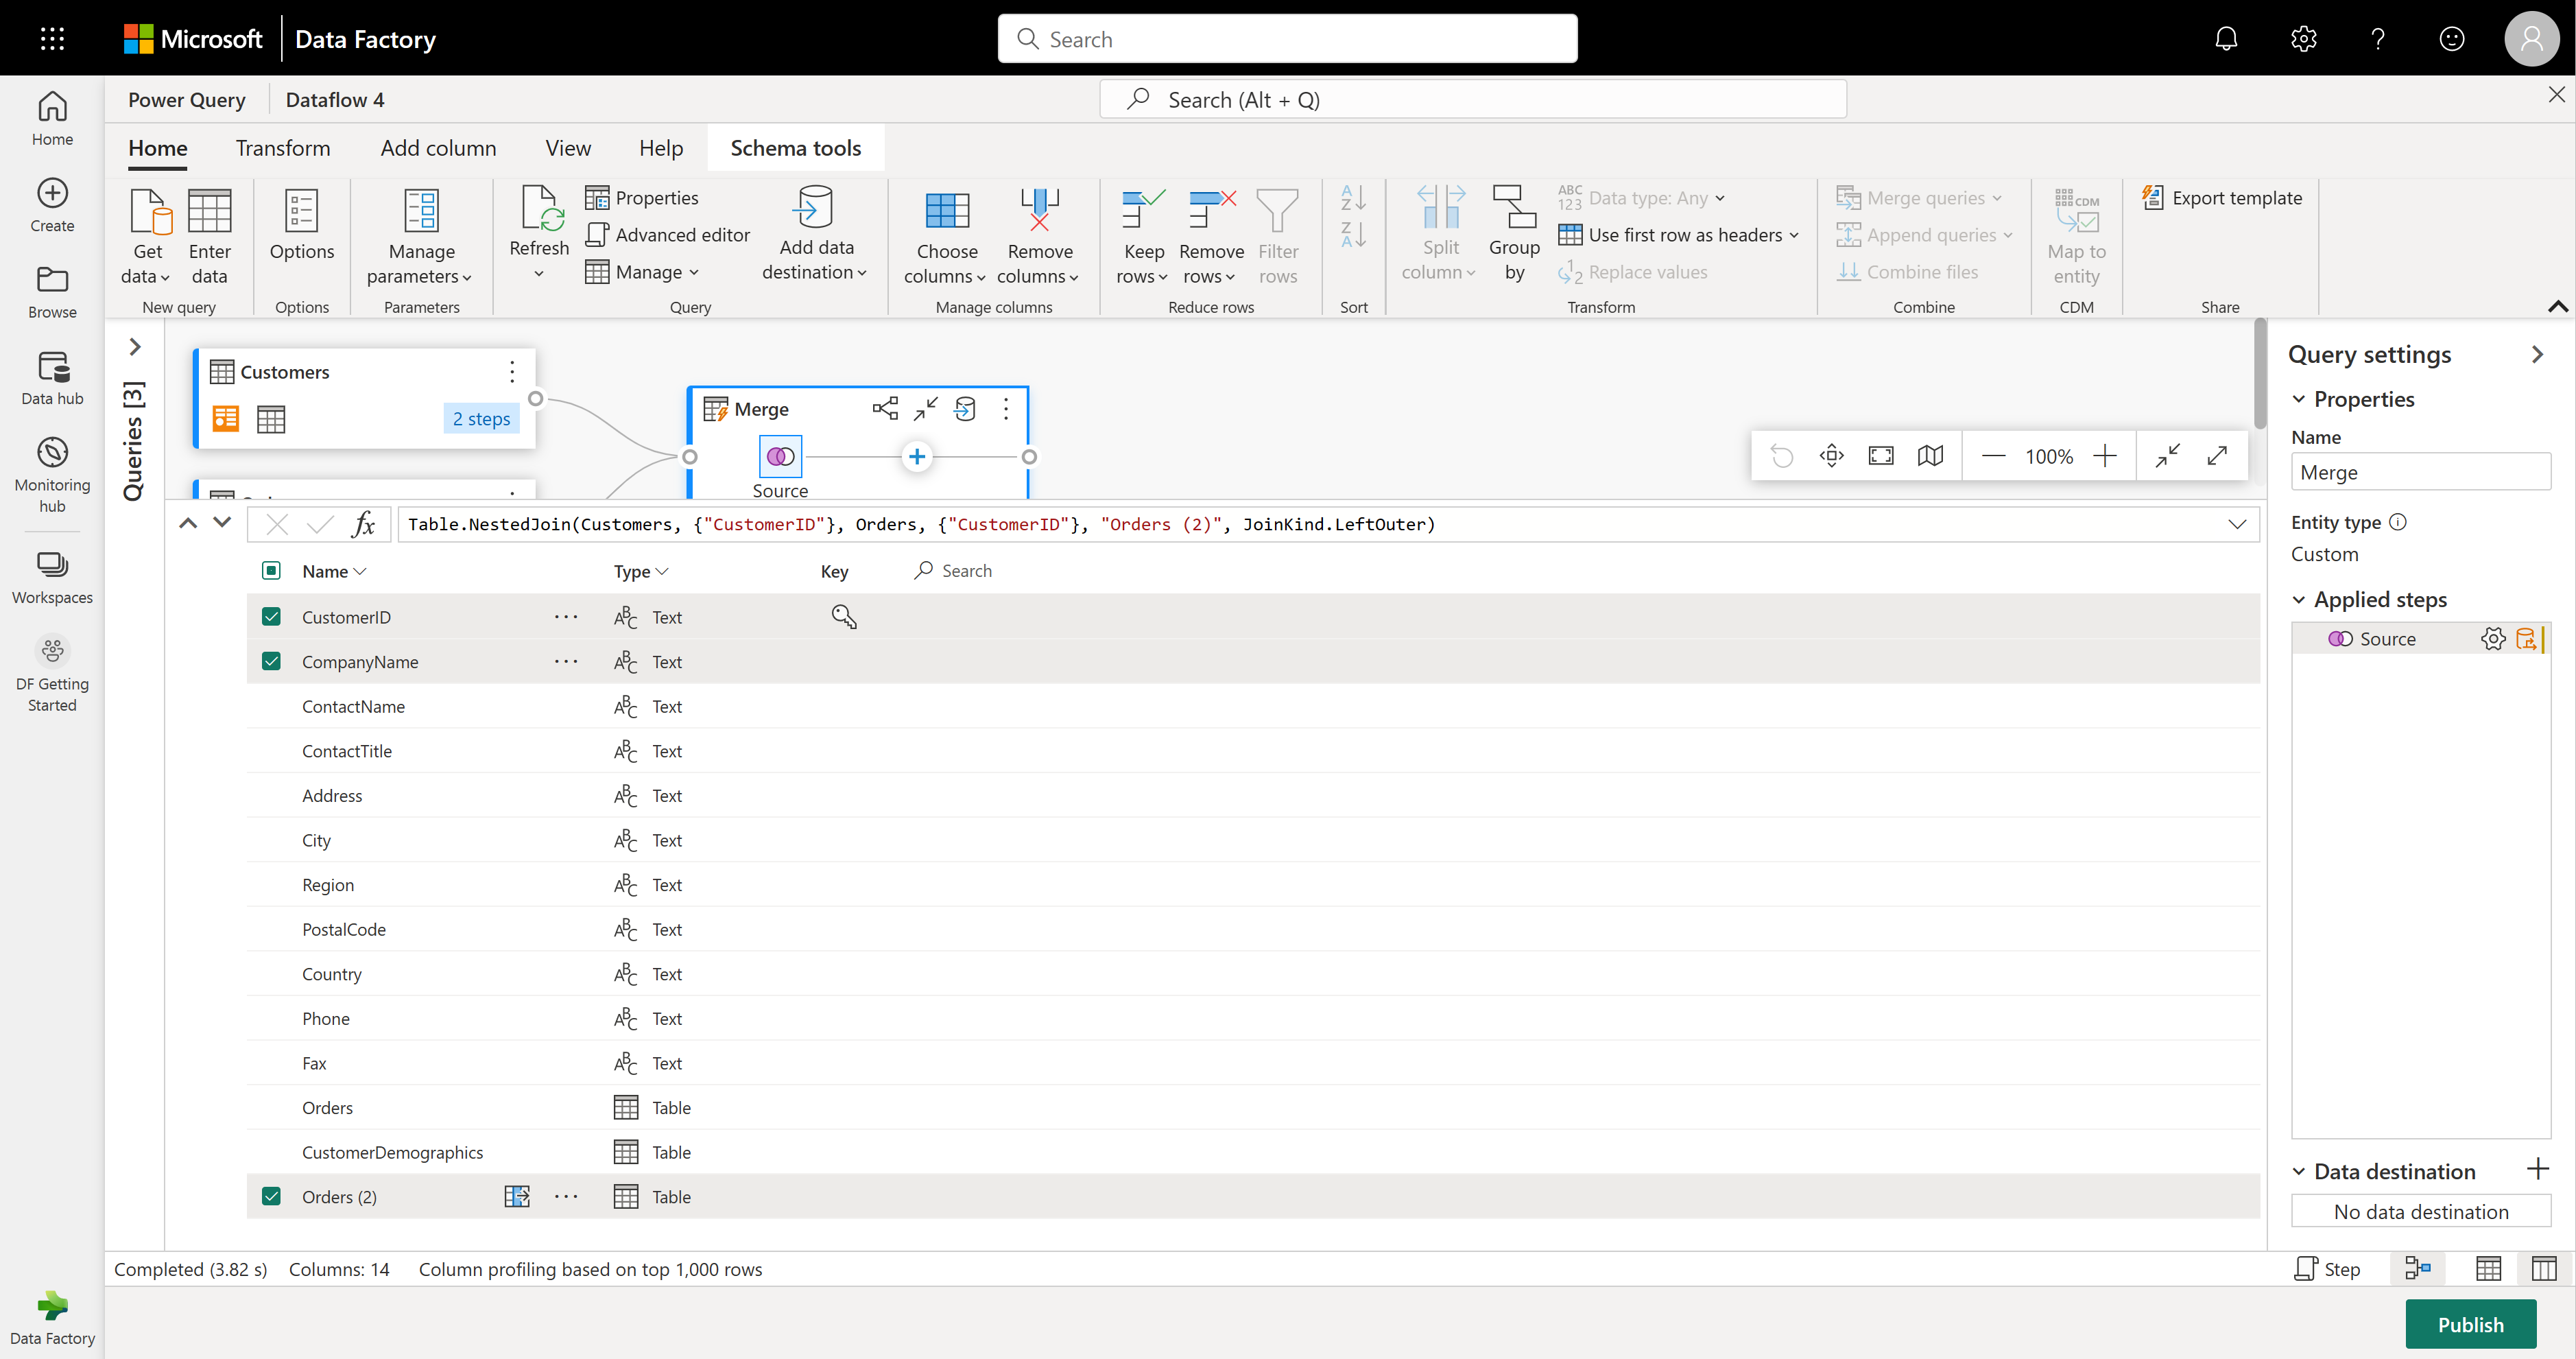
Now there's a new query with all columns from the Customers table and one column with nested data from the Orders table.
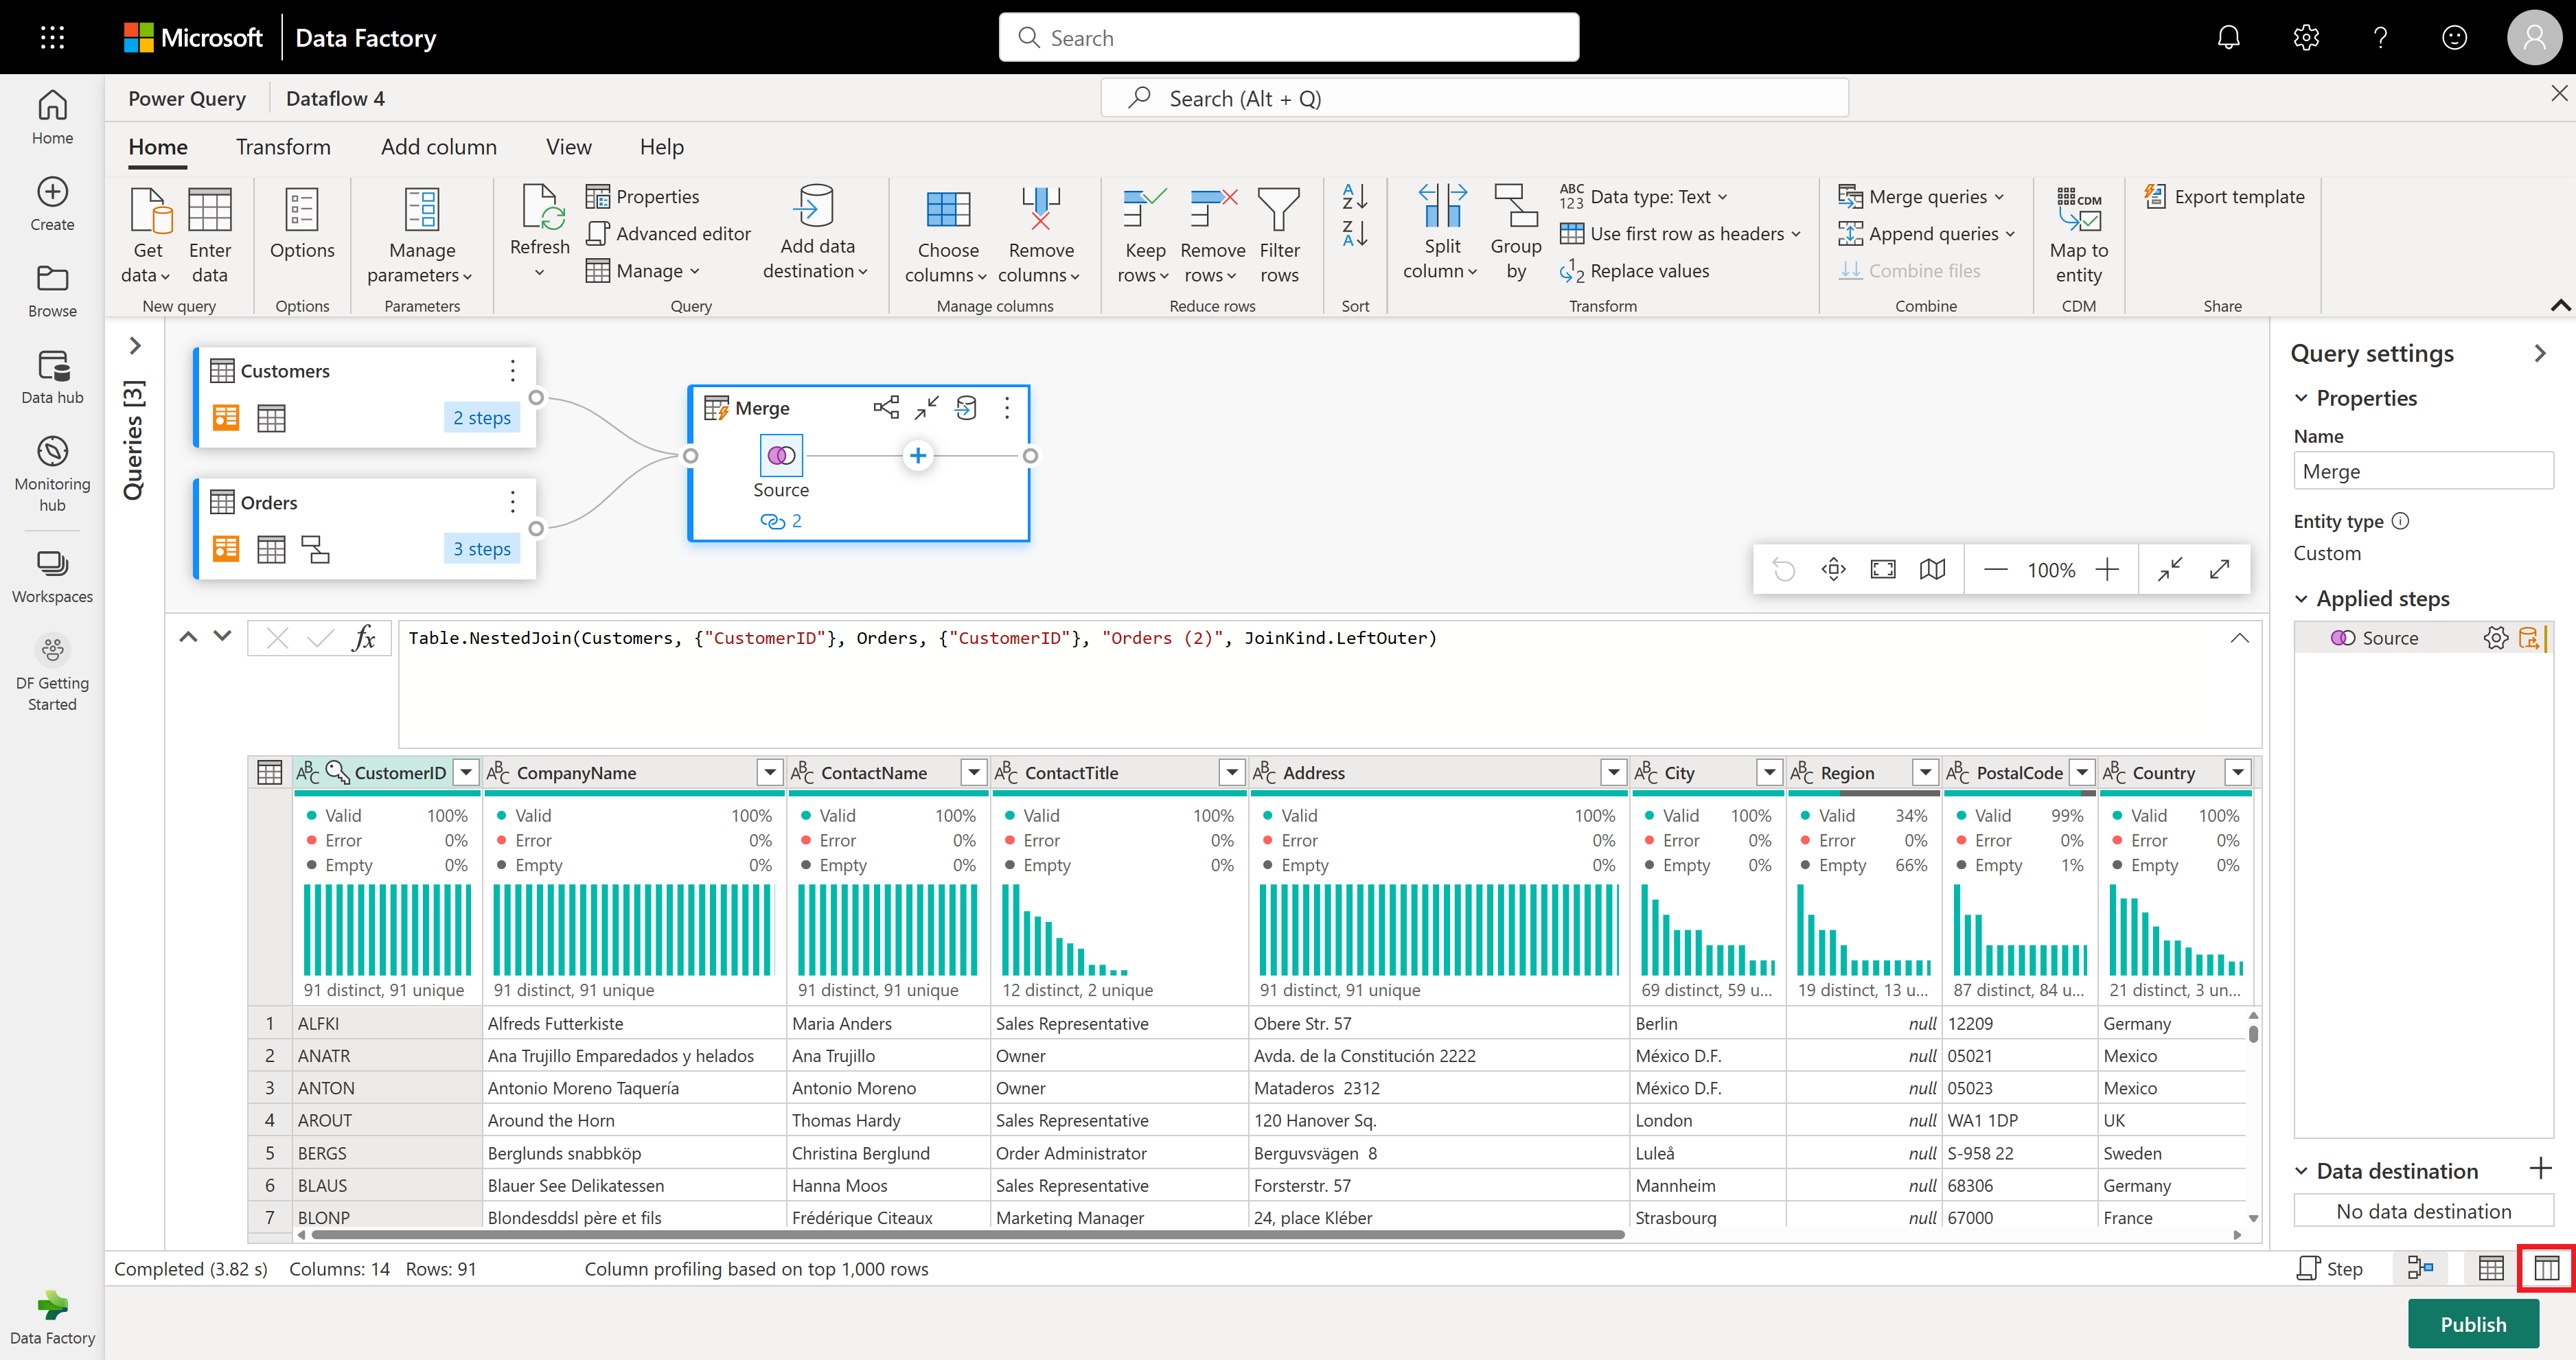
Let's focus on just a few columns from the Customers table. To do this, turn on schema view by selecting the schema view button in the bottom-right corner of the dataflow editor.
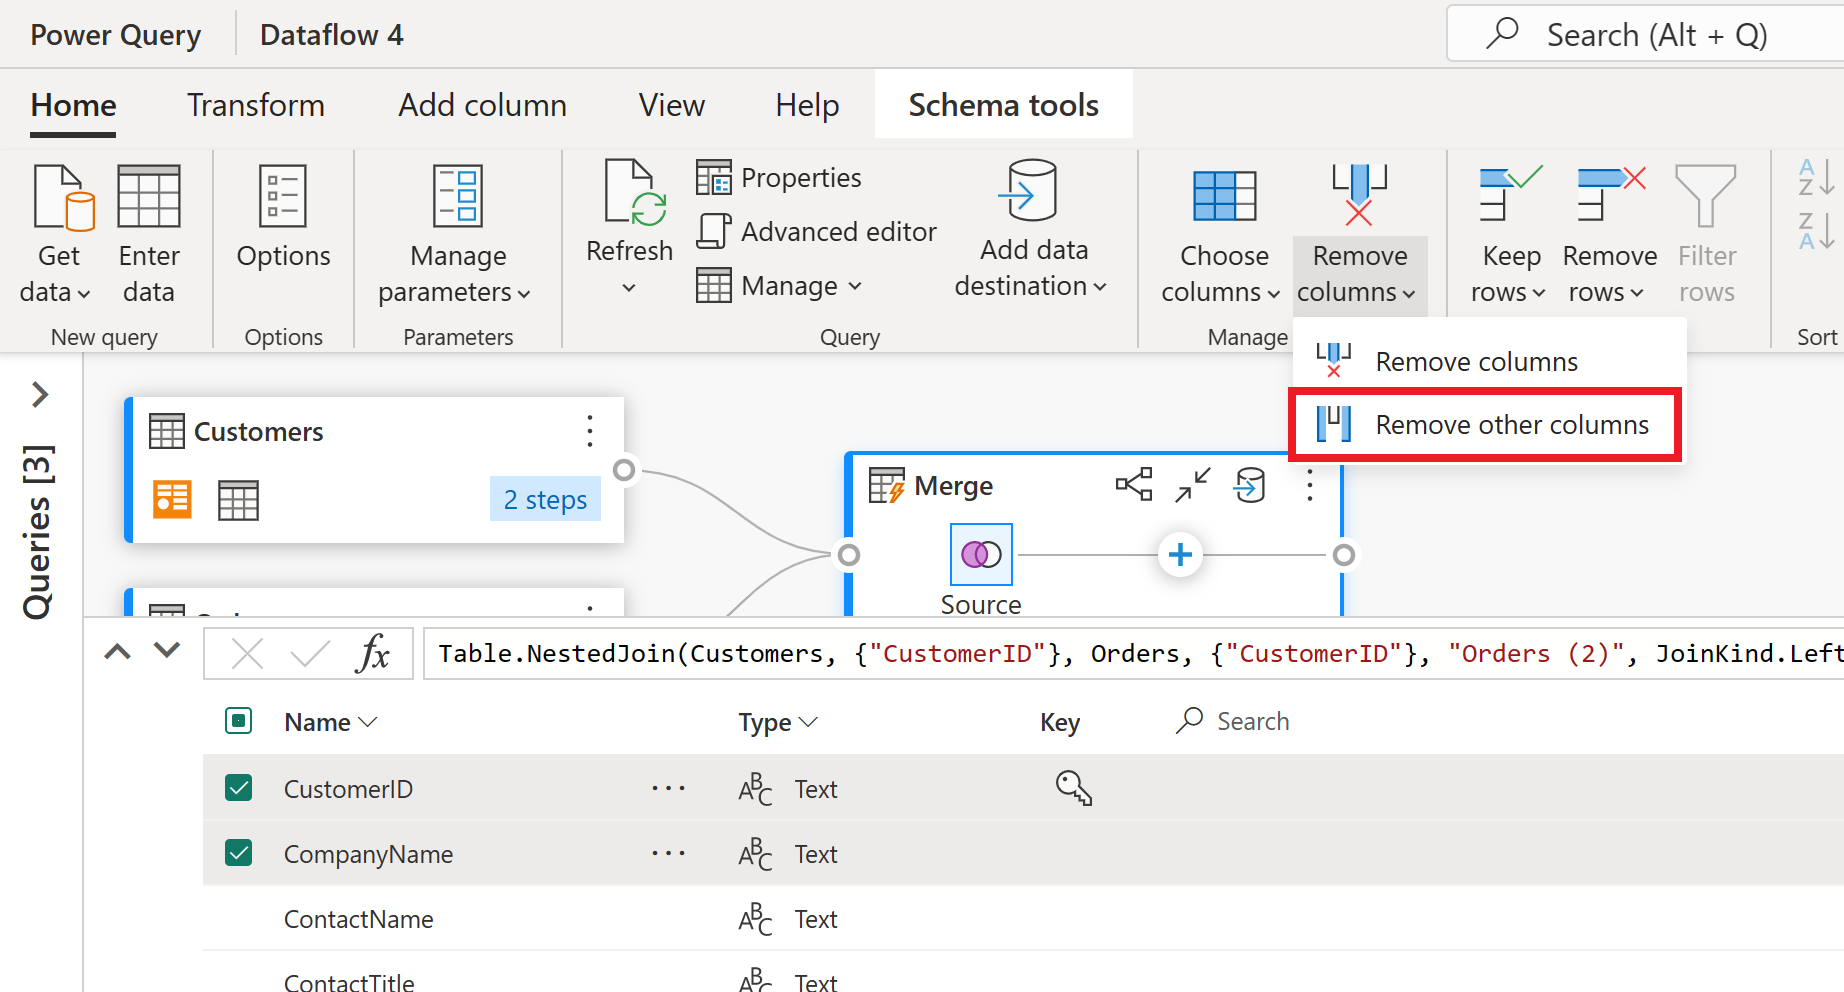
In schema view, you'll see all the columns in your table. Select CustomerID, CompanyName, and Orders (2). Then, go to the Schema tools tab, select Remove columns, and choose Remove other columns. This keeps only the columns you want.
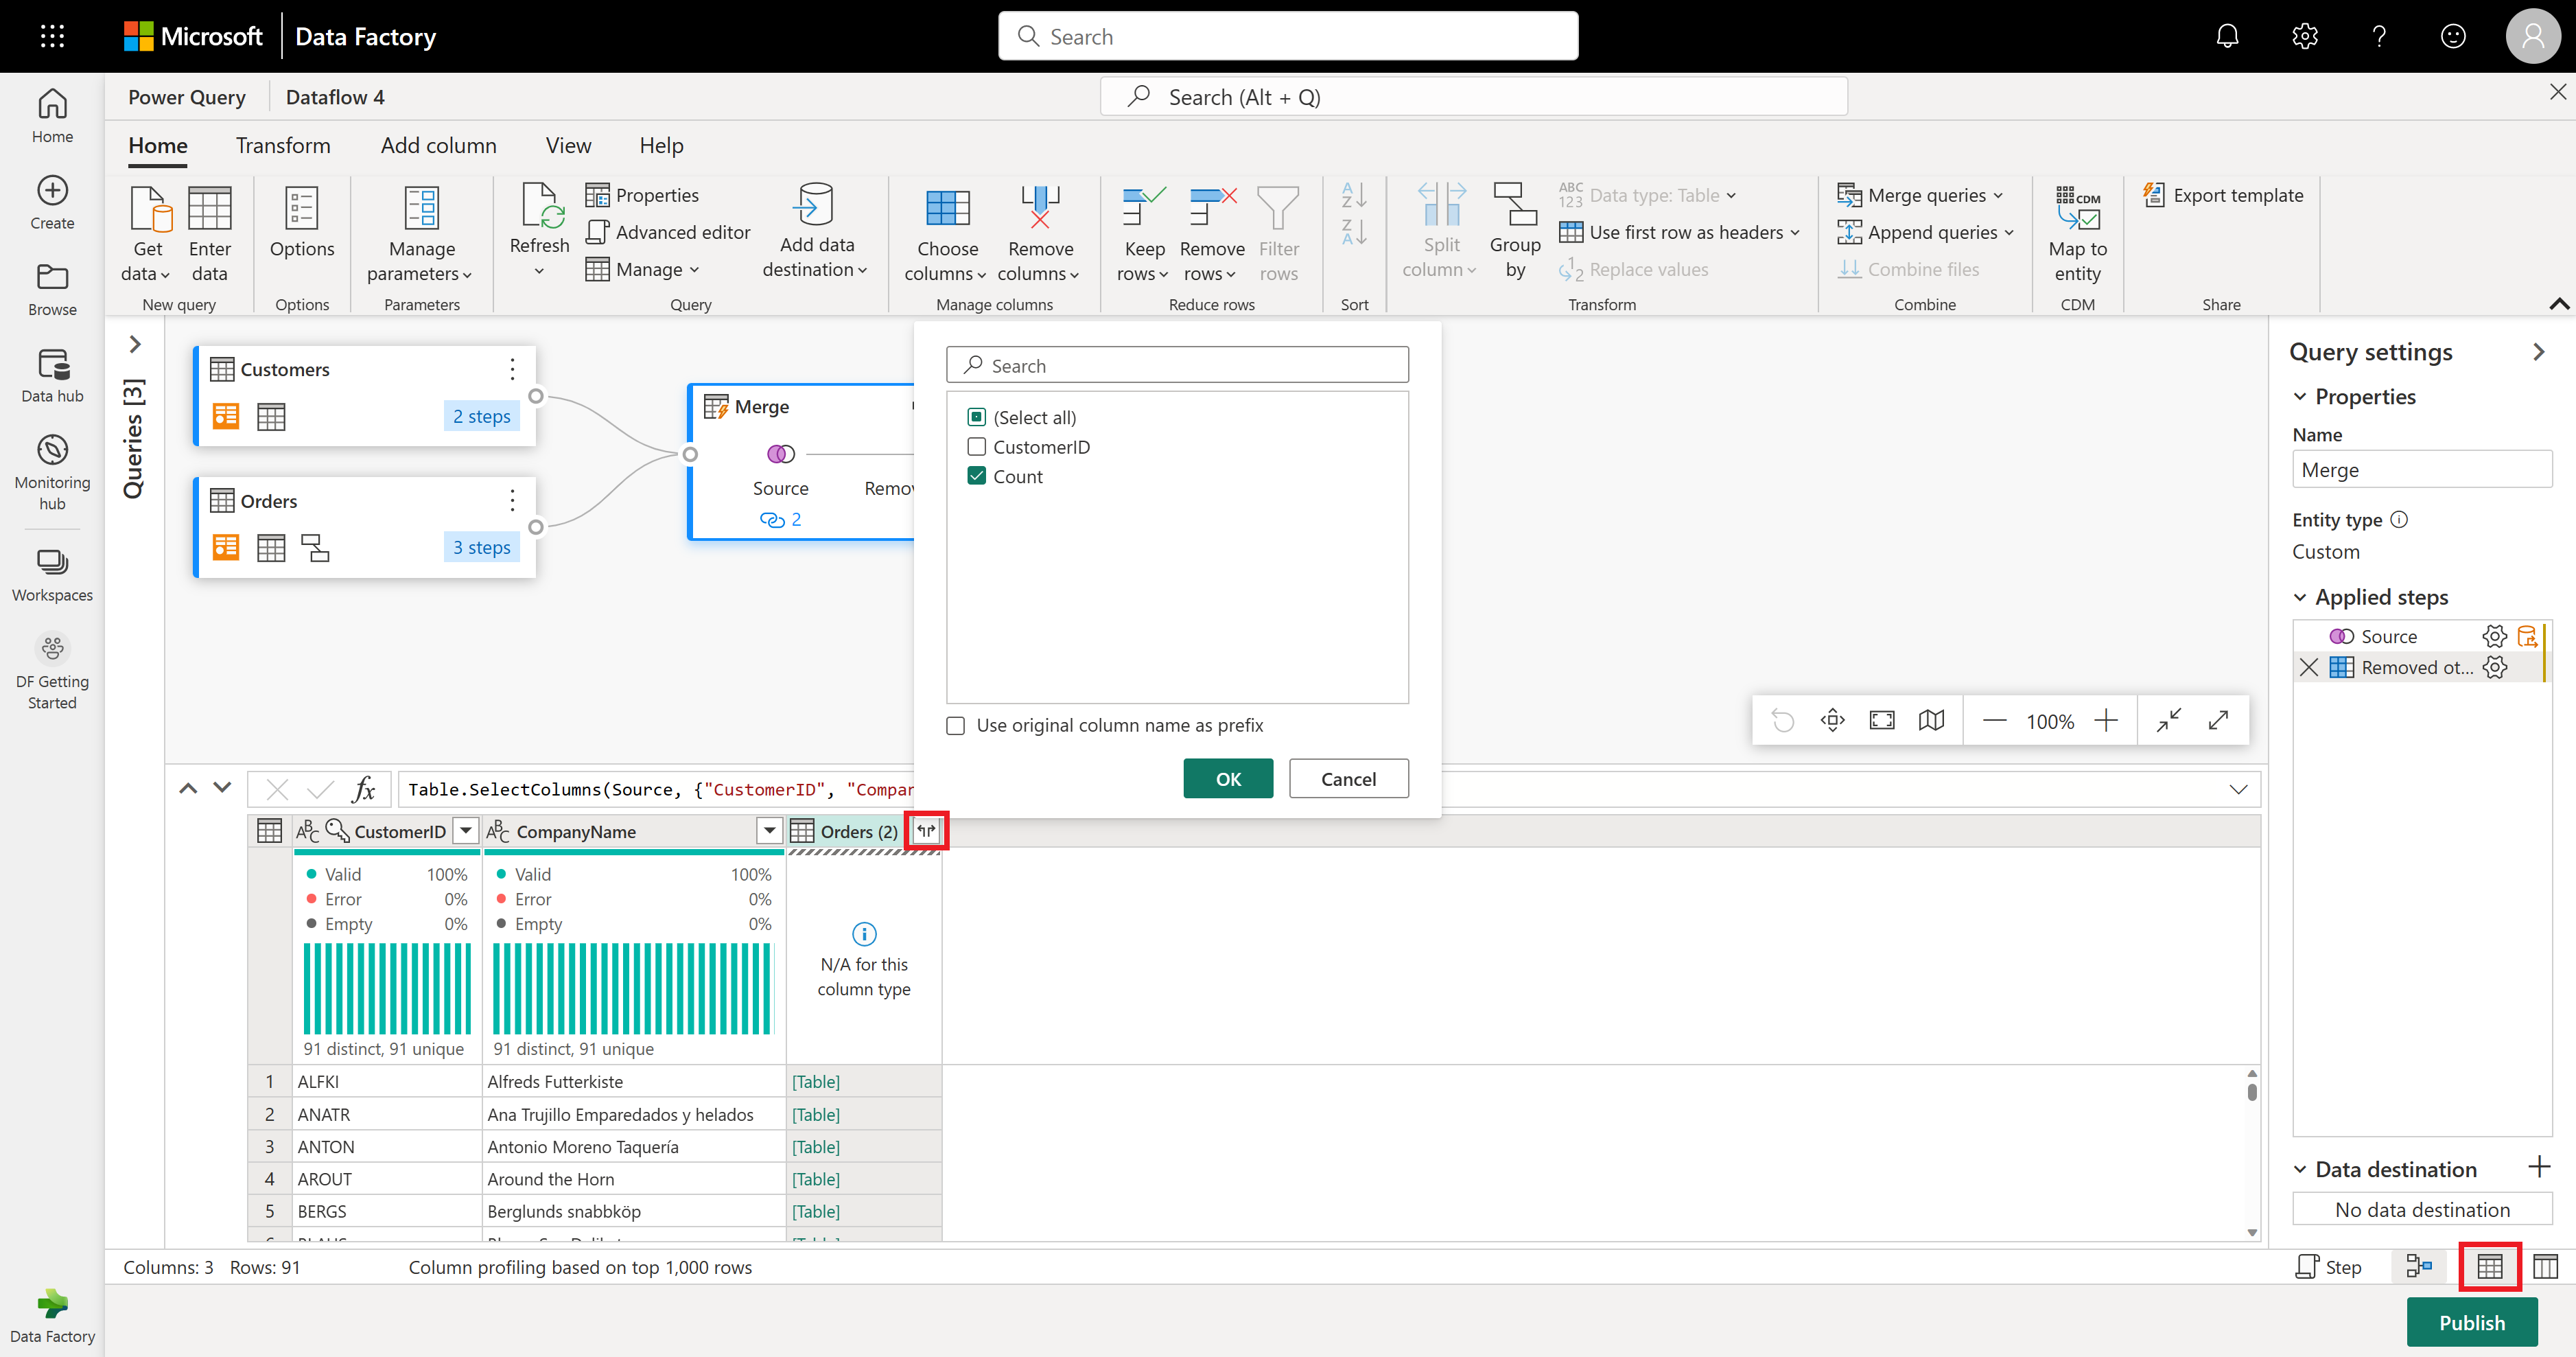
The Orders (2) column holds extra details from the merge step. To see and use this data, select the Show data view button in the bottom-right corner, next to Show schema view. Then, in the Orders (2) column header, select the Expand Column icon and pick the Count column. This adds the order count for each customer to your table.
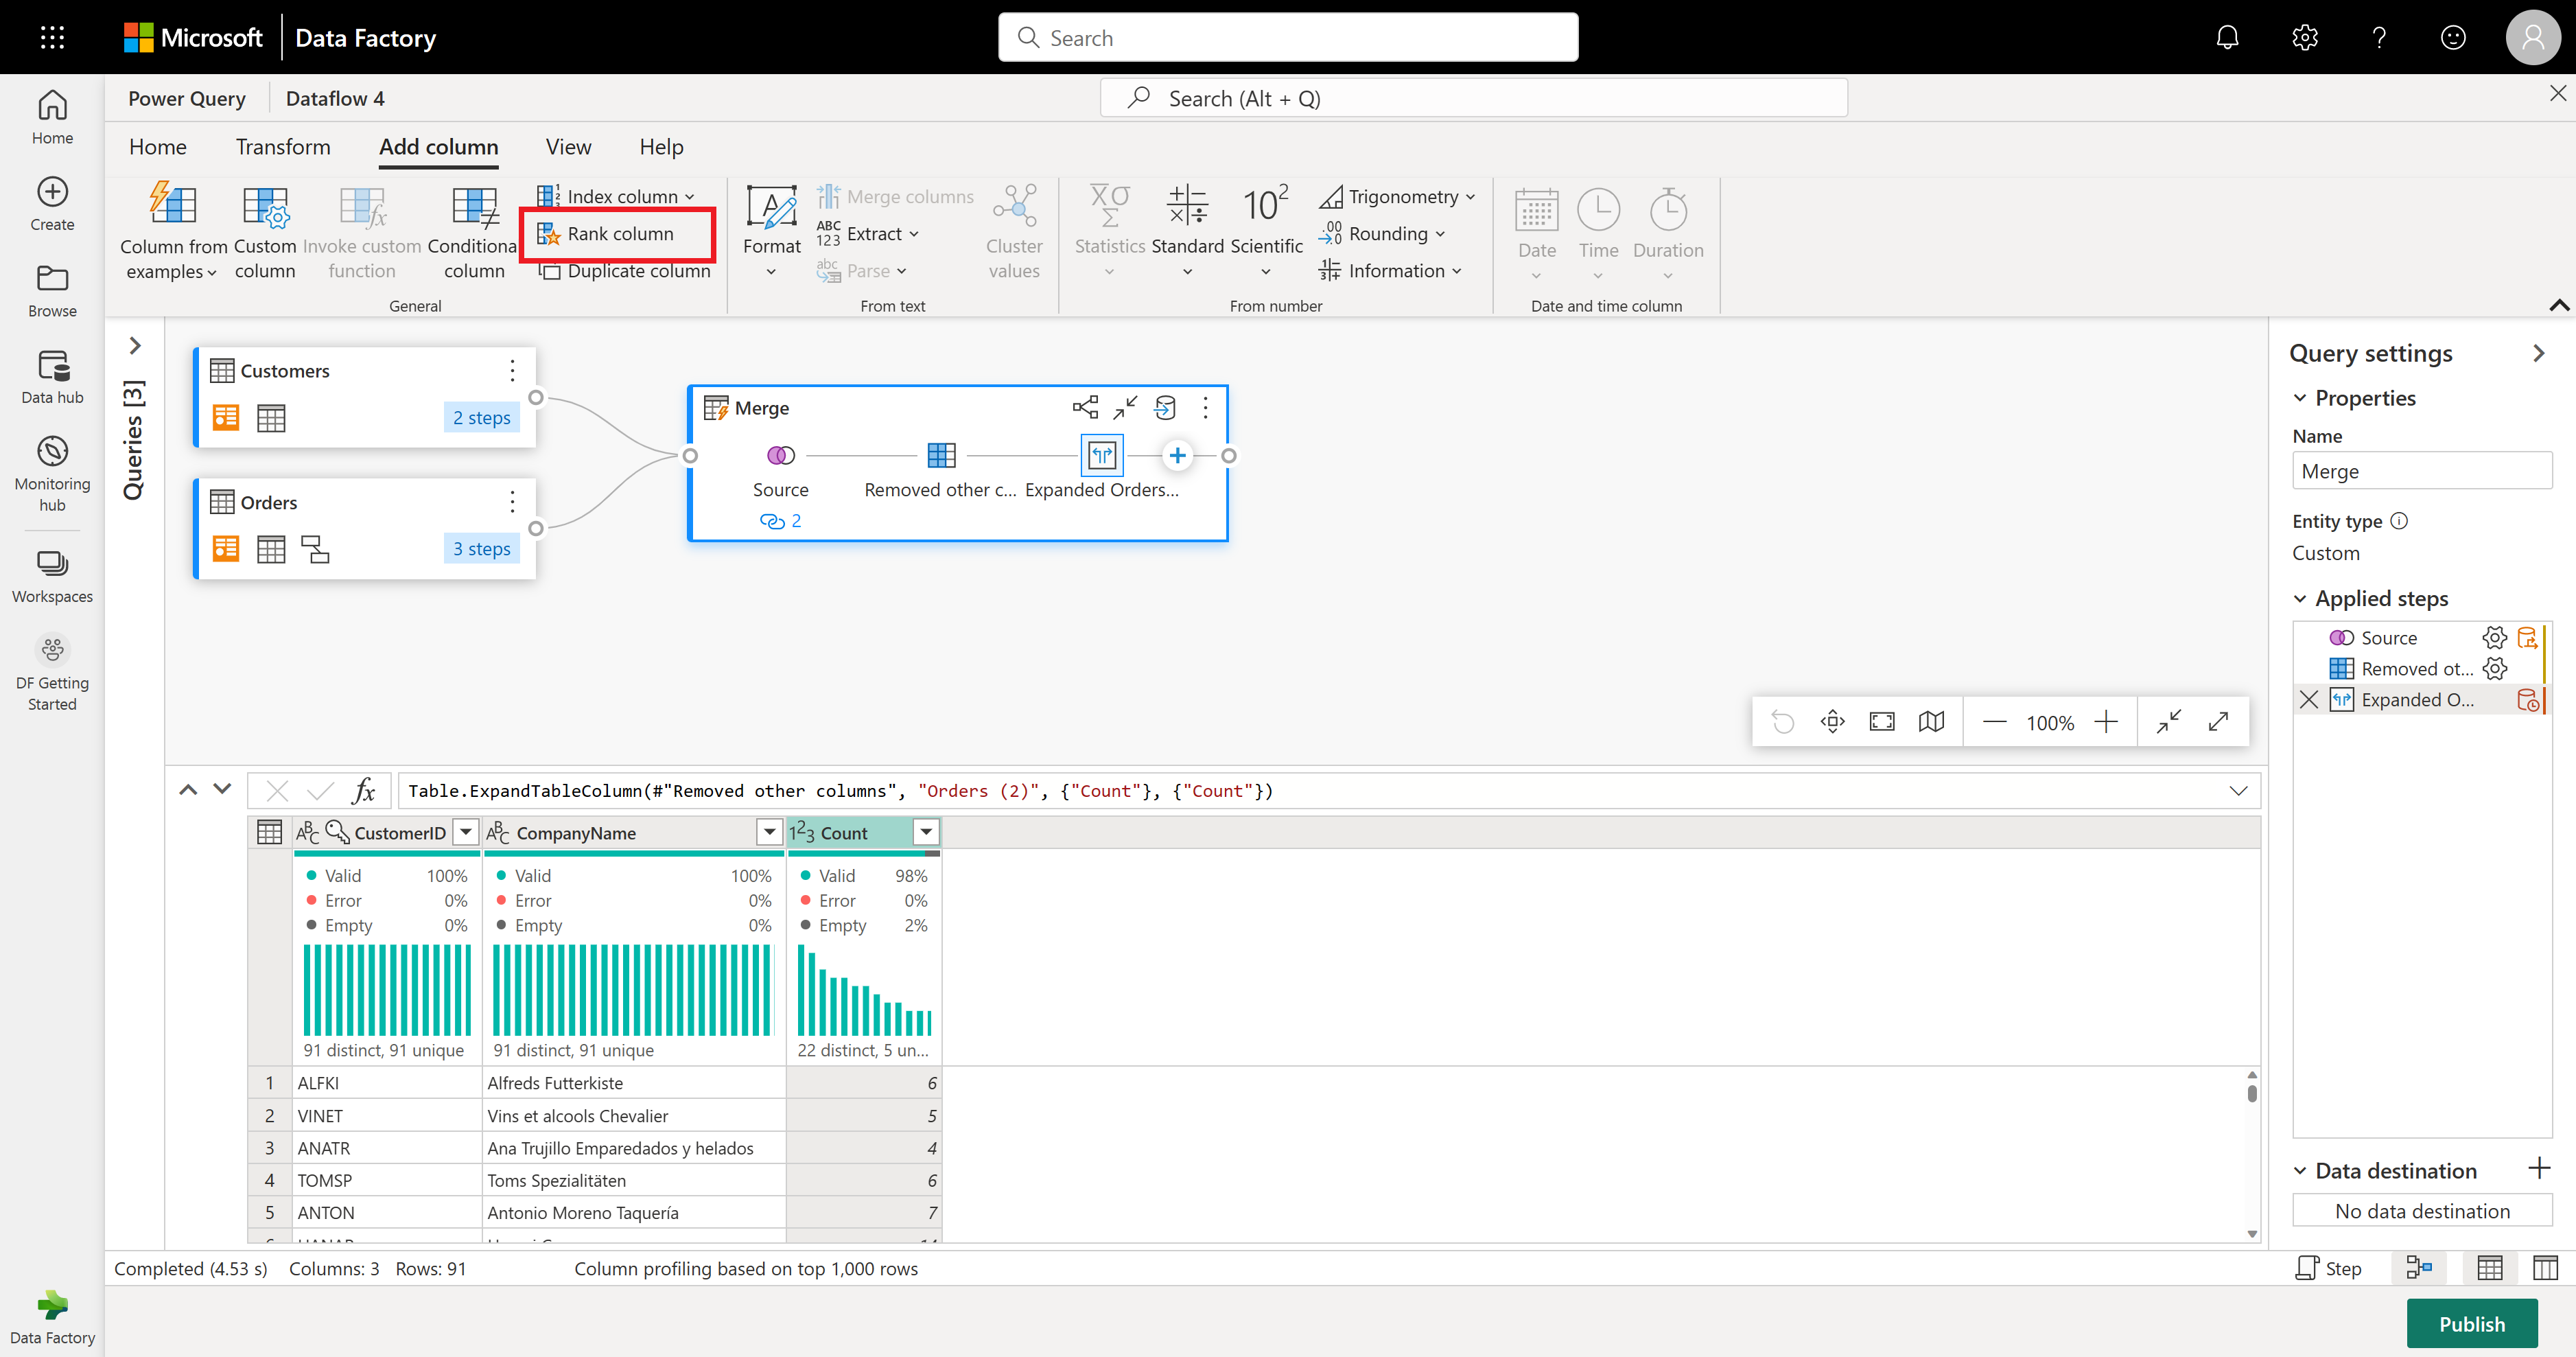
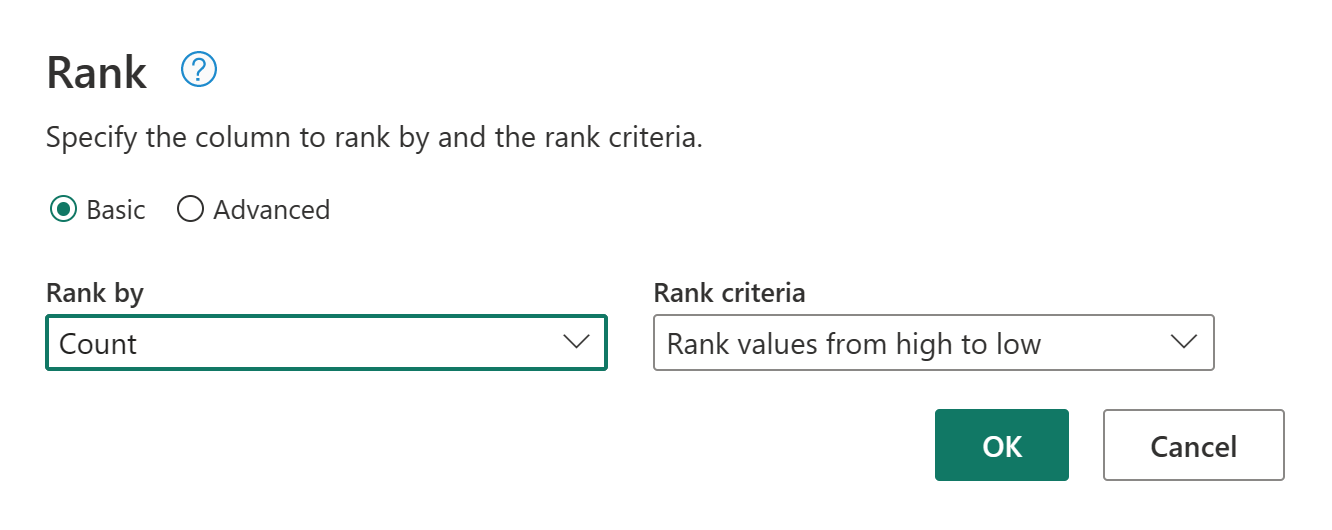
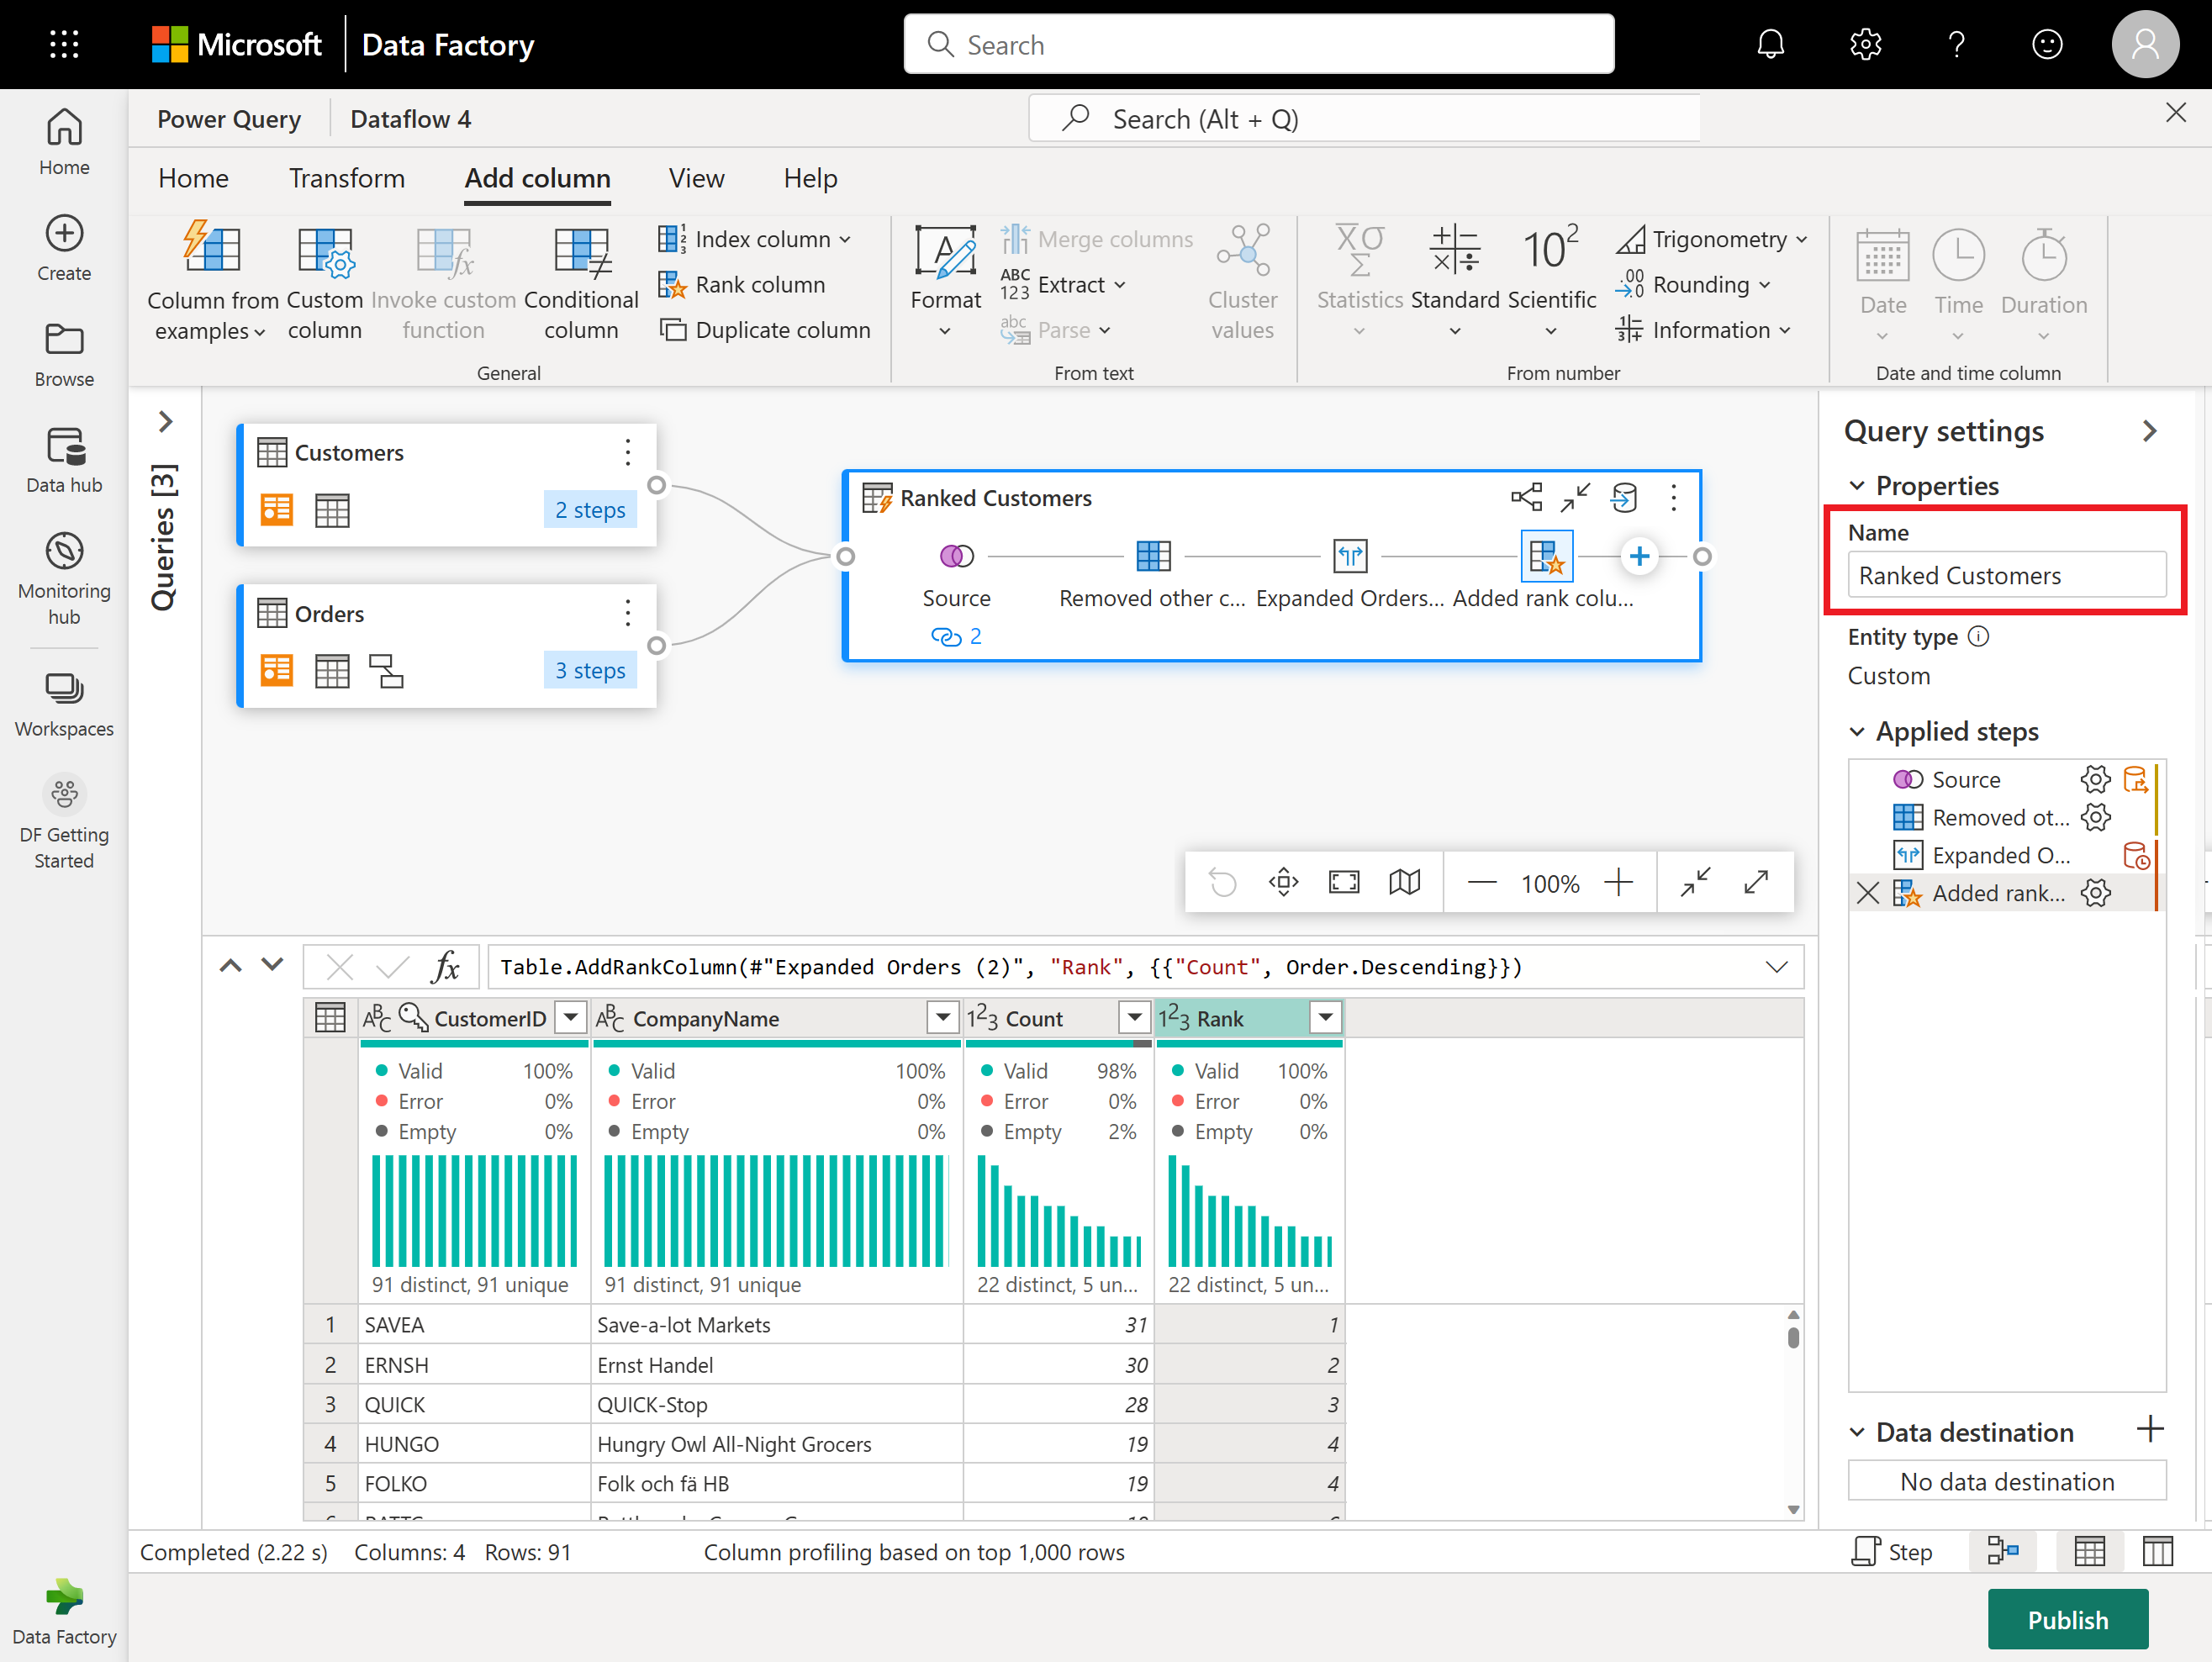
Now let's rank your customers by how many orders they've made. Select the Count column, then go to the Add Column tab and select Rank column. This adds a new column showing each customer's rank based on their order count.
Keep the default settings in Rank Column. Then select OK to apply this transformation.
Now rename the resulting query as Ranked Customers using the Query settings pane on the right side of the screen.
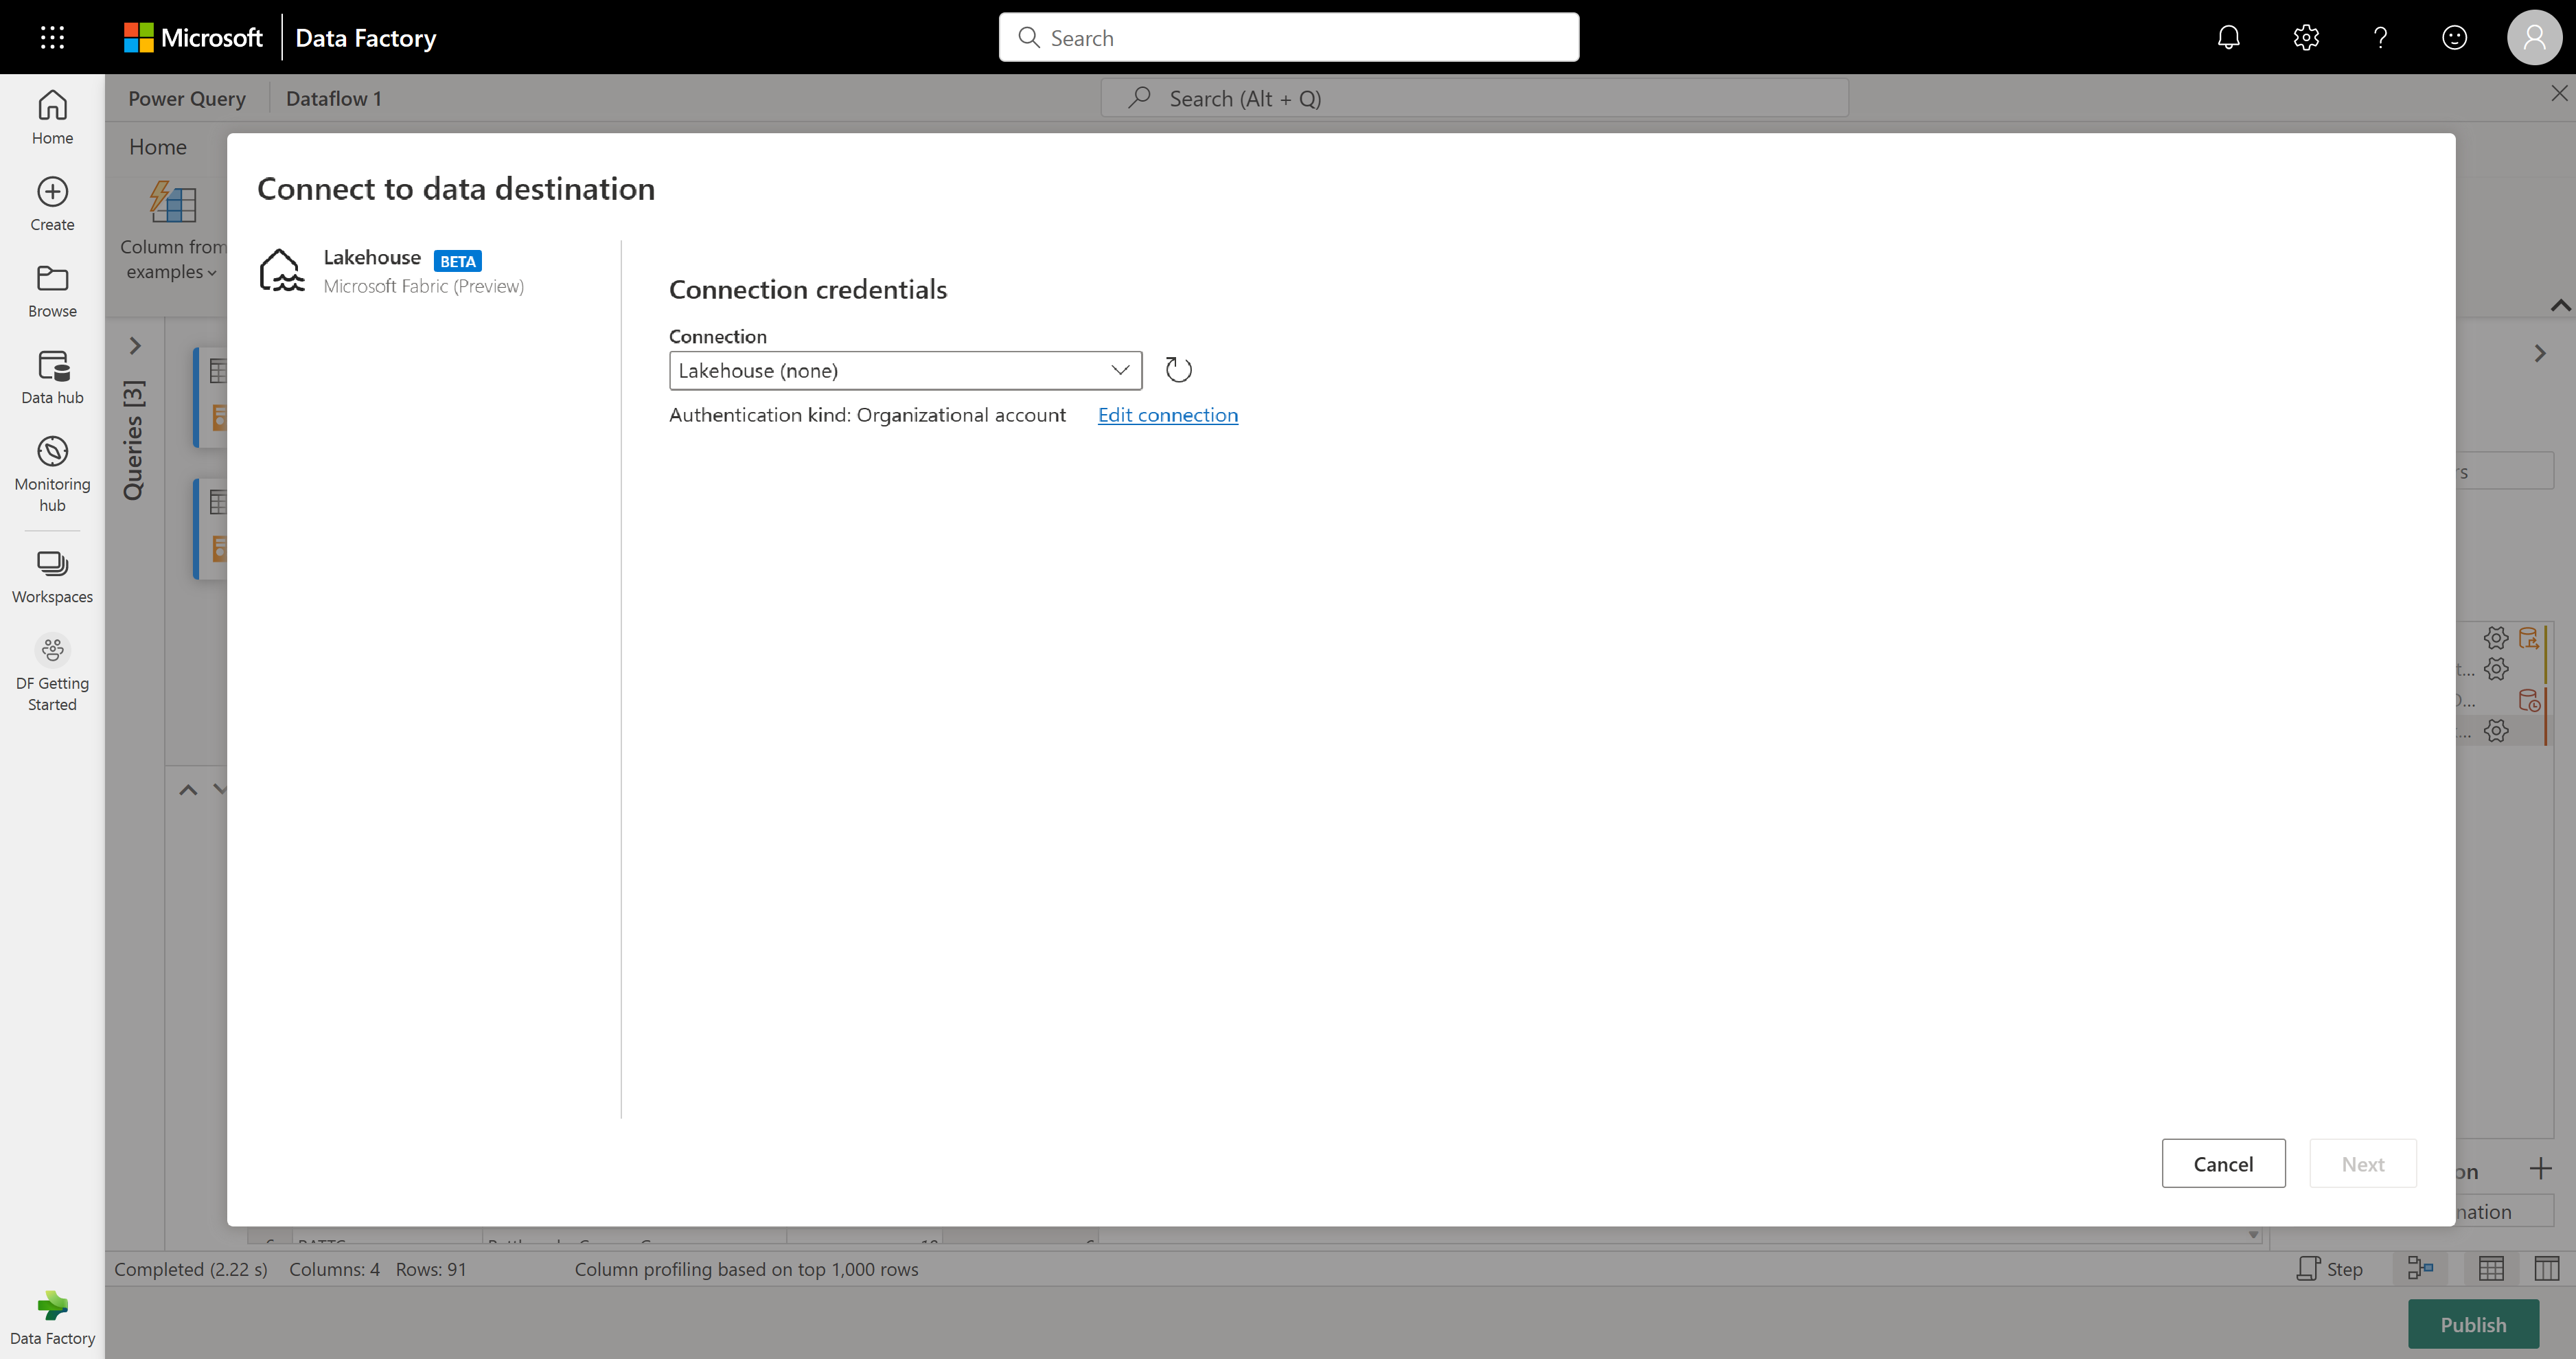
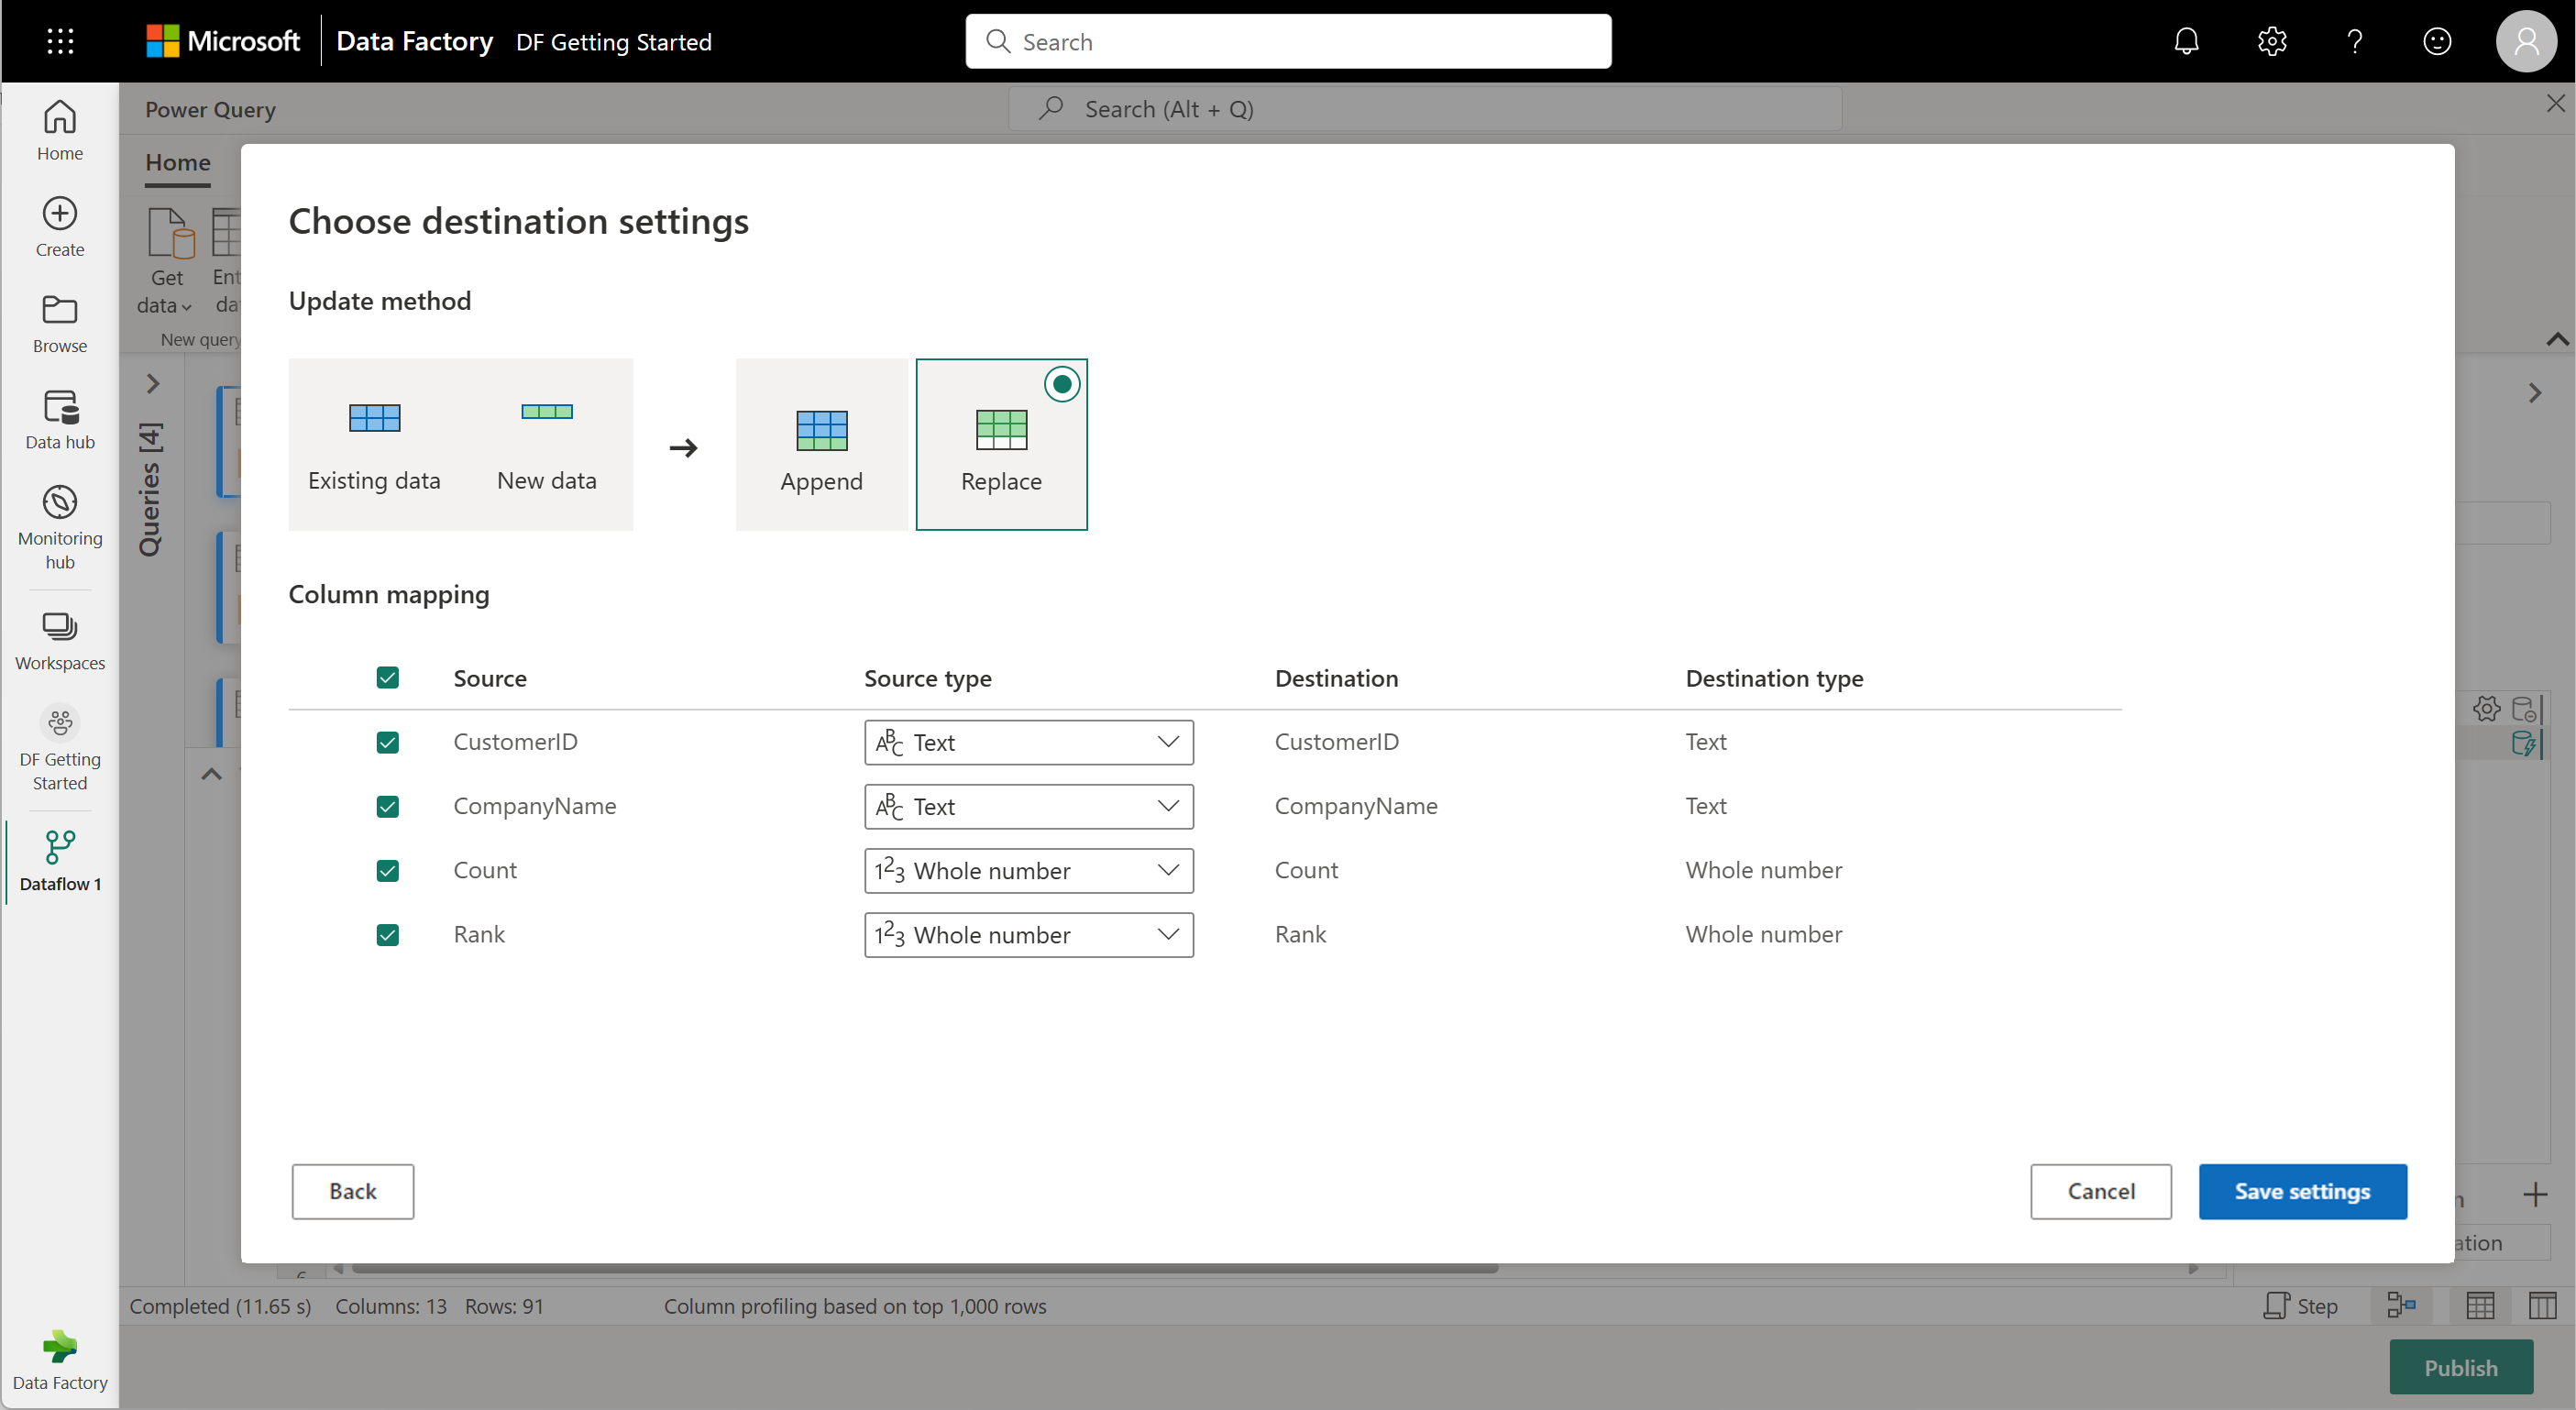
You're ready to set where your data goes. In the Query settings pane, scroll to the bottom and select Choose data destination.
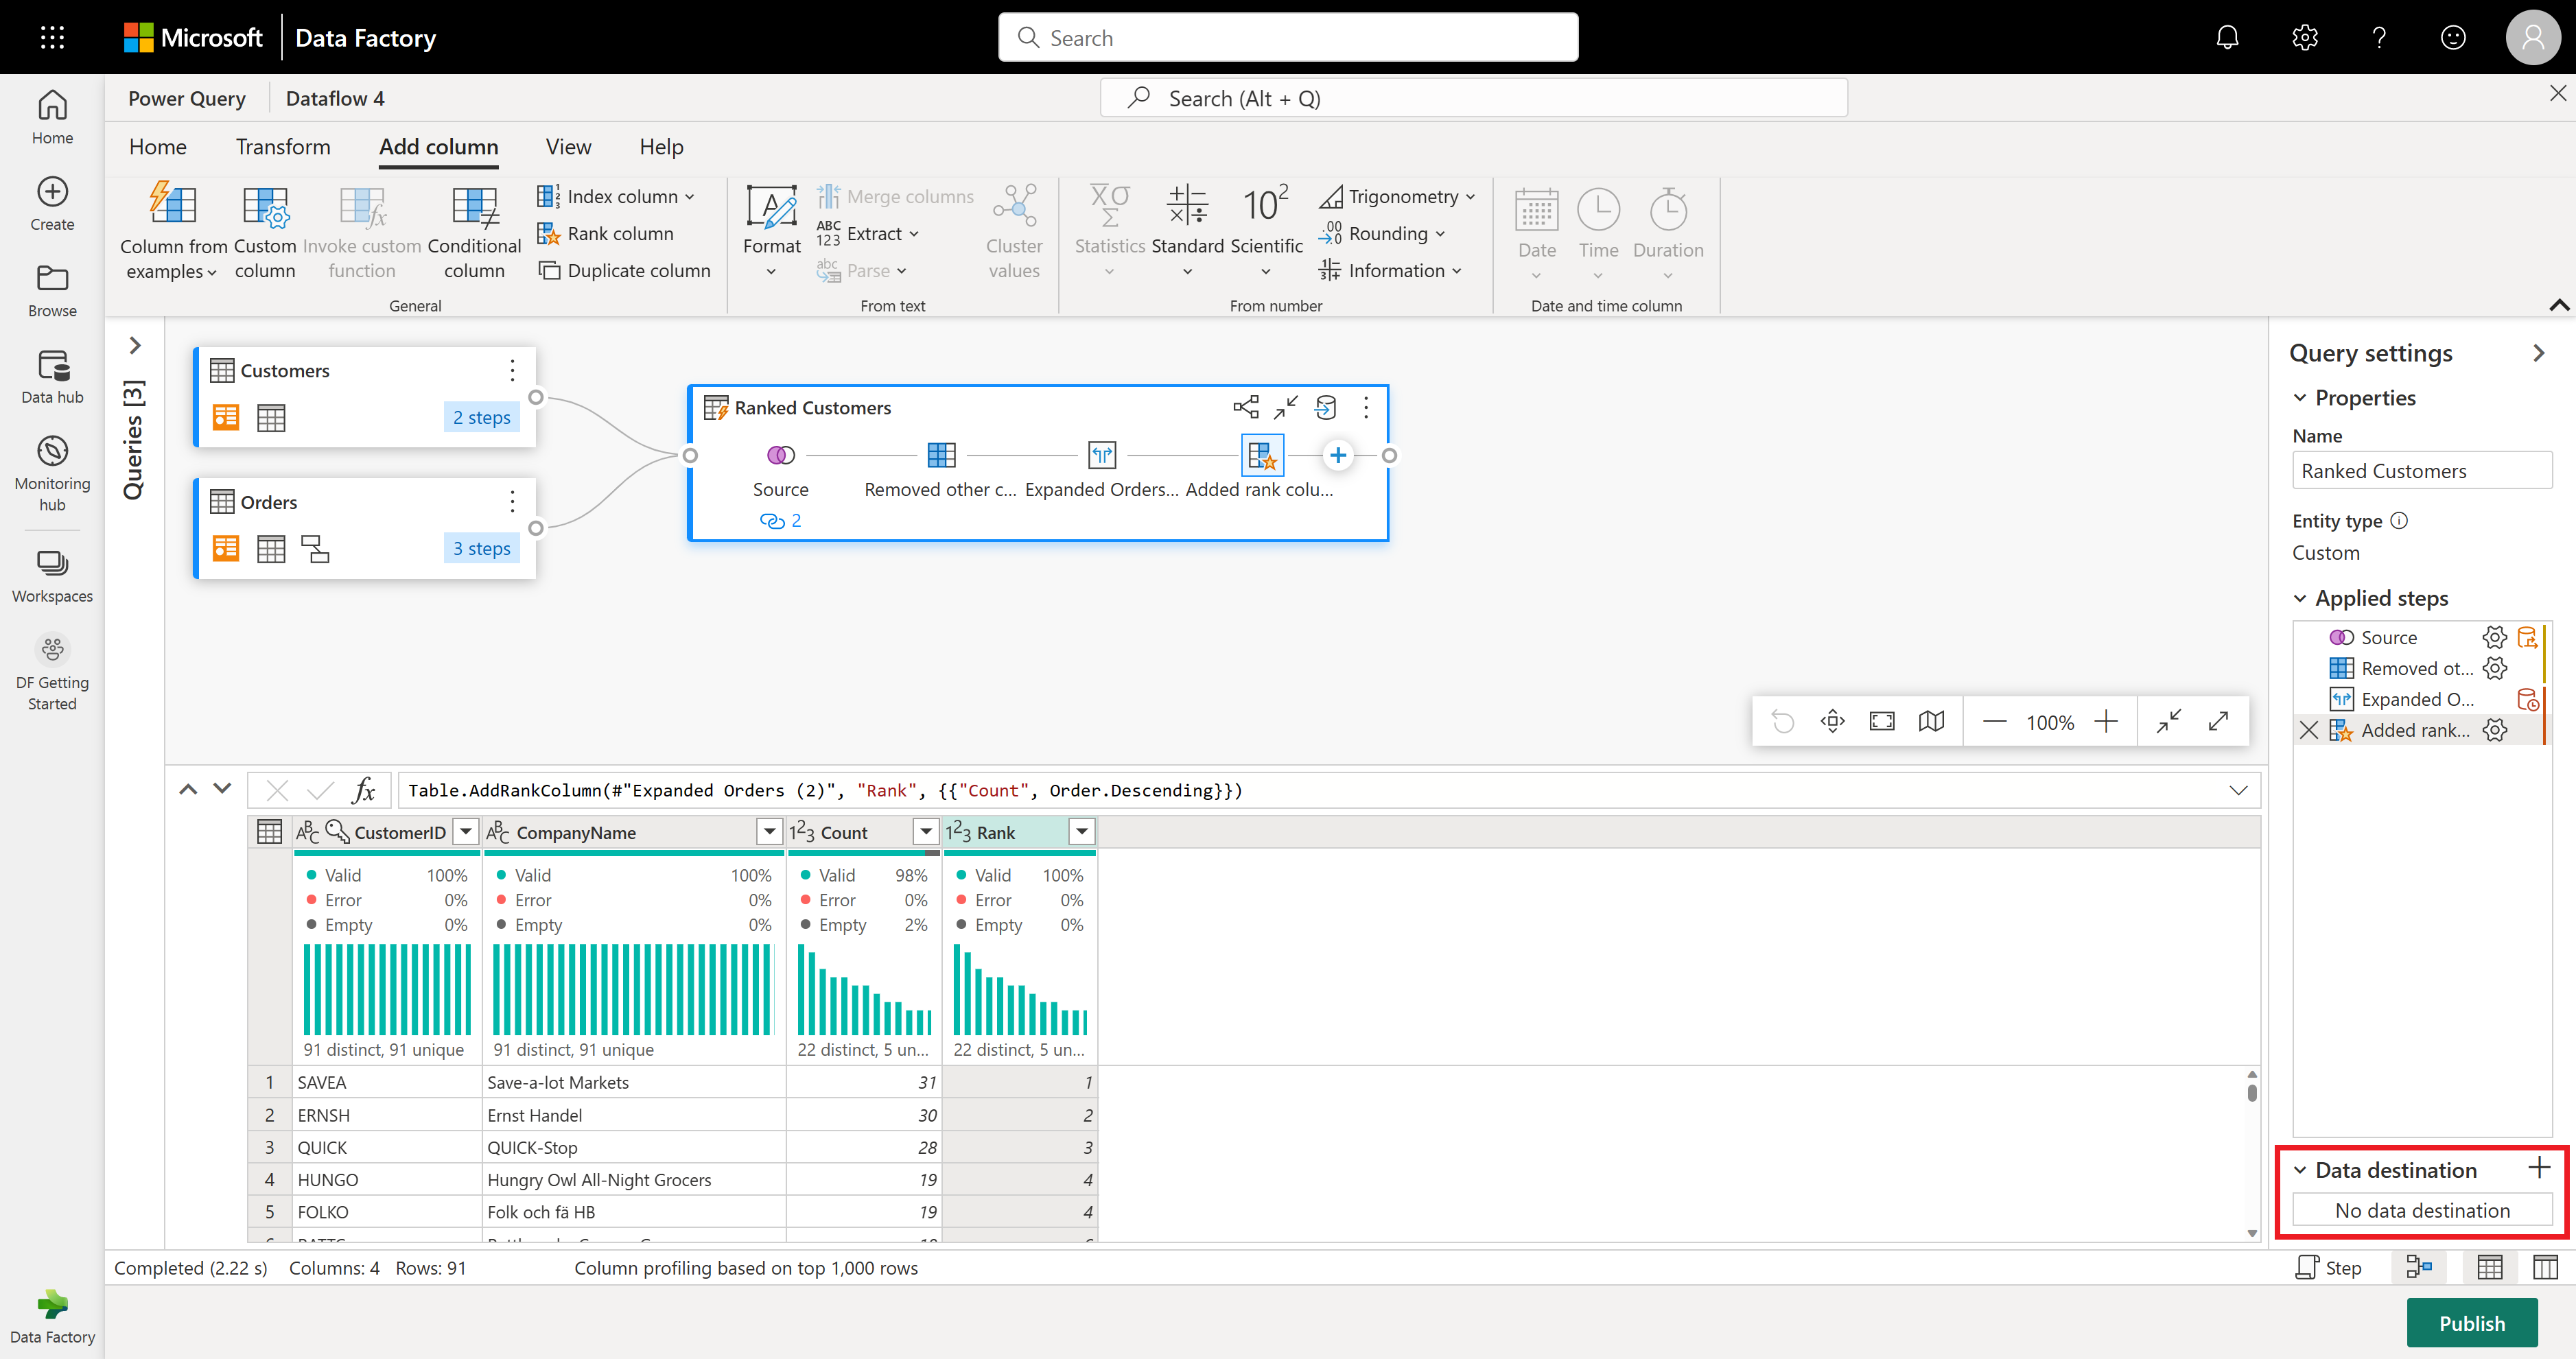
You can send your results to a lakehouse if you have one, or skip this step if you don't. Here, you can pick which lakehouse and table to use for your data, and choose whether to add new data (Append) or replace what's there (Replace).
Your dataflow is now ready to be published. Review the queries in the diagram view, and then select Publish.
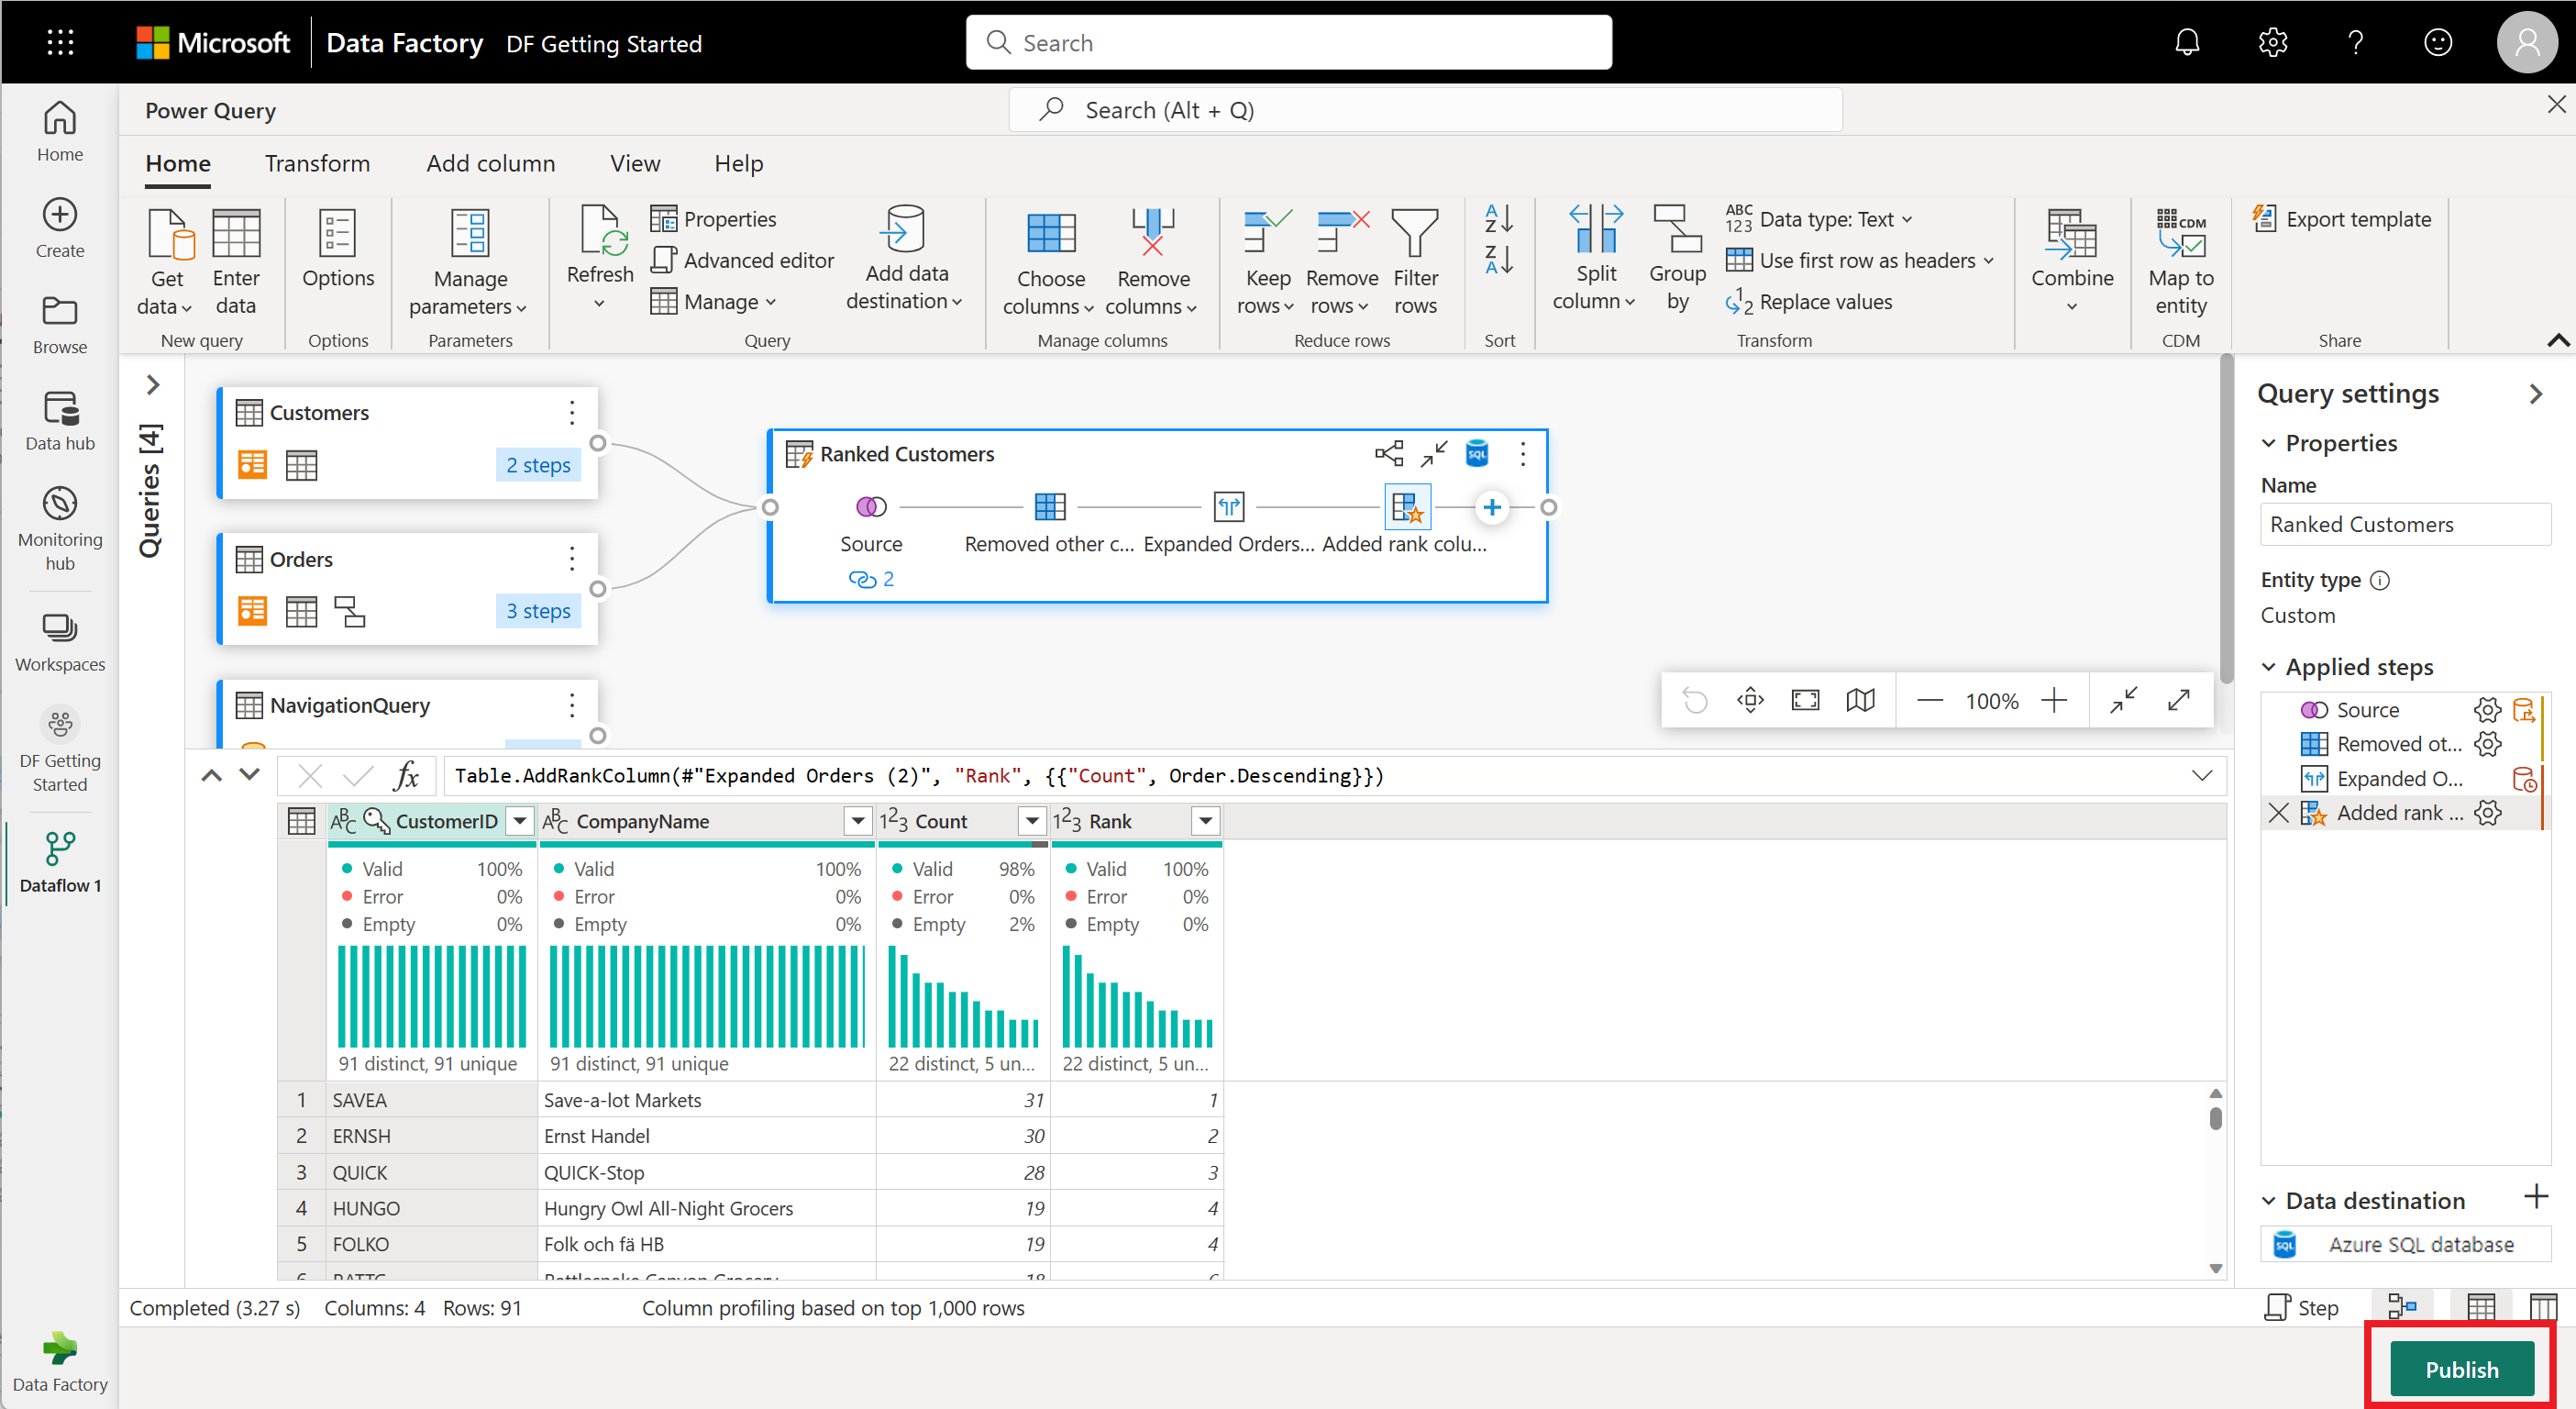
Select Publish in the lower-right corner to save your dataflow. You'll go back to your workspace, where a spinner icon next to your dataflow name shows it's publishing. When the spinner disappears, your dataflow's ready to refresh!
Important
The first time you create a Dataflow Gen2 in a workspace, Fabric sets up some background items (Lakehouse and Warehouse) that help your dataflow run. These items are shared by all dataflows in the workspace, and you shouldn't delete them. They're not meant to be used directly and usually aren't visible in your workspace, but you might see them in other places like Notebooks or SQL analytics. Look for names that start with
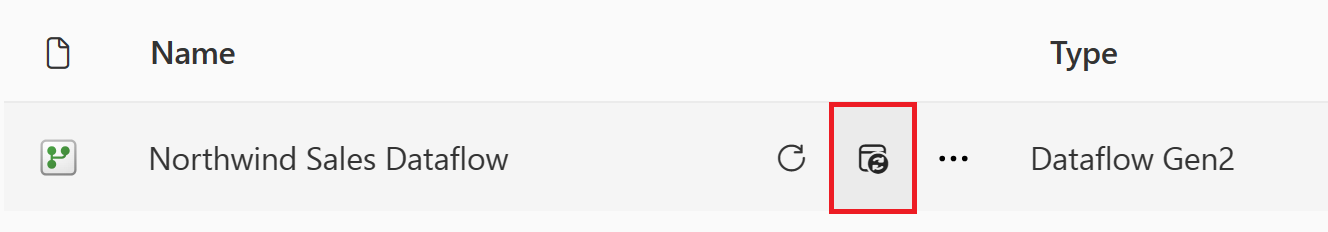
DataflowStagingto spot them.In your workspace, select the Schedule Refresh icon.
Turn on the scheduled refresh, select Add another time, and configure the refresh as shown in the following screenshot.
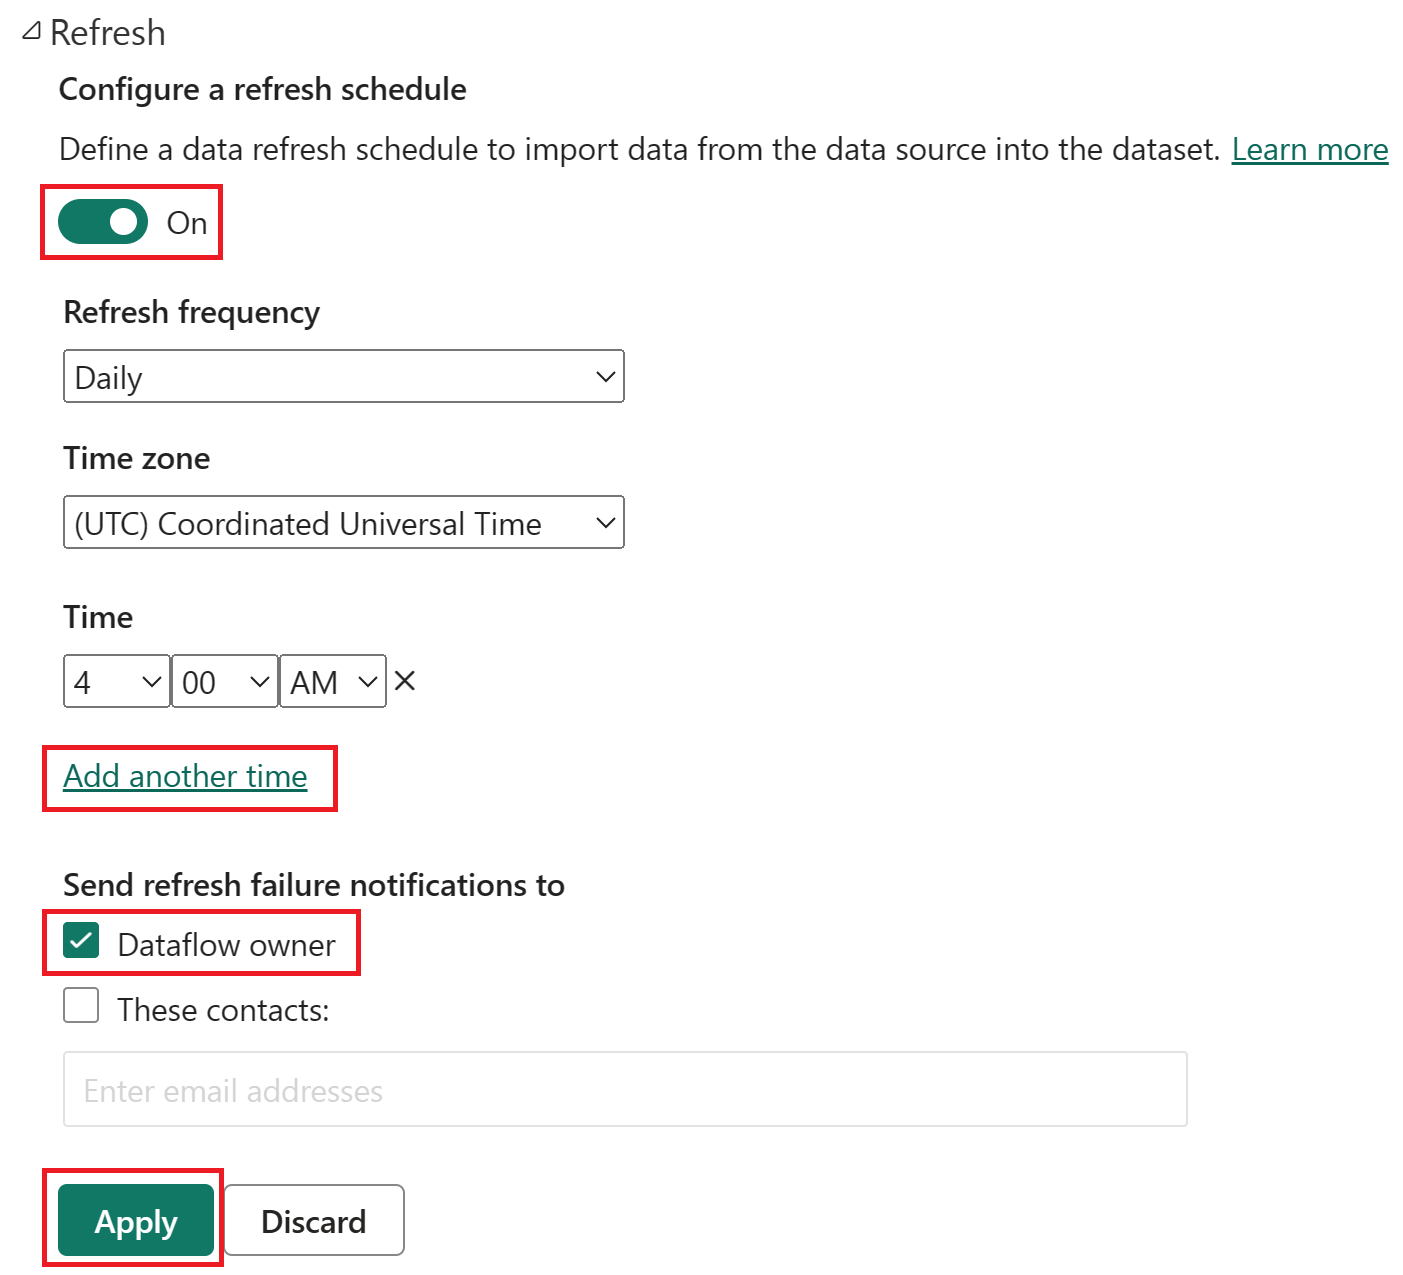
Screenshot of the scheduled refresh options, with scheduled refresh turned on, the refresh frequency set to Daily, the Time zone set to coordinated universal time, and the Time set to 4:00 AM. The on button, the Add another time selection, the dataflow owner, and the apply button are all emphasized.


Clean up resources
If you're not going to continue to use this dataflow, delete the dataflow using the following steps:
Navigate to your Microsoft Fabric workspace.
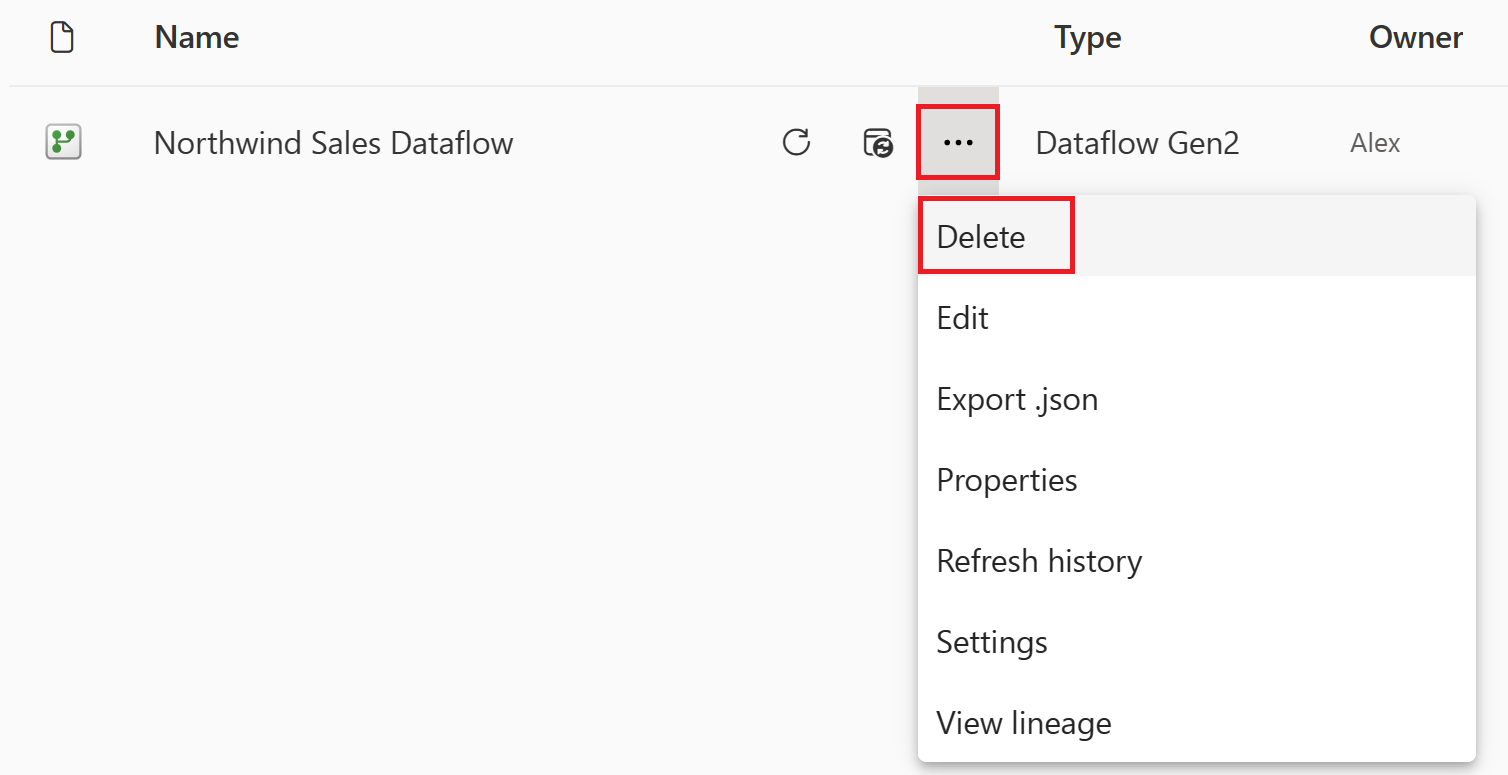
Select the vertical ellipsis next to the name of your dataflow and then select Delete.
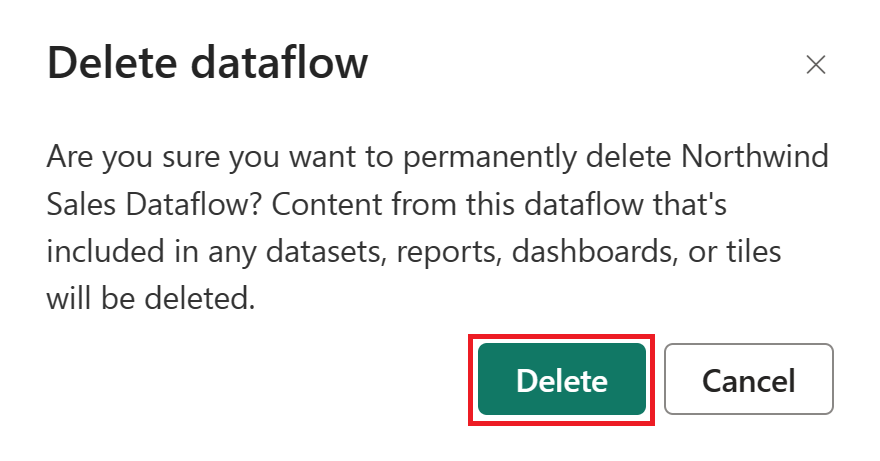
Select Delete to confirm the deletion of your dataflow.
Related content
The dataflow in this sample shows you how to load and transform data in Dataflow Gen2. You learned how to:
- Create a Dataflow Gen2.
- Transform data.
- Configure destination settings for transformed data.
- Run and schedule your pipeline.
Advance to the next article to learn how to create your first pipeline.