Events
Power BI DataViz World Championships
14 Feb, 4 pm - 31 Mar, 4 pm
With 4 chances to enter, you could win a conference package and make it to the LIVE Grand Finale in Las Vegas
Learn moreThis browser is no longer supported.
Upgrade to Microsoft Edge to take advantage of the latest features, security updates, and technical support.
You can connect to multidimensional semantic models in Power BI, and create reports that visualize all sorts of data within the model. With multidimensional semantic models, Power BI applies rules to how it processes data, based on which column is defined as the default member.
With multidimensional semantic models, Power BI handles data from the model based on where the column that contains the Default Member is used. The DefaultMember property value for an attribute hierarchy is set in CSDL (Conceptual Schema Definition Language) for a particular column in a multidimensional model. For more information about the default member, see Attribute properties - Define a default member. When a data analysis expression (DAX) query is executed, the default member specified in the model is applied automatically.
This article describes how Power BI behaves under various circumstances when working with multidimensional semantic models, based on where the default member is found.
When you create a filter card on a field with a default member, the default member field value is selected automatically in the filter card. The result is that all visuals affected by the filter card retain their default models in the database. The values in such filter cards reflect that default member.
If the default member is removed, deselecting the value clears it for all visuals to which the filter card applies, and the values displayed don't reflect the default member.
For example, imagine we have a Currency column and a default member set to USD:
In Power BI, whenever you group a visual on a column that has a default member, Power BI clears the default member for that column and its attribute relationship path. This behavior ensures the visual displays all values, instead of just the default values.
Attribute relationship paths (ARPs) provide default members with powerful capabilities, but also introduce a certain amount of complexity. When ARPs are encountered, Power BI follows the path of ARPs to clear other default members for other columns to provide consistent, and precise handling of data for visuals.
Let's look at an example to clarify the behavior. Consider the following configuration of ARPs:

Now let's imagine that the following default members are set for these columns:
Now let's examine what happens when each column is used in Power BI. When visuals group on the following columns, here are the results:
Note
Population isn't in the ARP path of City, it's solely related to State and thus Power BI doesn't clear it.
Groups displayed in the visual have their entire ARP path cleared.
If a group isn't displayed in the visual, but is part of the ARP path of another grouped-on column, the following applies:
When you work with slicers or filter cards, the following behavior occurs:
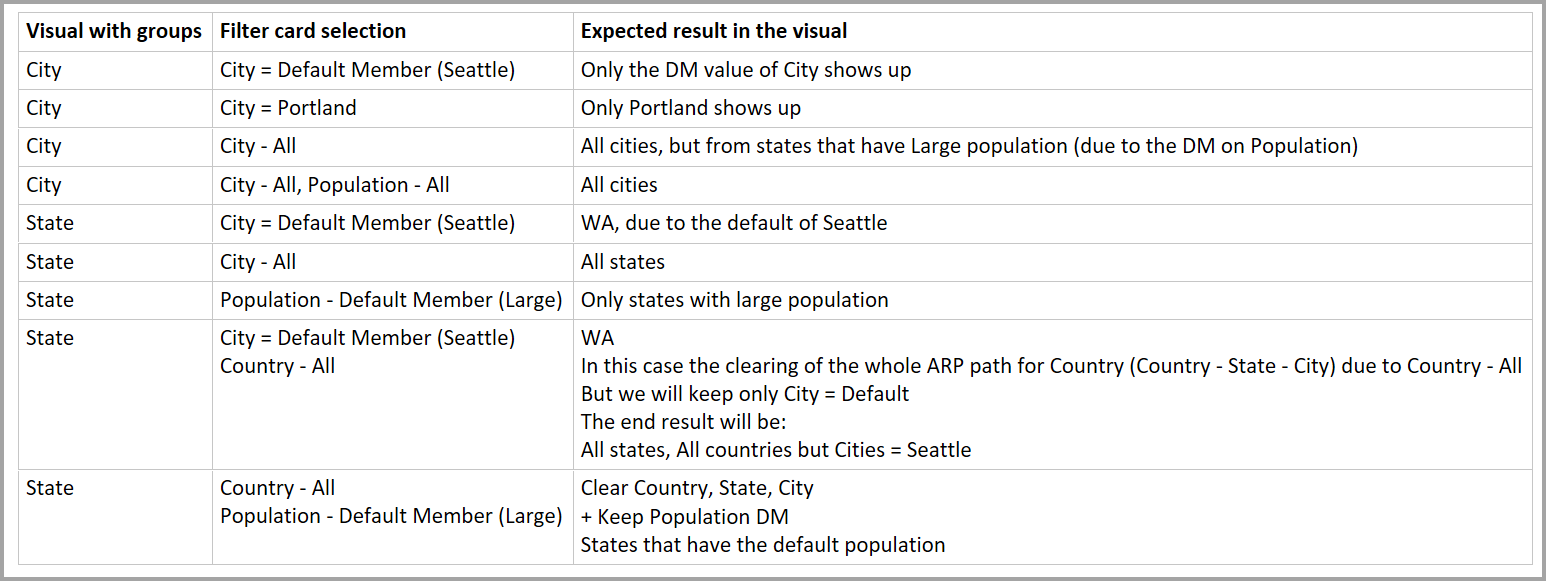
Since slicers and filter cards are often used to interact with other visuals, the logic of clearing default members for the affected visuals occurs as explained in the following table.
For this table, we use the same example data from earlier in this article:
The following rules apply to the way Power BI behaves in these circumstances.
Power BI clears a default member for a specified column, if:
Power BI doesn't clear a default member for a specified column, if:
This article described the behavior of Power BI when working with default members in multidimensional semantic models. You might also be interested in the following articles:
Events
Power BI DataViz World Championships
14 Feb, 4 pm - 31 Mar, 4 pm
With 4 chances to enter, you could win a conference package and make it to the LIVE Grand Finale in Las Vegas
Learn moreTraining
Certification
Microsoft Certified: Power BI Data Analyst Associate - Certifications
Demonstrate methods and best practices that align with business and technical requirements for modeling, visualizing, and analyzing data with Microsoft Power BI.
Documentation
Use composite models in Power BI Desktop - Power BI
Learn how to create data models with multiple data connections and many-to-many relationships in Power BI Desktop.
Semantic model modes in the Power BI service - Power BI
Understand Power BI service semantic model modes, Import, DirectQuery, and Composite, including the rationale for each mode.
What's the difference between live connections and DirectQuery? - Power BI
See a comparison between live connections and DirectQuery