Row-level security (RLS) guidance in Power BI Desktop
This article targets you as a data modeler working with Power BI Desktop. It describes good design practices for enforcing row-levels security (RLS) in your data models.
It's important to understand RLS filters table rows. They can't be configured to restrict access to model objects, including tables, columns, or measures.
Note
This article doesn't describe RLS or how to set it up. For more information, see Restrict data access with row-level security (RLS) for Power BI Desktop.
Also, it doesn't cover enforcing RLS in live connections to external-hosted models with Azure Analysis Services or SQL Server Analysis Services. In these cases, RLS is enforced by Analysis Services. When Power BI connects using single-sign on (SSO), Analysis Services will enforce RLS (unless the account has admin privileges).
Create roles
It's possible to create multiple roles. When you're considering the permission needs for a single report user, strive to create a single role that grants all those permissions, instead of a design where a report user will be a member of multiple roles. It's because a report user could map to multiple roles, either directly by using their user account or indirectly by security group membership. Multiple role mappings can result in unexpected outcomes.
When a report user is assigned to multiple roles, RLS filters become additive. It means report users can see table rows that represent the union of those filters. What's more, in some scenarios it's not possible to guarantee that a report user doesn't see rows in a table. So, unlike permissions applied to SQL Server database objects (and other permission models), the "once denied always denied" principle doesn't apply.
Consider a model with two roles: The first role, named Workers, restricts access to all Payroll table rows by using the following rule expression:
FALSE()
Note
A rule will return no table rows when its expression evaluates to FALSE.
Yet, a second role, named Managers, allows access to all Payroll table rows by using the following rule expression:
TRUE()
Take care: Should a report user map to both roles, they'll see all Payroll table rows.
Optimize RLS
RLS works by automatically applying filters to every DAX query, and these filters may have a negative impact on query performance. So, efficient RLS comes down to good model design. It's important to follow model design guidance, as discussed in the following articles:
- Understand star schema and the importance for Power BI
- All relationship guidance articles found in the Power BI guidance documentation
In general, it's often more efficient to enforce RLS filters on dimension-type tables, and not fact-type tables. And, rely on well-designed relationships to ensure RLS filters propagate to other model tables. RLS filters only propagate through active relationships. So, avoid using the LOOKUPVALUE DAX function when model relationships could achieve the same result.
Whenever RLS filters are enforced on DirectQuery tables and there are relationships to other DirectQuery tables, be sure to optimize the source database. It can involve designing appropriate indexes or using persisted computed columns. For more information, see DirectQuery model guidance in Power BI Desktop.
Measure RLS impact
It's possible to measure the performance impact of RLS filters in Power BI Desktop by using Performance Analyzer. First, determine report visual query durations when RLS isn't enforced. Then, use the View As command on the Modeling ribbon tab to enforce RLS and determine and compare query durations.
Configure role mappings
Once published to Power BI, you must map members to semantic model (previously known as a dataset) roles. Only semantic model owners or workspace admins can add members to roles. For more information, see Row-level security (RLS) with Power BI (Manage security on your model).
Members can be user accounts, security groups, distribution groups or mail enabled groups. Whenever possible, we recommend you map security groups to semantic model roles. It involves managing security group memberships in Microsoft Entra ID (previously known as Azure Active Directory). Possibly, it delegates the task to your network administrators.
Validate roles
Test each role to ensure it filters the model correctly. It's easily done by using the View As command on the Modeling ribbon tab.
When the model has dynamic rules using the USERNAME DAX function, be sure to test for expected and unexpected values. When embedding Power BI content—specifically using the embed for your customers scenario—app logic can pass any value as an effective identity user name. Whenever possible, ensure accidental or malicious values result in filters that return no rows.
Consider an example using Power BI embedded, where the app passes the user's job role as the effective user name: It's either "Manager" or "Worker". Managers can see all rows, but workers can only see rows where the Type column value is "Internal".
The following rule expression is defined:
IF(
    USERNAME() = "Worker",
    [Type] = "Internal",
    TRUE()
)
The problem with this rule expression is that all values, except "Worker", return all table rows. So, an accidental value, like "Wrker", unintentionally returns all table rows. Therefore, it's safer to write an expression that tests for each expected value. In the following improved rule expression, an unexpected value results in the table returning no rows.
IF(
    USERNAME() = "Worker",
    [Type] = "Internal",
    IF(
        USERNAME() = "Manager",
        TRUE(),
        FALSE()
    )
)
Design partial RLS
Sometimes, calculations need values that aren't constrained by RLS filters. For example, a report may need to display a ratio of revenue earned for the report user's sales region over all revenue earned.
While it's not possible for a DAX expression to override RLS—in fact, it can't even determine that RLS is enforced—you can use a summary model table. The summary model table is queried to retrieve revenue for "all regions" and it's not constrained by any RLS filters.
Let's see how you could implement this design requirement. First, consider the following model design:
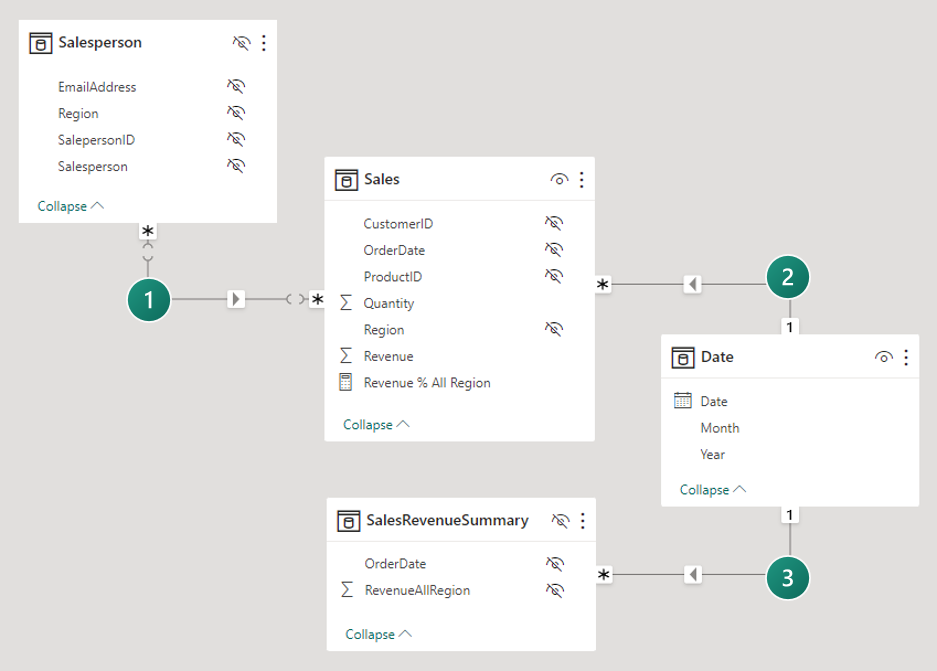
The model comprises four tables:
- The Salesperson table stores one row per salesperson. It includes the EmailAddress column, which stores the email address for each salesperson. This table is hidden.
- The Sales table stores one row per order. It includes the Revenue % All Region measure, which is designed to return a ratio of revenue earned by the report user's region over revenue earned by all regions.
- The Date table stores one row per date and allows filtering and grouping year and month.
- The SalesRevenueSummary is a calculated table. It stores total revenue for each order date. This table is hidden.
The following expression defines the SalesRevenueSummary calculated table:
SalesRevenueSummary =
SUMMARIZECOLUMNS(
    Sales[OrderDate],
    "RevenueAllRegion", SUM(Sales[Revenue])
)
Note
An aggregation table could achieve the same design requirement.
The following RLS rule is applied to the Salesperson table:
[EmailAddress] = USERNAME()
Each of the three model relationships is described in the following table:
| Relationship | Description |
|---|---|
 |
There's a many-to-many relationship between the Salesperson and Sales tables. The RLS rule filters the EmailAddress column of the hidden Salesperson table by using the USERNAME DAX function. The Region column value (for the report user) propagates to the Sales table. |
 |
There's a one-to-many relationship between the Date and Sales tables. |
 |
There's a one-to-many relationship between the Date and SalesRevenueSummary tables. |
The following expression defines the Revenue % All Region measure:
Revenue % All Region =
DIVIDE(
    SUM(Sales[Revenue]),
    SUM(SalesRevenueSummary[RevenueAllRegion])
)
Note
Take care to avoid disclosing sensitive facts. If there are only two regions in this example, then it would be possible for a report user to calculate revenue for the other region.
When to avoid using RLS
Sometimes it makes sense to avoid using RLS. If you have only a few simplistic RLS rules that apply static filters, consider publishing multiple semantic models instead. None of the semantic models define roles because each semantic model contains data for a specific report user audience, which has the same data permissions. Then, create one workspace per audience and assign access permissions to the workspace or app.
For example, a company that has just two sales regions decides to publish a semantic model for each sales region to different workspaces. The semantic models don't enforce RLS. They do, however, use query parameters to filter source data. This way, the same model is published to each workspace—they just have different semantic model parameter values. Salespeople are assigned access to just one of the workspaces (or published apps).
There are several advantages associated with avoiding RLS:
- Improved query performance: It can result in improved performance due to fewer filters.
- Smaller models: While it results in more models, they're smaller in size. Smaller models can improve query and data refresh responsiveness, especially if the hosting capacity experiences pressure on resources. Also, it's easier to keep model sizes below size limits imposed by your capacity. Lastly, it's easier to balance workloads across different capacities, because you can create workspaces on—or move workspaces to—different capacities.
- Additional features: Power BI features that don't work with RLS, like Publish to web, can be used.
However, there are disadvantages associated with avoiding RLS:
- Multiple workspaces: One workspace is required for each report user audience. If apps are published, it also means there's one app per report user audience.
- Duplication of content: Reports and dashboards must be created in each workspace. It requires more effort and time to set up and maintain.
- High privilege users: High privilege users, who belong to multiple report user audiences, can't see a consolidated view of the data. They'll need to open multiple reports (from different workspaces or apps).
Troubleshoot RLS
If RLS produces unexpected results, check for the following issues:
- Incorrect relationships exist between model tables, in terms of column mappings and filter directions. Keep in mind that RLS filters only propagate through active relationships.
- The Apply security filter in both directions relationship property isn't correctly set. For more information, see Bi-directional relationship guidance.
- Tables contain no data.
- Incorrect values are loaded into tables.
- The user is mapped to multiple roles.
- The model includes aggregation tables, and RLS rules don't consistently filter aggregations and details. For more information, see Use aggregations in Power BI Desktop (RLS for aggregations).
When a specific user can't see any data, it could be because their UPN isn't stored or it's entered incorrectly. It can happen abruptly because their user account has changed as the result of a name change.
Tip
For testing purposes, add a measure that returns the USERNAME DAX function. You might name it something like "Who Am I". Then, add the measure to a card visual in a report and publish it to Power BI.
Creators and consumers with only Read permission on the semantic model will only be able to view the data they're allowed to see (based on their RLS role mapping).
When a user views a report in either a workspace or an app, RLS might or might not be enforced depending on their semantic model permissions. For this reason, it's critical that content consumers and creators only possess Read permission on the underlying semantic model when RLS must be enforced. For details about the permissions rules that determine whether RLS is enforced, see the Report consumer security planning article.
Related content
For more information related to this article, check out the following resources:
- Row-level security (RLS) with Power BI
- Restrict data access with row-level security (RLS) for Power BI Desktop
- Model relationships in Power BI Desktop
- Power BI implementation planning: Report consumer security planning
- Questions? Try asking the Power BI Community
- Suggestions? Contribute ideas to improve Power BI
Feedback
Coming soon: Throughout 2024 we will be phasing out GitHub Issues as the feedback mechanism for content and replacing it with a new feedback system. For more information see: https://aka.ms/ContentUserFeedback.
Submit and view feedback for