Query the activity log
In the Azure portal, you can filter your Azure Monitor activity logs so you can view specific information. The filters enable you to review only the activity log data that meets your criteria. You might set filters to review monitoring data about critical events for your primary subscription and production virtual machine during peak business hours.
Things to know about activity log filters
Let's review some of the filters you can set to control what data to review in your activity log:
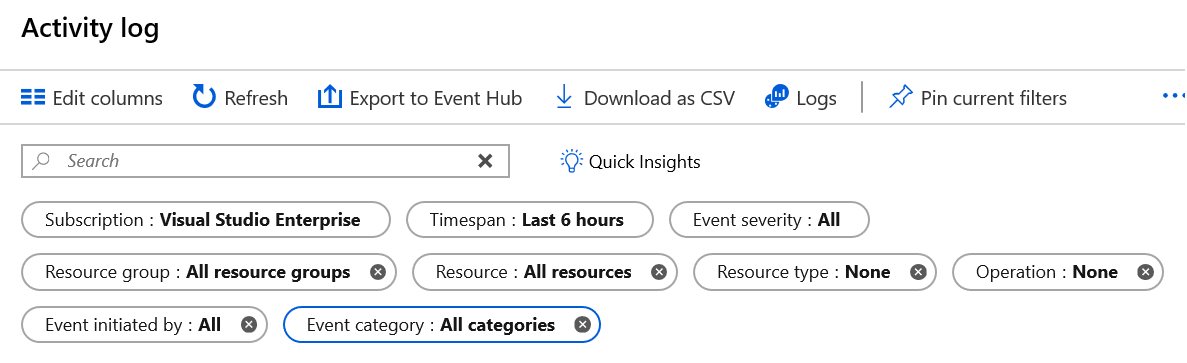
Subscription: Show the data for one or more specified Azure subscription names.
Timespan: Show data for a specified time by choosing the start and end time for events, such as a six-hour period.
Event Severity: Show events at the selected severity levels, including Informational, Warning, Error, or Critical.
Resource group: Show data for one or more specified resource groups within your specified subscriptions.
Resource (name): Show data for the specified resources.
Resource type: Show data for resources of a specified type, such as
Microsoft.Compute/virtualmachines.Operation name: Show data for a selected Azure Resource Manager operation, such as
Microsoft.SQL/servers/Write.Event initiated by: Show operation data for a specified user who performed the operation, referred to as the "caller."
After you define a set of filters, you can pin the filter set to the Azure Monitor dashboard. You can also download your activity log search results as a CSV file.
In addition to the filters, you can enter a text string in the Search box. Azure Monitor tries to match your search string against data returned for all fields in all events that corresponds to your filter settings.
Things to know about event categories
The following table summarizes the categories of events that you can review in your activity logs. The information displayed for events is based on your other filter settings.
| Event category | Event data | Examples |
|---|---|---|
| Administrative | All create, update, delete, and action operations performed through Azure Resource Manager, and any changes to role-based access control (RBAC) in your filtered subscriptions | create virtual machine delete network security group |
| Service Health | All service health events for Azure services and resources connected with your filtered subscriptions, including Action Required, Assisted Recovery, Incident, Maintenance, Information, or Security | SQL Azure in East US is experiencing downtime Azure SQL Data Warehouse Scheduled Maintence Complete |
| Resource Health | All resource health events for your filtered Azure resources, including Available, Unavailable, Degraded, or Unknown, and identified as Platform Initiated or User Initiate | Virtual Machine health status changed to unavailable Web App health status changed to available |
| Alert | All activations of Azure alerts for your filtered subscriptions and resources | CPU % on devVM001 has been over 80 for the past 5 minutes Disk read LessThan 100000 in the last 5 minutes |
| Autoscale | All events related to the operation of the autoscale engine based on any autoscale settings defined for your filtered subscriptions | Autoscale scale up action failed |
| Recommendation | Recommendation events for certain Azure resource types, such as web sites and SQL servers, based on your filtered subscriptions and resources | Recommendations for how to better utilize your resources |
| Security | All alerts generated by Microsoft Defender for Cloud affecting your filtered subscriptions and resources | Suspicious double extension file executed |
| Policy | All effect action operations performed by Azure Policy for your filtered subscriptions and resources, where every action taken by Azure Policy is modeled as an operation on a resource | Audit and Deny |