What are remote network health logs?
Remote networks, such as a branch office, rely on customer premises equipment (CPE) to connect users in those locations to the online resources and services they need. Users expect that CPE to function so they can do their work. To keep everyone connected, you need to ensure the health of the IPSec tunnel and the Border Gateway Protocol (BGP) route advertisement. This long-running tunnel and routing information are the keys to your remote network health.
This article describes several methods for accessing and analyzing the remote network health logs.
- Access logs in the Microsoft Entra admin center or the Microsoft Graph API
- Export logs to Log Analytics or a Security Information and Events Management (SIEM) tool
- Analyze logs using an Azure Workbook for Microsoft Entra
- Download logs for long-term storage
Prerequisites
To view the remote network health logs in the Microsoft Entra admin center, you need:
- One of the following roles: Global Secure Access Administrator, or Security Administrator.
- The Global Secure Access preview requires a Microsoft Entra ID P1 license. If needed, you can purchase licenses or get trial licenses.
- Separate roles are required for accessing the logs with the Microsoft Graph API and integrating with Log Analytics and Azure Workbooks.
View the logs
To view the Remote network health logs, you can use either the Microsoft Entra admin center or the Microsoft Graph API.
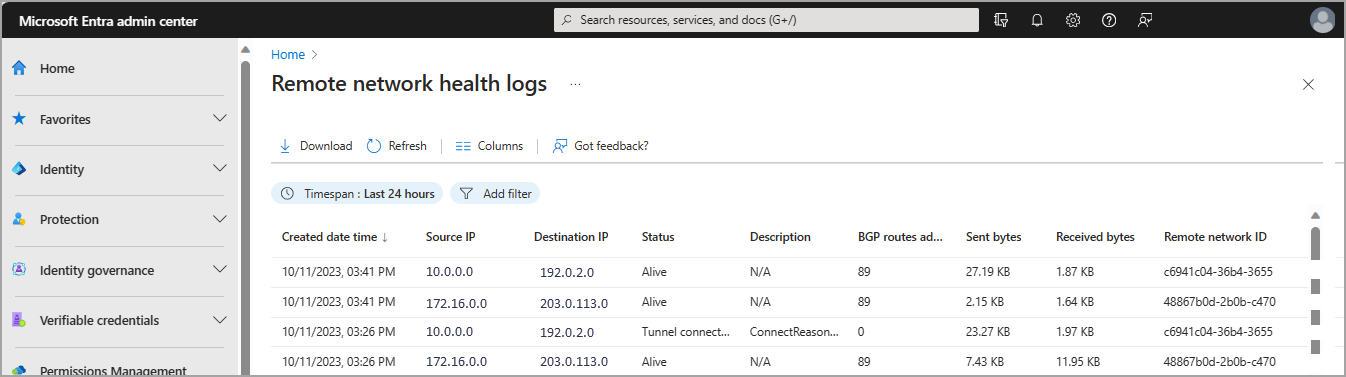
To view Remote network health logs in Microsoft Entra admin center:
Sign in to the Microsoft Entra admin center as at least a Global Secure Access Administrator.
Browse to Global Secure Access (preview) > Monitor > Remote network health logs.
Configure diagnostic settings to export logs
Integrating logs with a SIEM tool like Log Analytics is configured through diagnostic settings in Microsoft Entra ID. This process is covered in detail in the Configure Microsoft Entra diagnostic settings for activity logs article.
To configure diagnostic settings, you need:
- Security Administrator access.
- A Log Analytics workspace.
The basic steps to configure diagnostic settings are as follows:
Sign in to the Microsoft Entra admin center as at least a Security Administrator.
Browse to Identity > Monitoring & health > Diagnostic settings.
Any existing diagnostic settings appear in the table. Select edit settings to change an existing setting, or select Add diagnostic setting to create a new setting.
Provide a name.
Select the
RemoteNetworkHealthLogs(and any other logs) you want to include.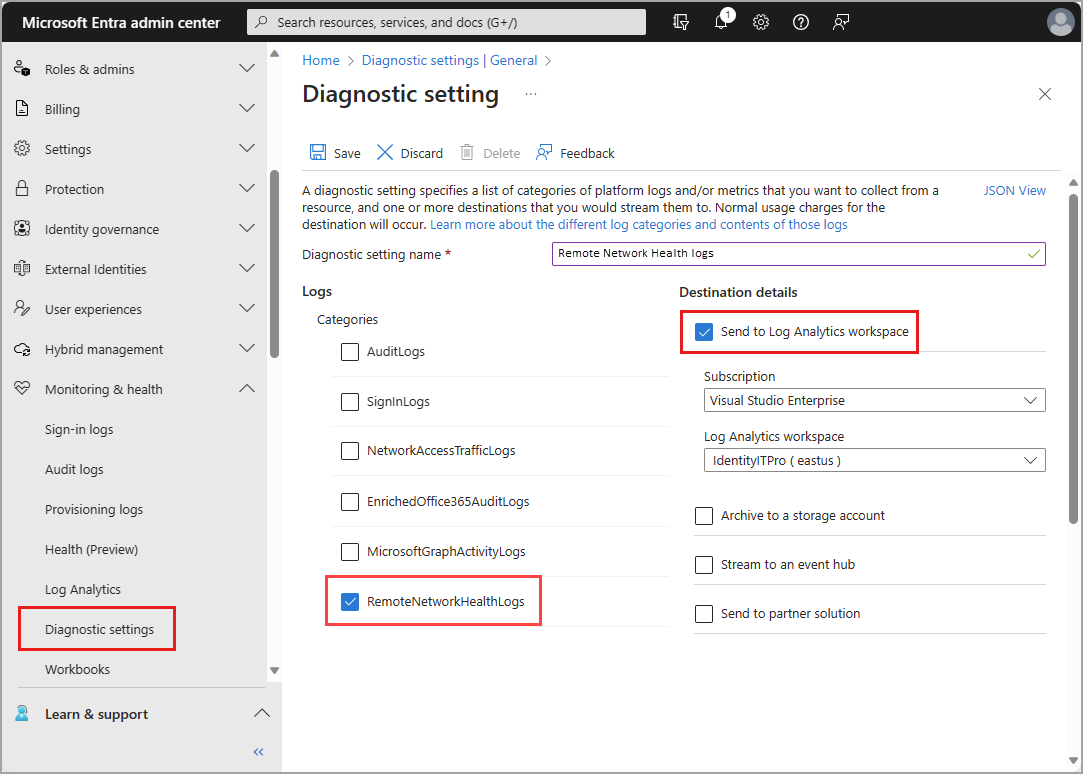
Select the destinations you want to send the logs to.
Select the subscription and the destination from the dropdown menus that appear.
Select the Save button.
Note
It might take up to three days for the logs to start appearing in the destination.
Once your logs are routed to Log Analytics, you can take advantage of the following features:
- Create alert rules to get notified for things like a BGP tunnel failure.
- For more information, see Create an alert rule.
- Visualize the data with an Azure Workbook for Microsoft Entra (covered in the next section).
- Integrate logs with Microsoft Sentinel for security analytics and threat intelligence.
- For more information, follow the Onboard Microsoft Sentinel Quickstart.
Analyze logs with a Workbook
Azure Workbooks for Microsoft Entra provide a visual representation of your data. Once you've configured a Log Analytics workspace and diagnostic settings to integrate your logs with Log Analytics, you can use a Workbook to analyze the data through these powerful tools.
Check out these helpful resources for workbooks:
Download logs
A Download button is available on all logs, both within Global Secure Access and Microsoft Entra Monitoring and health. You can download logs as a JSON or CSV file. For more information, see How to download logs.
To narrow down the results of the logs, select Add filter. You can filter by:
- Description
- Remote network ID
- Source IP
- Destination IP
- BGP routes advertised count
The following table describes each of the fields in the Remote network health logs.
| Name | Description |
|---|---|
| Created date time | Time of original event generation |
| Source IP Address | The IP address of the CPE. The Source IP/Destination IP address pair is unique for each IPsec tunnel. |
| Destination IP Address | The IP address of the Microsoft Entra gateway. The Source IP/Destination IP address pair is unique for each IPsec tunnel. |
| Status | Tunnel connected: This event is generated when an IPsec tunnel is successfully established. Tunnel disconnected: This event is generated when an IPsec tunnel is disconnected. BGP connected: This event is generated when a BGP connectivity is successfully established. BGP disconnected: This event is generated when a BGP connectivity goes down. Remote network alive: This periodic statistic is generated every 15 minutes for all the active tunnels. |
| Description | Optional description of the event. |
| BGP Routes Advertised Count | Optional count of BGP routes advertised over the IPsec tunnel. This value is 0 for Tunnel connected, Tunnel disconnected, BGP connected, and BGP disconnected events. |
| Sent Bytes | Optional number of bytes sent from source to destination over a tunnel during the last 15 minutes. This value is 0 for Tunnel connected, Tunnel disconnected, BGP connected, and BGP disconnected events. |
| Received Bytes | Optional number of bytes received by source from destination over a tunnel during the last 15 minutes. This value is 0 for Tunnel connected, Tunnel disconnected, BGP connected, and BGP disconnected events. |
| Remote network ID | ID of the remote network the tunnel is associated with. |
Next steps
Feedback
Coming soon: Throughout 2024 we will be phasing out GitHub Issues as the feedback mechanism for content and replacing it with a new feedback system. For more information see: https://aka.ms/ContentUserFeedback.
Submit and view feedback for