Events
17 Mar, 9 pm - 21 Mar, 10 am
Join the meetup series to build scalable AI solutions based on real-world use cases with fellow developers and experts.
Register nowThis browser is no longer supported.
Upgrade to Microsoft Edge to take advantage of the latest features, security updates, and technical support.
Azure DevOps Services
The pool consumption report enables you to view jobs running in your agent pools graphed with agent pool job concurrency over a span of up to 30 days. You can use this information to help decide whether your jobs aren't running because of concurrency limits. If you have many jobs queued or running jobs at the concurrency or online agents limit, you may wish to purchase additional parallel jobs or provision more self-hosted agents.
Important
You must be a member of the Project Collection Administrators group to view the pool consumption reports for agent pools in an organization, including project level reports in that organization.
The pool consumption report is part of the Analytics tab for an agent pool and contains the following charts, depending on the agent pool type.
| Chart type | Description | Agent pool type |
|---|---|---|
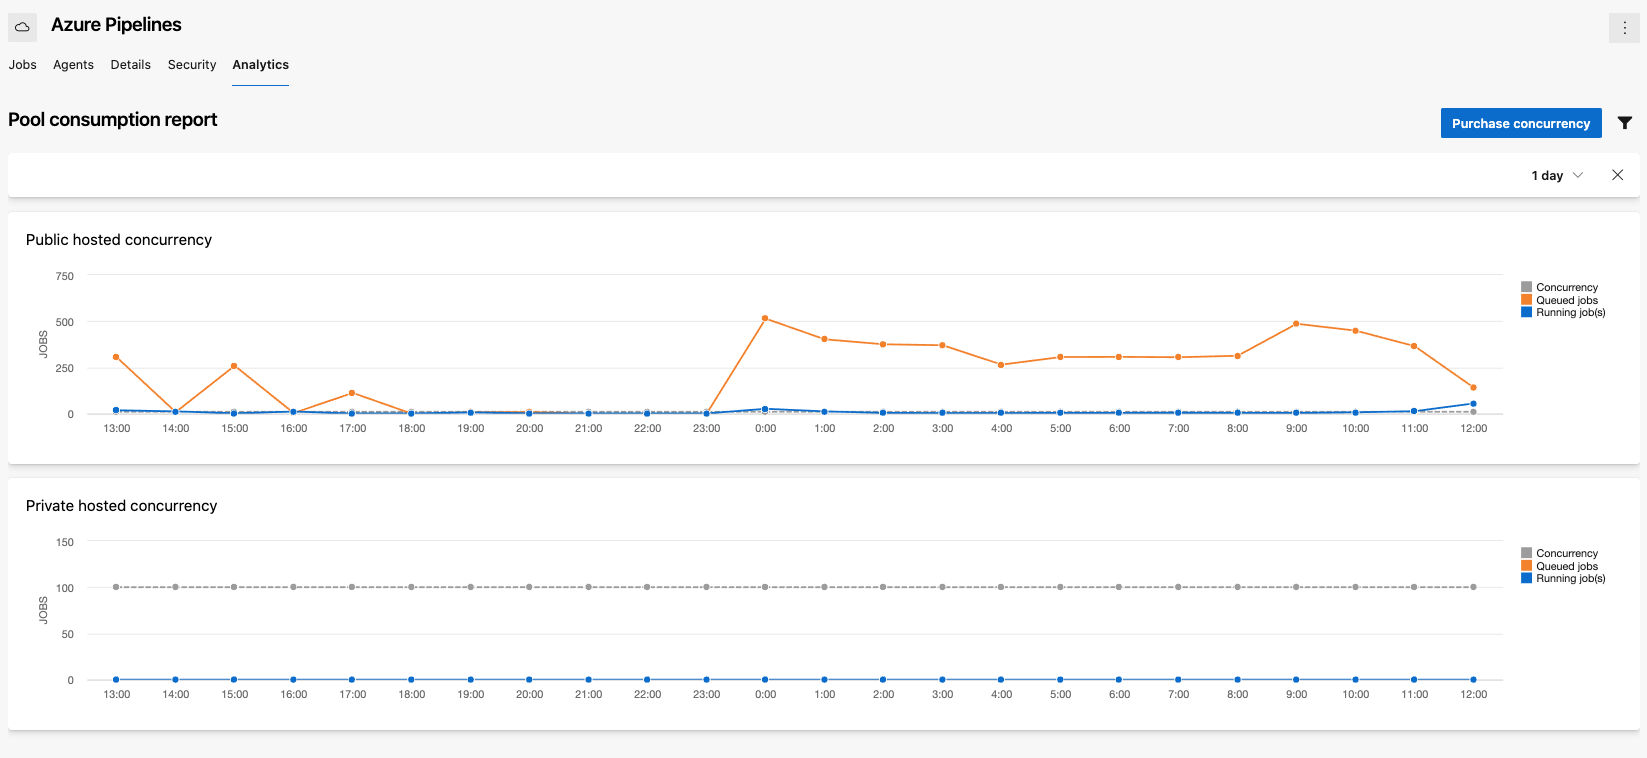
| Public hosted concurrency | Displays concurrency, queued jobs, and running jobs for public projects | Microsoft-hosted |
| Private hosted concurrency | Displays concurrency, queued jobs, and running jobs for private projects | Microsoft-hosted |
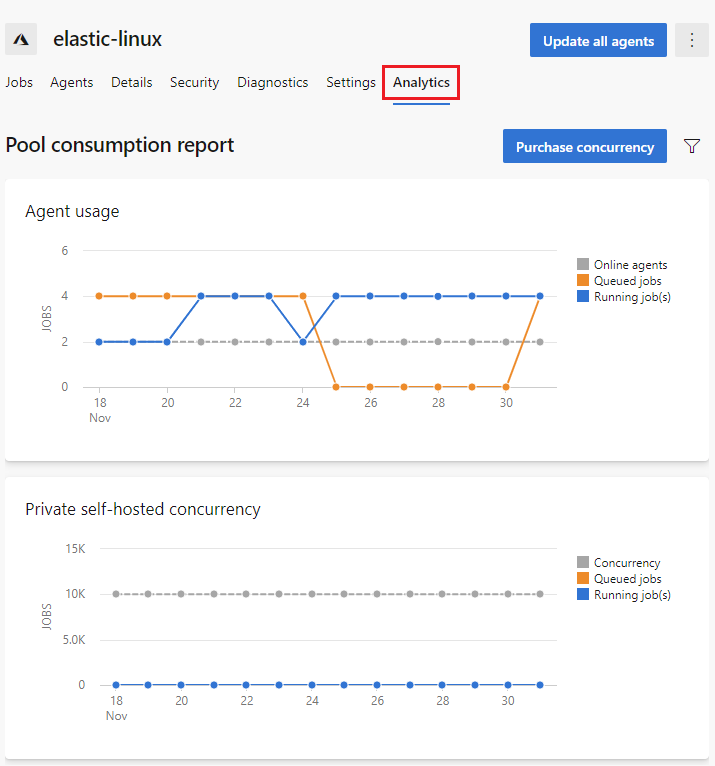
| Agent usage | Displays online agents, queued jobs, and running jobs for self-hosted agents | Scale set agent and self-hosted |
| Private self-hosted concurrency | Displays concurrency, queued jobs, and running jobs for private self-hosted projects | Scale set agent and self-hosted |
The charts in the pool consumption report graph the following data points:
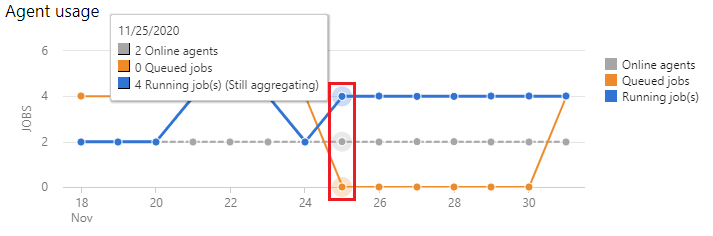
Pool data is aggregated at a granularity of 10 minutes, and the number of running jobs is plotted based on the maximum number of running jobs for the specified interval of time. Because multiple short-running jobs may complete within the 10 minute timeline, the count of running jobs may sometimes be higher than the concurrency or online agents during that same period.
The pool consumption report can be displayed at organization scope, or project scope. At the organization level, the chart is plotted using data from pipelines across any project within the organization that have run jobs in that pool. At the project level, the chart is plotted using data from pipelines in that particular project that have run jobs in that pool.
From the Agent pools view, choose the desired pool, and view the Analytics tab. The following example shows the pool consumption report for a self-hosted agent pool.
This example shows the usage graphs for the Azure Pipelines Microsoft-hosted agent pool.
To adjust the timeline of the graph, choose Filter ![]() , select the interval drop-down, and choose the desired interval.
, select the interval drop-down, and choose the desired interval.
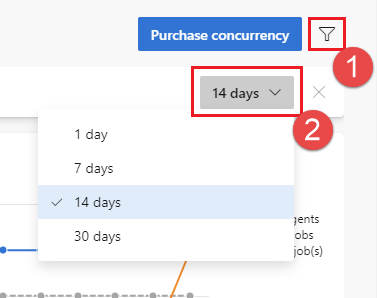
For the 1 day interval, you can view data per hour, and for the other intervals you can view it per day. Pool data is aggregated at a granularity of 10 minutes, and the number of running jobs is plotted based on the maximum number of running jobs for the specified interval of time. In this example there are two online agents, but in some areas there are four running jobs due to the way the pool data is aggregated.
The pool consumption report uses the Azure DevOps Analytics service and the TaskAgentRequestSnapshots endpoint. You can query this endpoint using the following URL prefix: https://analytics.dev.azure.com/{organization}/{project_id}/_odata/v4.0-preview/TaskAgentRequestSnapshots.
You can retrieve the project_id for your project by navigating to the following URL: https://dev.azure.com/{organization}/_apis/projects?api-version=5.0-preview.3.
The following example shows a sample query and response.
{
"@odata.context": "https://analytics.dev.azure.com/{org}/{project_id}/_odata/v4.0-preview/$metadata#TaskAgentRequestSnapshots",
"vsts.warnings@odata.type": "#Collection(String)",
"@vsts.warnings": [
"VS403507: The specified query does not include a $select or $apply clause which is recommended for all queries. Details on recommended query patterns are available here: https://go.microsoft.com/fwlink/?linkid=861060."
],
"value": [
{
"SamplingDateSK": 20201117,
"SamplingHour": 13,
"SamplingTime": "2020-11-17T13:10:00-08:00",
"QueuedDate": "2020-11-17T13:07:26.22-08:00",
"QueuedDateSK": 20201117,
"StartedDate": "2020-11-17T15:02:23.7398429-08:00",
"StartedDateSK": 20201117,
"FinishedDate": "2020-11-17T15:13:49.89-08:00",
"FinishedDateSK": 20201117,
"QueueDurationSeconds": 6897.519,
"ProjectSK": "...",
"PipelineSK": 5141,
"RequestId": 6313,
"PoolId": 28,
"PipelineType": "Build",
"IsHosted": true,
"IsRunning": false,
"IsQueued": true
},
...
For more information on query options, see Query guidelines for Analytics with OData.
Note
The TaskAgentRequestSnapshots endpoint is in preview and not yet documented but you can view information about the data returned by navigating to the endpoint URL: https://analytics.dev.azure.com/{org}/{project_id}/_odata/v4.0-preview/TaskAgentRequestSnapshots.
Pool data is aggregated at a granularity of 10 minutes, and the number of running jobs is plotted based on the maximum number of running jobs for the specified interval of time. Each running job is counted separately, and if multiple jobs complete during the 10 minute interval they contribute to the total count of running jobs for that interval.
The scope of the data in the graph is determined based on whether the chart is accessed through Project settings or Organization settings. At the organization level, the chart is plotted using data from pipelines across any project within the organization that have run jobs in that pool. At the project level, the chart is plotted using data from pipelines in that particular project that have run jobs in that pool.
Events
17 Mar, 9 pm - 21 Mar, 10 am
Join the meetup series to build scalable AI solutions based on real-world use cases with fellow developers and experts.
Register nowTraining
Documentation
Configure and pay for parallel jobs - Azure DevOps
Configure parallel jobs in Azure Pipelines and pay for them
Create and manage agent pools - Azure Pipelines
Learn about organizing agents into pools for builds and releases in Azure Pipelines and Team Foundation Server
Azure Pipelines Agents - Azure Pipelines
Learn about building your code or deploying your software using agents in Azure Pipelines.