Events
17 Mar, 9 pm - 21 Mar, 10 am
Join the meetup series to build scalable AI solutions based on real-world use cases with fellow developers and experts.
Register nowThis browser is no longer supported.
Upgrade to Microsoft Edge to take advantage of the latest features, security updates, and technical support.
Azure DevOps Services | Azure DevOps Server 2022 - Azure DevOps Server 2019
Velocity metrics provide useful information, so teams can plan and forecast sprints and determine how well they estimate and meet planned commitments. You can get an indication of how much work a team can complete during a sprint based on either a count of work items completed or the sum of estimates made for effort (product backlog items), story points (user stories), or size (requirements). Use velocity as an aid to determine team capacity and don't confuse it with key performance indicators.
| Category | Requirements |
|---|---|
| Access levels | - Project member. - At least Basic access. |
| Permissions | - Team administrator or project administrator or specific dashboard permissions granted to you. - To add a widget to a team dashboard: Member of the team. |
| Feature enablement | Azure Boards enabled. If disabled, none of the work tracking Analytics widgets display. To re-enable it, see Turn a service on or off. |
| Task awareness | Be aware of the required and recommended tasks, listed later in this article. |
| Category | Requirements |
|---|---|
| Access levels | - Project member. - At least Basic access. |
| Permissions | - Team administrator or project administrator or specific dashboard permissions granted to you. - To add a widget to a team dashboard: Member of the team. |
| Feature enablement | - Azure Boards enabled. If disabled, none of the work tracking Analytics widgets display. To re-enable it, see Turn a service on or off. - Analytics installed and enabled. Project Collection Administrators group members can add extensions or enable the service. Organization owners are automatically members of this group. |
Tip
The images in this article may differ from what you see in your web portal. These differences can be due to updates to your web app, options enabled by you or your admin, and the process chosen when creating your project (Agile, Basic, Scrum, or CMMI). The Basic process is available starting from Azure DevOps Server 2019 Update 1.
You can choose between two Velocity charts: the in-context Velocity chart from the Backlogs page and the Velocity widget for dashboards. Both charts help you quickly understand the workflow state categories described in the table below.
Items in the Proposed or Resolved states are excluded from the Completed, Completed Late, and Incomplete calculations. For more information, see How workflow category states are used in Azure Boards. Your selections are personal and persist across sessions until changed.
| Workflow state | Description |
|---|---|
| Planned | Work items assigned to a sprint before it starts. If reassigned after the sprint begins, they remain Planned in the original sprint and appear as Late or Incomplete in the new sprint. |
| Completed | Work items assigned to the sprint and completed before the end of the sprint. |
| Completed Late | Work items assigned to the sprint but completed after the sprint ends. |
| Incomplete | Work items assigned to the sprint but not yet completed. |
| Resolved | Bugs assigned to the sprint, indicating a solution was implemented but not yet verified. |
Later in this article, learn how to open the Velocity in-context report or configure the Velocity widget.
You can configure each chart in the following ways:
The widget offers more configuration options. For more information, see Configure and view Velocity charts.
You can choose between two Velocity charts: the in-context Velocity chart from the Backlogs page and the Velocity widget for dashboards. With the Velocity widget, you can quickly determine:
Both charts support visualizing team velocity for several sprints. The Velocity widget, however, supports the following configuration options:
Velocity reports are available for both product and portfolio backlogs. Each report includes interactive controls, allowing users to customize the view to their specific interests.
Sign in to your project (https://dev.azure.com/{Your_Organization/Your_Project}).
Select Boards > Backlogs > Analytics to open the Velocity report for your product or portfolio backlog.

To change to a different backlog, choose from the backlog selector, and then select View full report for Velocity.
Use the interactive controls to select the count or sum field and number of iterations. Select Custom iterations to specify any number of iterations between 1 and 15.
If your team doesn't complete a sprint or if you're working on items before a sprint start date, there's no data to analyze and forecast. You might see this message: Set iteration dates to use this widget. To resolve this situation, set an iteration date range to include present date or wait for the sprint to start.
Hover over a column area to show a summary of planned and completed work items. For example, for the 07_2019 sprint, 131 items are planned.
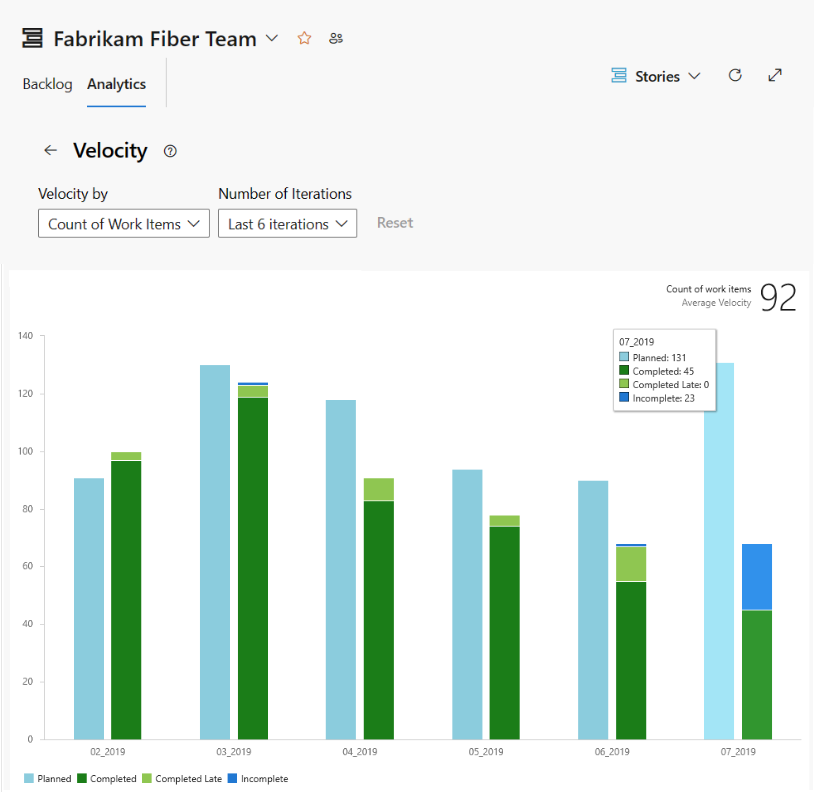
For more information, see the workflow state descriptions mentioned earlier in this article.
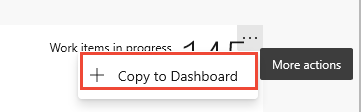
To add the report to a dashboard, select the ![]() actions icon and select Copy to Dashboard.
actions icon and select Copy to Dashboard.
Select the dashboard and select OK.
To return to the Analytics summary, select the ![]() back arrow.
back arrow.
From the web portal, open your product backlog.
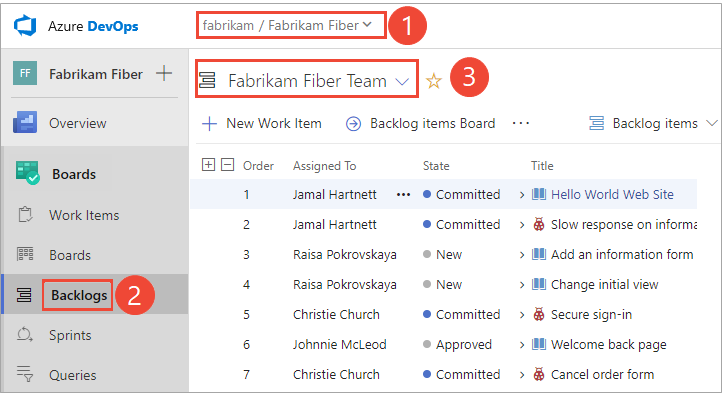
Check that you selected the right project, select Boards > Backlogs, and then select the correct team from the team selector menu.
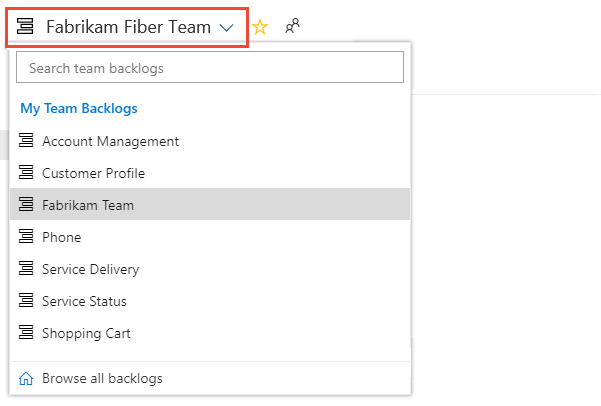
To select another team, open the selector and select a different team or select the ![]() Browse all backlogs option. Or, you can enter a keyword in the search box to filter the list of team backlogs for the project.
Browse all backlogs option. Or, you can enter a keyword in the search box to filter the list of team backlogs for the project.
Tip
Select the ![]() star icon to favorite a team backlog. Favorited artifacts (
star icon to favorite a team backlog. Favorited artifacts (![]() favorited icon) appear at the top of the team selector list.
favorited icon) appear at the top of the team selector list.
Select Backlog items (for Scrum), Stories (for Agile), or Requirements (for CMMI) as the backlog level.
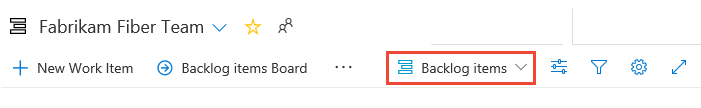
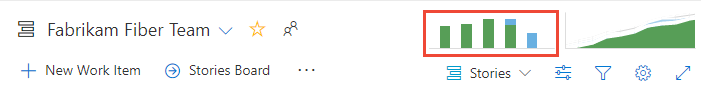
Open the Velocity chart.
For charts to appear, your team must carry out these activities:
The chart tracks your estimated backlog work (sum of Effort, Story Points, or Size) that is completed (green) in the previous sprints or is in progress (blue).
As the following chart shows, velocity tends to fluctuate from sprint-to-sprint for different kinds of reasons. However, you can quickly determine the average velocity by averaging the values shown in green for each sprint. You can then plug the average into the Forecast tool.
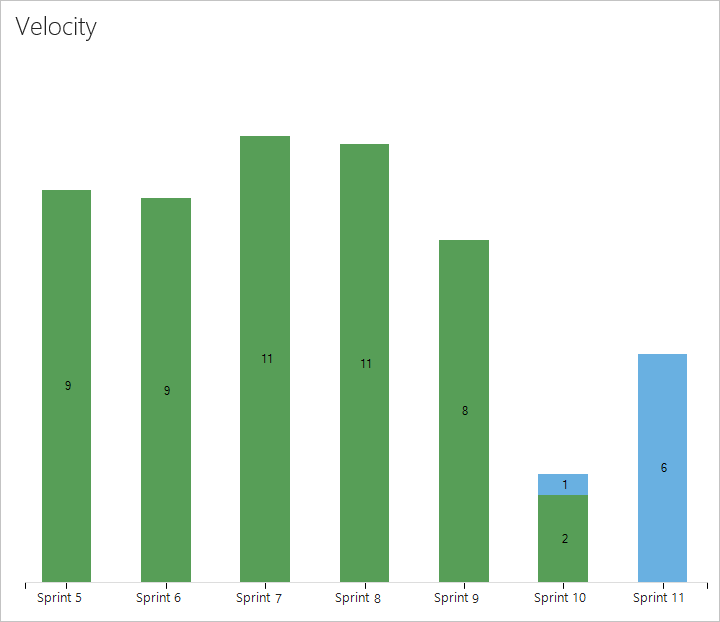
Work items based on the Scrum process get counted in the chart once their State is set to Committed, whereas items based on the Agile and CMMI processes get counted once their State is set to Active. This behavior is set through the workflow states to category state mappings.
You can only configure your Velocity widget for a single team. If you want to view the velocity for several teams, then you must configure a portfolio management team that rolls up from several teams. For more information, see Add teams.
If you haven't yet, Add the Velocity widget to your dashboard. For Azure DevOps Server 2019, Enable or install Analytics.
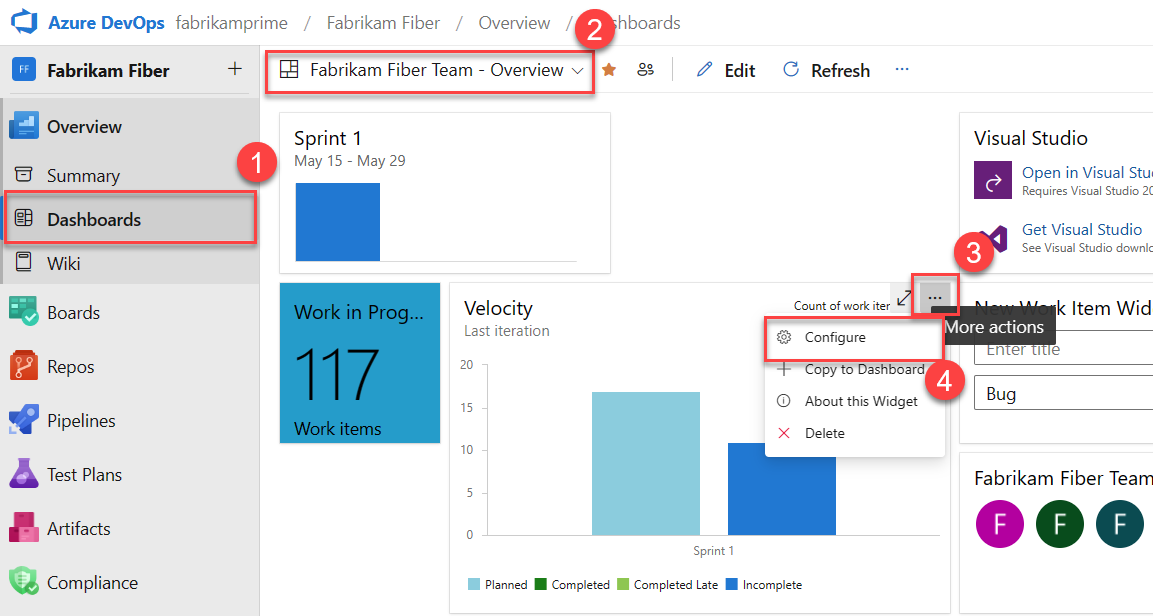
Complete the following steps to configure the Velocity widget.
Select the ![]() actions icon and select the Configure option to open the configuration dialog.
actions icon and select the Configure option to open the configuration dialog.
Modify the title, select the team, and then select either the backlog level or work item type to track. Select whether you want to track a count of work items or a sum of a numeric field. The most common summed field is that of Effort, Story Points, or Size.
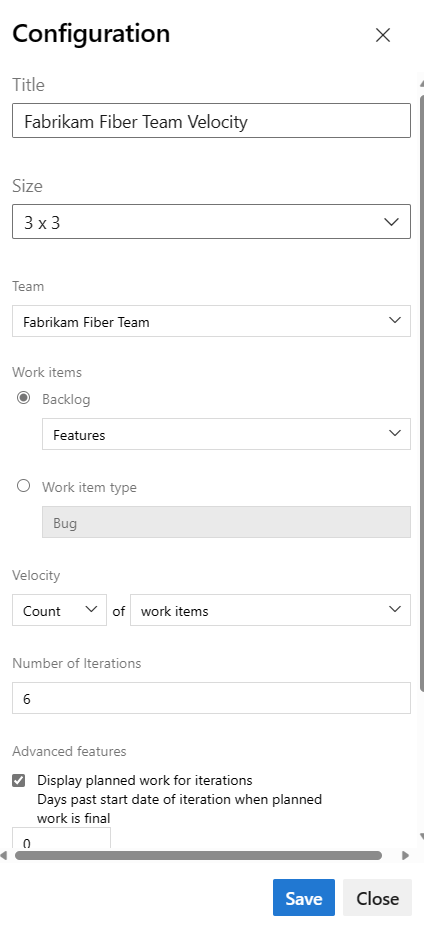
Specify the number of sprints you want to view. The default is 6 and the maximum is 15.
(Optional) Select the check boxes to show additional information for work completed later than planned for each sprint.
3, and planned work gets counted on the third day. For example, if the iteration starts on 01/01/2024, and three backlog items are assigned to the iteration on 01/01/2024 end-of-day, then those three backlog items are considered as Planned. If your team doesn't complete planning until a few days into the iteration, then you can update the Days past start date of iteration when planned work is final.Select Save. The following image shows Velocity based on Story Points and eight sprints of data.

For more information about Planned, Completed, Completed Late, and Incomplete states, see the State descriptions mentioned earlier in this article.
For your team to gain the greatest utility from the Velocity charts, follow these required and recommended tasks.
Important
If each team wants their own backlog view, Velocity chart, and forecast tool, you can add a new team. Each team has access to its own set of Agile tools, which filter work items to include only the assigned area paths and iteration paths specific to that team.
Events
17 Mar, 9 pm - 21 Mar, 10 am
Join the meetup series to build scalable AI solutions based on real-world use cases with fellow developers and experts.
Register nowTraining
Learning path
Use advance techniques in canvas apps to perform custom updates and optimization - Training
Use advance techniques in canvas apps to perform custom updates and optimization
Documentation
View and configure the cumulative flow diagram (CFD) reports - Azure DevOps
Learn how to configure and view cumulative flow diagrams to improve your Kanban processes.
View and configure sprint burndown - Azure DevOps
Learn how to configure the sprint burndown in-context chart or widget to track team progress in Azure DevOps.
Cycle Time and Lead Time control charts - Azure DevOps Services
Learn how to configure and use the cycle time and lead time control charts/widgets to improve your team's ability to plan and improve processes.