Note
Access to this page requires authorization. You can try signing in or changing directories.
Access to this page requires authorization. You can try changing directories.
Lakeflow Designer includes built-in operators for common data preparation and transformation tasks. Open the operator menu in the side pane on the left to browse operators by category, or use Search for an operator... at the top of the pane. Operator search suggests operators based on your intent. For example, typing average by month returns the Aggregate operator. To configure an operator after you add it to the canvas, double-click it, or hover over it and click  (Edit operator), to open the configuration pane.
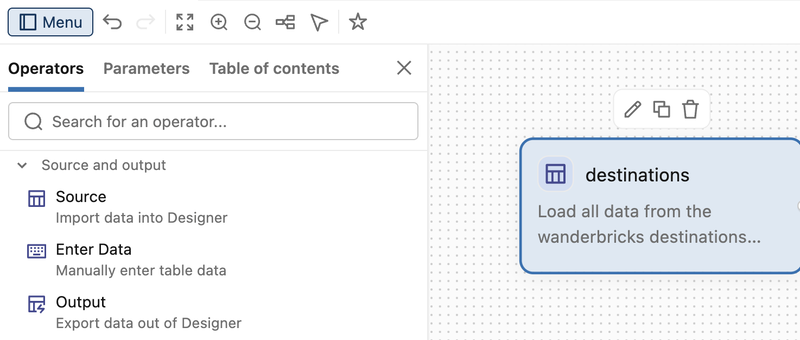
Each operator displays an AI-generated description of what it does. The description also acts as an editor for the operator: editing the description reconfigures the operator to match your description.
To learn how to create your own user-defined operators, see User-defined operators in Lakeflow Designer.
Source and output
Source
Imports data into Designer from a Unity Catalog table or other supported source. To select a source, search for a table or file by name, or browse by catalog and schema. You can also create a new table from this pane.
After you select a table, the pane shows the table's name, owner, and last updated time. Click Select a new data source to change the source. Changing the source invalidates the output cache for all downstream operators.
You can also use a Unity Catalog metric view as a source. When you select a metric view, select the dimensions and measures to include, and Designer generates the aggregated query for you.
For the full range of data ingestion options, including targeting an entire Unity Catalog volume or folder, see Ingest data into Lakeflow Designer.
Enter Data
Creates a table by typing values into a spreadsheet-style editor. Use this operator to add small amounts of reference data, such as lookup values or test data, without creating a separate source table.
| Field | Description |
|---|---|
| Table Data | Enter your data as a table. The first row defines the column headers, and the remaining rows are the data. Designer infers each column's data type from its values. |
Output
Exports data out of Designer. The Output operator can write results to a Unity Catalog table, publish them as a materialized view, or write them to a file in a Unity Catalog volume. Select the destination with Output type.
| Output type | Description |
|---|---|
| Table | Writes the results to a managed Unity Catalog table. Set a Table name and an Output location (catalog and schema), then select a Write mode. |
| Materialized view | Publishes the results as a materialized view in Unity Catalog that refreshes when the visual data prep runs. |
| File | Writes the results to a file in a Unity Catalog volume. Select a File type of CSV, Excel, or JSON, then set the target volume and file name. |
For a Table or File output, select how each run writes to the destination with Write mode:
| Write mode | Description |
|---|---|
| Overwrite | Replaces the existing contents with the results of the current run. This is the default. |
| Append | Adds the results of the current run to the existing rows. |
| Merge | Upserts rows into the target table by matching on the merge keys you specify. Available for table outputs. |
Click Run to run the visual data prep and write the results. For a table output, if the table doesn't exist, the operator creates it. Scheduled runs write to the destination using the same write mode.
AI Function
Runs a built-in AI operation on your data. In the configuration pane, open Select a function and select one of the functions in the following table. Each function exposes options in the pane for inputs (for example, columns, prompts, labels, or languages) and outputs.
| Function | Description |
|---|---|
ai_analyze_sentiment |
Performs sentiment analysis on input text. |
ai_classify |
Classifies text or parsed documents using labels you provide. |
ai_extract |
Extracts structured data from text or parsed documents using fields you define. |
ai_fix_grammar |
Corrects grammatical errors in text. |
ai_forecast |
Forecasts time series data up to a horizon you specify. ai_forecast is a table-valued function that processes the entire input table. |
ai_gen |
Answers a user-provided prompt against the input. |
ai_mask |
Masks specified entities in text (for example, for de-identification). |
ai_parse_document |
Extracts text, tables, and layout from unstructured documents. |
ai_prep_search |
Transforms parsed document output into search-ready chunks for vector search and retrieval-augmented generation (RAG) pipelines. |
ai_query |
Answers a prompt using any supported foundation model, for general-purpose task and model flexibility. |
ai_similarity |
Compares two strings and returns a semantic similarity score. |
ai_summarize |
Generates a summary of text. |
ai_translate |
Translates text into a target language you specify. |
For details about each function, see Enrich data using AI Functions.
Transformations
The following operators perform transformations on your data.
Aggregate
Summarizes rows by grouping data and computing aggregate values.
| Field | Description |
|---|---|
| Aggregate by | Select a column, select an aggregation function, and provide a name for the output column. Click + Add aggregation to add more. Supported functions: AVG, COUNT, MAX, MEAN, MEDIAN, MIN, PERCENTILE, STDDEV, SUM, VARIANCE. |
| Group by | Select the columns to group by. Click + Add grouping to add more. Columns used in Group by are automatically included in the output. |
Combine
Merges data from multiple tables with matching schemas into a single output.
| Field | Description |
|---|---|
| Set operation | Select Union, Intersect, or Except. |
| Merge strategy | Select Distinct to exclude duplicate rows from the output, or All to keep all rows including duplicates. |
Filter
Splits rows based on whether they meet one or more conditions, using a graphical condition builder.
| Field | Description |
|---|---|
| Condition | For each condition, select a column, a condition type, and a value to conditionally match. Supported condition types:
For conditions on date columns, the date picker supports navigating across years and months. |
The Filter operator has two outputs so you can branch data based on whether it meets the conditions:
| Output | Description |
|---|---|
| Included | Rows that meet the filter conditions. |
| Excluded | Rows that don't meet the filter conditions, including rows where the condition evaluates to null. |
Join
Links two tables on a key by combining two input datasets based on matching column values.
| Field | Description |
|---|---|
| Input tables | Select the two input tables to join. |
| Join condition | Specify at least one join condition by selecting matching columns from the two tables. Click + Add join expression to add more conditions. Optional: click the arrow between the left and right tables to add a custom join condition, then edit the AI-generated description or write SQL. |
| Match case | When off (the default), string join keys match case-insensitively (and ignore leading and trailing white space). Turn Match case on to match string keys exactly. This option applies to the join keys, not to custom join conditions. |
| Join type | Select the join type. By default, the Join operator splits its results across three outputs (see the following section). Select Full join, Inner join, Left join, or Right join to produce a single joined output instead. |
| Output columns | Optional: select which columns to include. By default, all columns from both tables are included. Duplicate column names receive a table name prefix. |
| Custom expression columns | Optional: add custom expression columns based on the joined result. |
By default, the Join operator has three outputs so you can branch a workflow based on join results:
| Output | Description |
|---|---|
| Left unmatched | Rows from the left input that have no match in the right input. |
| Matched | Rows that match across both inputs. |
| Right unmatched | Rows from the right input that have no match in the left input. |
When you select a specific Join type (full, inner, left, or right), the operator produces a single joined output instead of the three split outputs.
Limit
Restricts row count by passing through only up to the maximum number of rows you specify.
| Field | Description |
|---|---|
| Maximum rows | Specify the maximum number of rows to pass through. |
Pivot
Reshapes tabular data in two directions. Use the tabs at the top of the configuration pane to select the mode.
Rows → Columns (pivot)
Turns distinct values in one column into new column headers, filled with aggregated values from another column.
| Field | Description |
|---|---|
| Pivot column | Select the column whose distinct values become the new headers. |
| Value & aggregation | Select the column whose values fill the pivoted cells, and select an aggregation function (for example, SUM, AVG, COUNT, MIN, or MAX). Configure how missing values are handled (for example, null or zero), if available in the pane. |
Columns → Rows (unpivot)
Folds one or more columns into rows.
| Field | Description |
|---|---|
| Unpivot columns | Select the columns to unpivot. |
| Key and value columns | Set names for the output key and value columns. |
Include columns
For either mode, select which columns stay in the output alongside the pivoted or unpivoted values, and drop columns you don't need before the transformation. Designer infers fixed (grouping) columns from the columns you don't assign to pivot, value, or unpivot roles.
Sort
Orders rows on one or more columns.
| Field | Description |
|---|---|
| Sort order | Select ASC (ascending) or DESC (descending) for each column. Click + Add sort expression to sort by additional columns. Sorting follows standard lexical order. |
SQL
Writes custom SQL code for any transformation not covered by the other operators.
| Field | Description |
|---|---|
| SQL editor | Type a SQL SELECT statement. To reference the output of an input operator, use that operator's name as the table name in your query. For example:SELECT COUNT(*)FROM aggregate_2WHERE 1 = 1Click the  button to open the full SQL code pane and see how your statement fits into the complete workflow. button to open the full SQL code pane and see how your statement fits into the complete workflow. |
| Parameters | To reference a visual data prep parameter, use named parameter marker syntax, such as :environment. Designer shows an example above the editor when you open the operator for editing. See Parameters. |
Select
Selects, renames, and reorders columns from the input data.
| Field | Description |
|---|---|
| Include or exclude columns | Select Start with all columns or Start with no columns, then use the checkboxes to include or exclude individual columns. Drag columns to reorder them. |
| Rename a column | Type a new name in the Rename field next to any column. |
Prepare
Cleans and derives columns by chaining one or more actions on the input data. Click + Add action and select an action. Add as many actions as you need. They apply in order.
| Action | Description |
|---|---|
| Formula | Create a new column or overwrite an existing column using natural language or a SQL expression. |
| Change type | Convert a column to another data type. |
| Replace value | Find and replace values in a column. |
| Fill nulls | Replace null values with a constant. |
| Text case | Change case to lower, upper, or title. |
| Trim | Remove whitespace from one or both ends. |
| Regex replace | Replace text matching a regex pattern. |
| Extract | Extract a substring matching a regex group. |
| Parse date | Parse a string into a date or timestamp. |
To remove an action, hover over its row and click  .
.
Custom columns
The Formula action opens the expression editor, where you can create a new column or overwrite an existing column using either natural language or SQL code. The editor has two input boxes and is bidirectional:
- Description: Type a natural language description of what you want the column to do. Designer uses Genie to generate the corresponding code expression below.
- Expression: If you prefer to write or edit code directly, click the edit expression button. Editing the expression automatically generates a natural language description.
Python
Runs custom Python (PySpark) on the input data.
| Field | Description |
|---|---|
result |
Assign a single DataFrame to result, which becomes the operator's output. |
inputs["data"] |
A list of input DataFrames, in upstream order. The operator details pane shows the name of each input, in order. For example, Available inputs: inputs["data"][0] (customers), inputs["data"][1] (sales). |
| Parameters | Call dbutils.widgets.get(), such as dbutils.widgets.get("environment"), to reference a visual data prep parameter. Designer shows an example above the editor when you open the operator for editing. See Parameters. |
A minimal pattern is to use the first input when present, or an empty DataFrame otherwise:
# inputs["data"] is a list of input DataFrames

result = inputs["data"][0] if inputs["data"] else spark.createDataFrame([], "col: string")
From there, you can chain DataFrame operations (for example, select, filter, withColumn, or joins) on result before the assignment ends, or replace result with a new DataFrame built from inputs["data"].
Organization
Note
Adds a note on the canvas so you can document the workflow itself: its purpose, assumptions, caveats, or handoff context for anyone who opens the visual data prep later.
| Field | Description |
|---|---|
| Content | Edit note content inline on the canvas with a rich-text editor. You can add headings, text styling, links, images, and tables where plain text isn't enough. Notes don't affect how data flows through operators. |
Group
Visually groups operators on the canvas without changing how data flows between them, which is helpful when a visual data prep grows large or you want to reflect logical stages.
| Field | Description |
|---|---|
| Add to group | Drag one or more operators onto a group to add them to it. |
| Create from selection | Select one or multiple operators, open the shortcut menu (right-click), and select Create new group to wrap the selection in a new group. |
| Name | Give the group a descriptive name. |
| Minimize / expand | Click minimize or expand to show or hide the group's contents on the canvas. |
Visualization
Creates a visualization from the input data and renders it directly on the canvas. Connect a Visualization operator to any operator that produces tabular data to chart the results without leaving Designer.
To configure the visualization, open the operator and select a Visualization type, then map your columns to the chart.
| Field | Description |
|---|---|
| Visualization | The chart type to render, such as Bar, Area, or Counter. |