Note
Access to this page requires authorization. You can try signing in or changing directories.
Access to this page requires authorization. You can try changing directories.
Lakeflow Designer provides a visual canvas for analysts to perform data analytics, preparation, and basic automation. In Designer, you create visual data prep files, each made up of a sequence of operators (such as filter, join, and transform) arranged as a DAG to produce a result. All transformations are backed by code, which allows you to version files in Git and schedule them as jobs to seamlessly move to production.
With Lakeflow Designer, you can:
- Design workflows using a drag-and-drop canvas.
- Transform data without writing code using built-in operators for filtering, aggregating, joining, and reshaping data.
- Use Genie Code to generate or refine transformations in your visual data prep using natural language.
- Preview each interim step without running the entire pipeline.
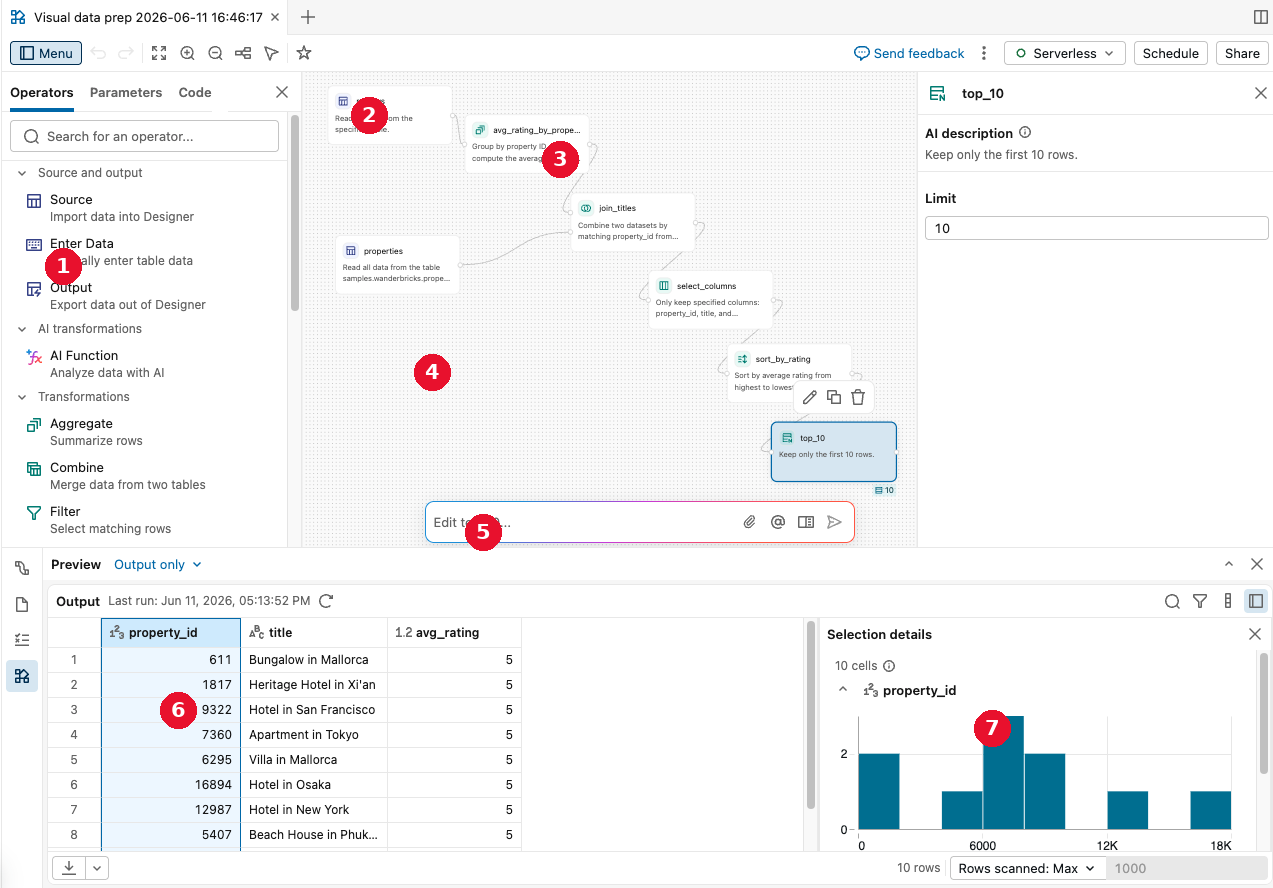
In the image above, you can see:
- The menu, with the Operators and Parameters tabs
- An operator
- A connection between two operators
- The drag-and-drop canvas
- The Genie Code prompt
- The output pane
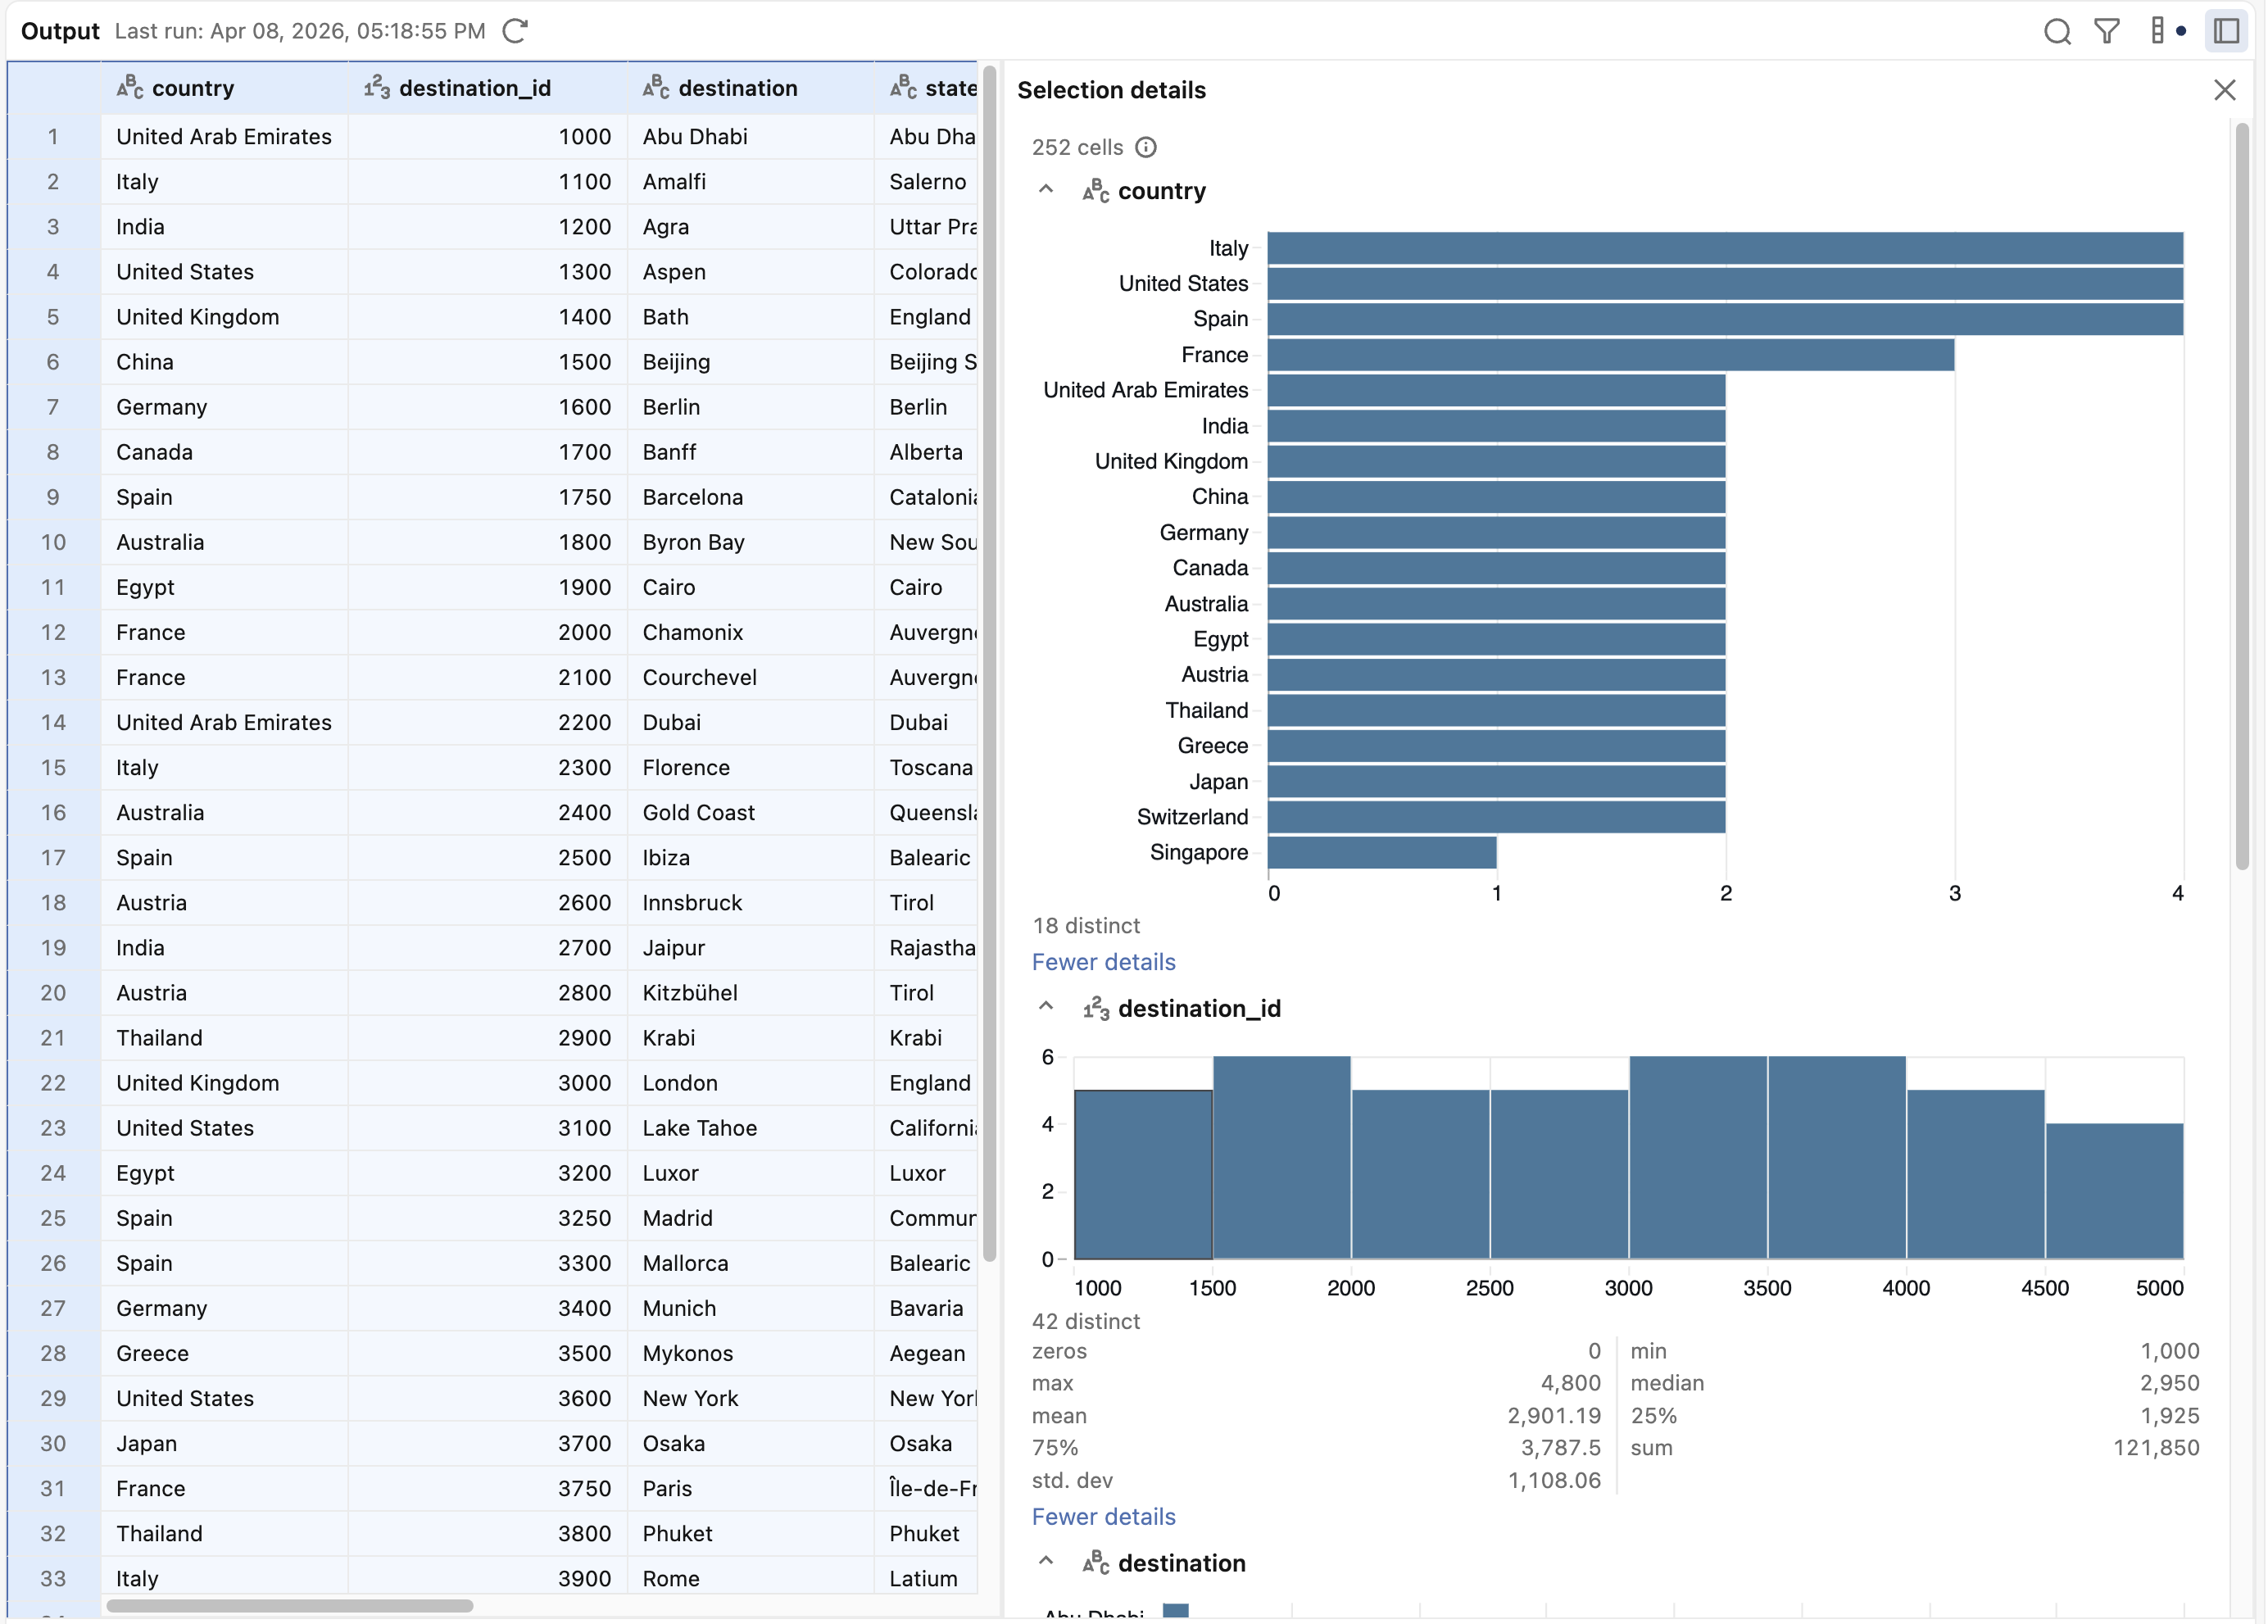
- The data profile of the output
Key concepts
The menu
The menu in the left pane is where you find the building blocks for your visual data prep. It has three tabs:
- Operators: Browse and search the built-in operators. Drag and drop operator types from the list onto the canvas to add them.
- Parameters: Define and manage parameters for the visual data prep.
- Table of contents: Find and navigate to any operator in the visual data prep, and view the code generated for each one. See The table of contents.
The canvas
The canvas is the main workspace where you add, configure, and connect operators to build your visual data prep.
To navigate the canvas:
- Pan: Hold Space while clicking and dragging, or slide two fingers on a trackpad.
- Zoom: Pinch or stretch on a trackpad, or hold Ctrl and scroll.
The canvas toolbar is located in the header with canvas navigation tools:  zoom in,
  zoom out,
  fit view,
  auto-layout, and
  drag mode.
Right-click anywhere on the canvas to access common actions including adding operators, undo and redo, auto-layout, fit view, and opening the code pane.
To quickly access editor actions, open the command palette by pressing Cmd+Shift+P on macOS or Ctrl+Shift+P on Windows.
You can also drag and drop an Excel or CSV file directly onto the canvas to create a Source operator for that file.
Operators
Operators are the building blocks of a visual data prep. An operator is an action such as a join, transform, or filter. You chain together operators on the canvas to build a workflow. Each operator is configurable based on its type. Operators display an AI-generated description of their effect; editing the description reconfigures the operator.
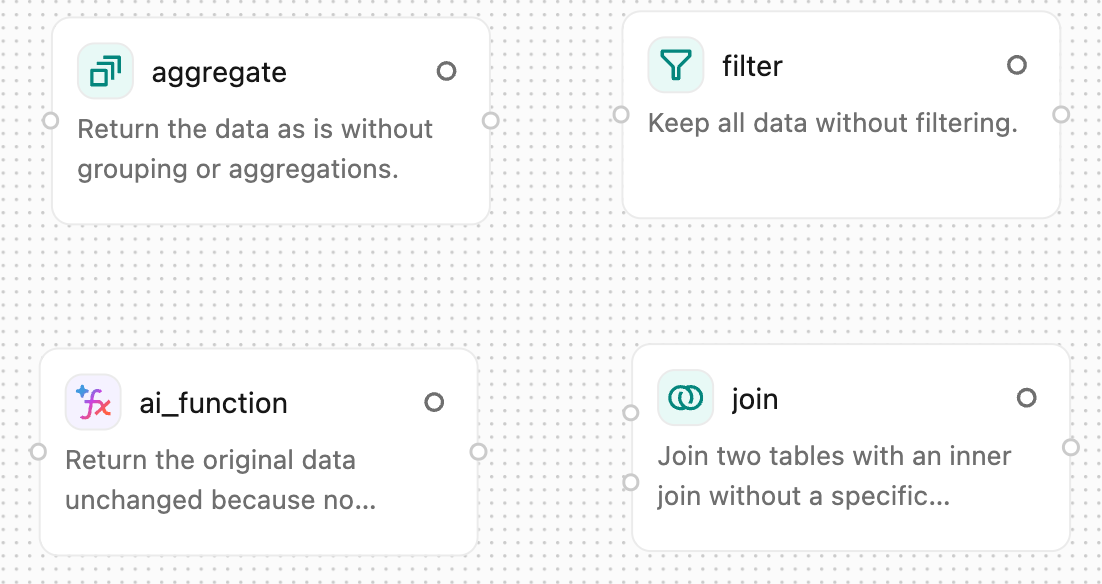
Lakeflow Designer includes built-in operators for common data transformation tasks. For details, see Built-in operators in Lakeflow Designer.
Connections
Connections define how data flows between operators. To create a connection, drag the port on the right edge of one operator to the port on the left edge of another operator. This specifies that data flows from the first operator into the second. Data flows from left to right through the visual data prep. Some operators, such as Join and Combine, accept multiple input connections.
Node ports provide large connection targets and clear visual cues, so operators are easy to connect.
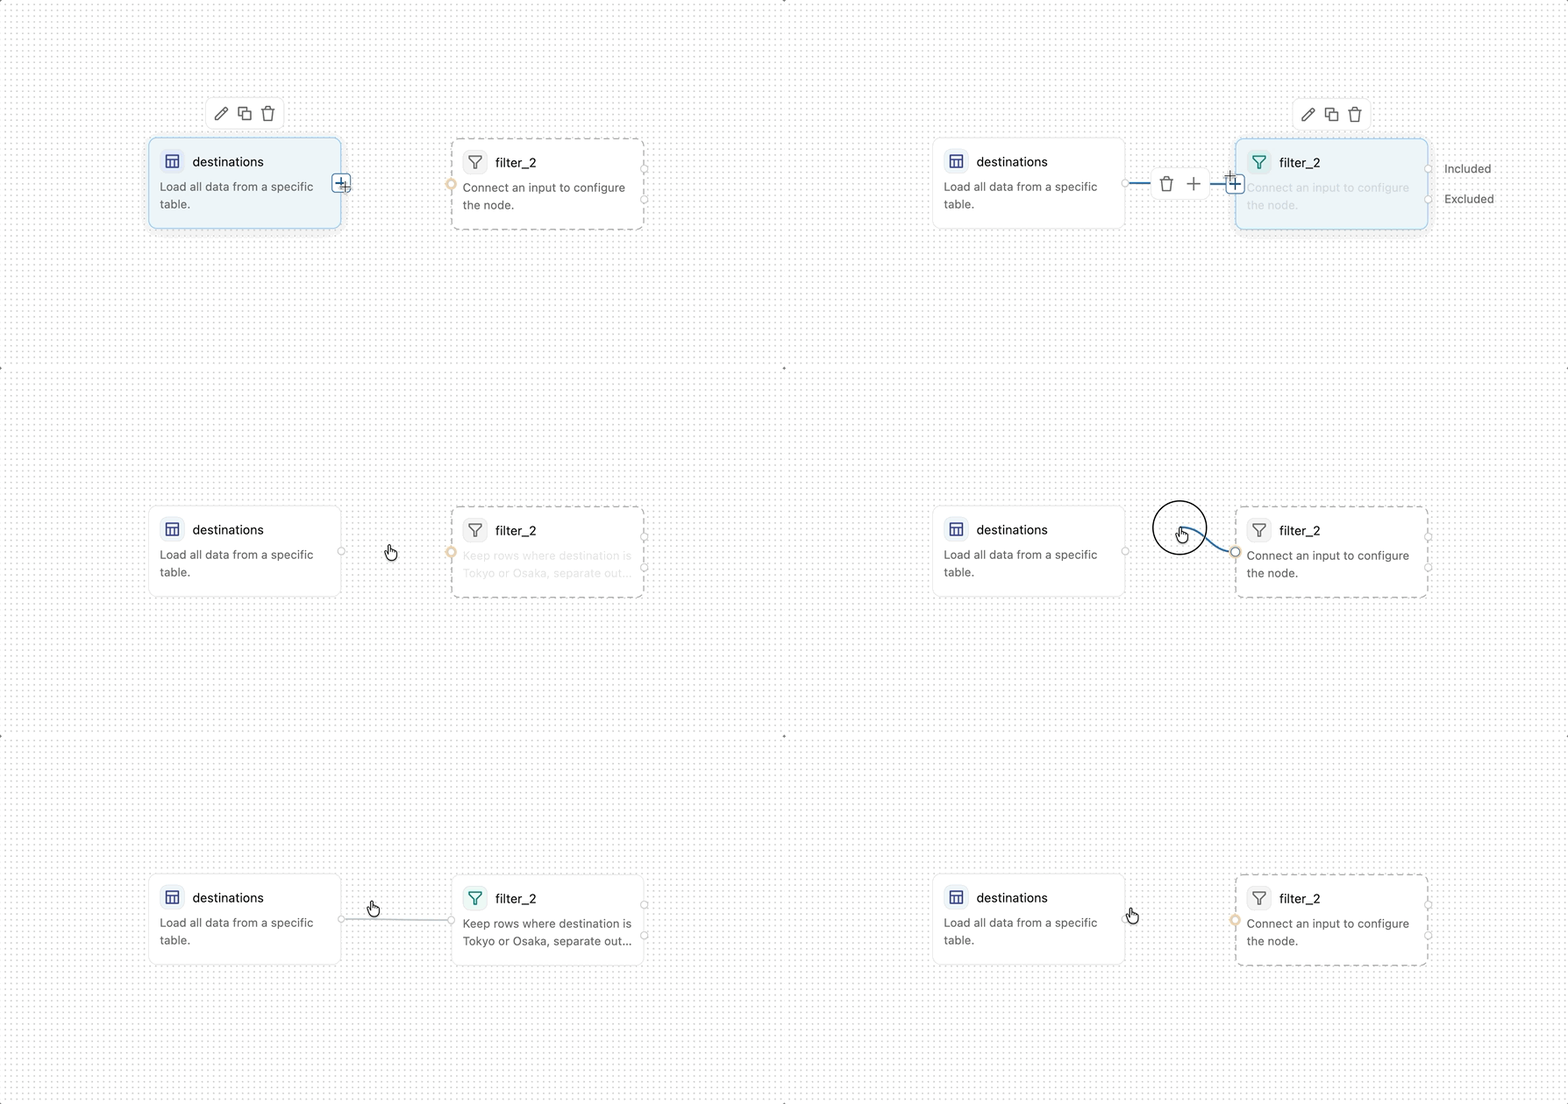
An operator's ports also signal its configuration status:
- An unconfigured operator has a dashed border.
- A required input port that isn't connected is highlighted in yellow.
The output pane
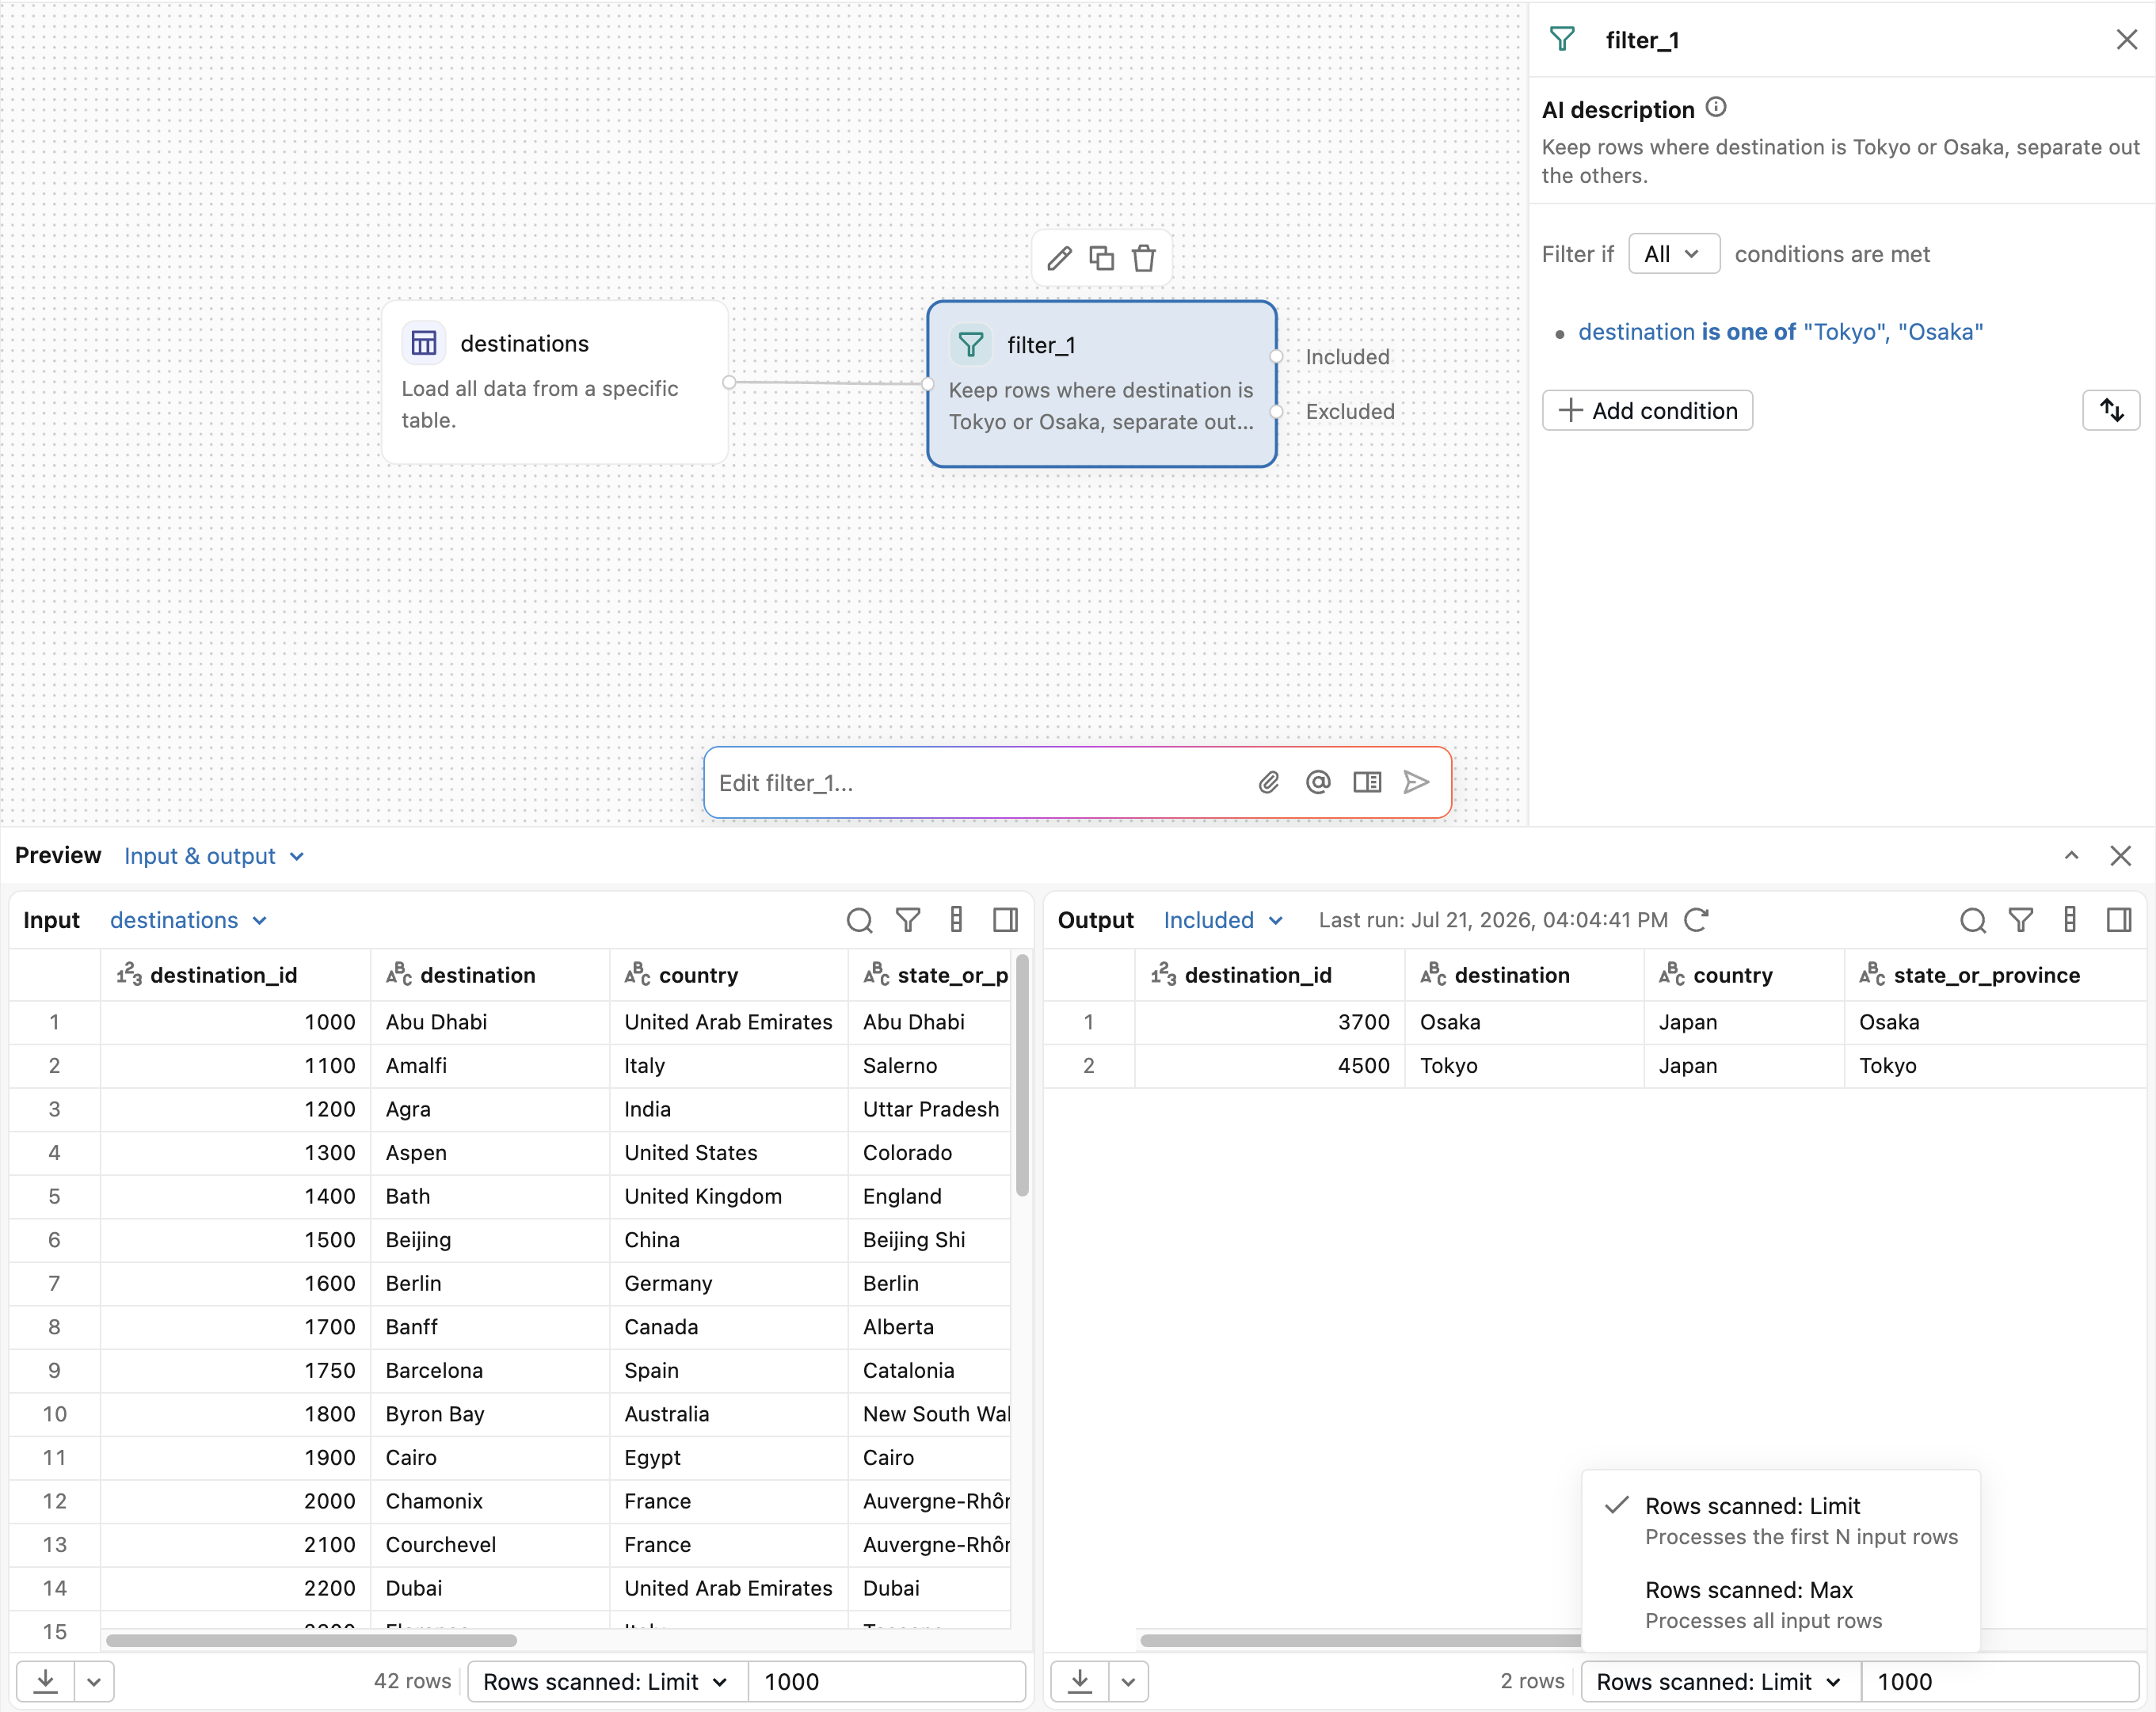
The output pane appears at the bottom of the screen when you select an operator. Select any operator to see the results in the output window at the bottom of the screen. For most operator types, the input data is on the left and output data is on the right. Operators that produce non-table results, such as plots, HTML, or images, render those outputs directly in the output pane.
Use the view control in the output pane to switch between input and output (the default), input only, or output only. In the combined view, drag the divider to resize the input and output panes.
By default, operators process a limited sample of data. Use the Rows scanned drop-down menu in the output pane to control how many rows to process:
- Rows scanned: Limit: Processes the first N input rows. Specify the number of rows in the field next to the drop-down menu.
- Rows scanned: Max: Processes all input rows.
Warning
Running with Rows scanned: Max reruns all upstream operators with the complete, unbounded dataset and can take a long time.
The data profile
To see details about part of your output, select the data you want to inspect, then click  sidebar button in the top-right corner of the output pane to open the details panel.
Genie Code
Genie Code enables you to describe transformations in natural language. All interactions are agentic and use context from the Azure Databricks platform. See Genie Code.
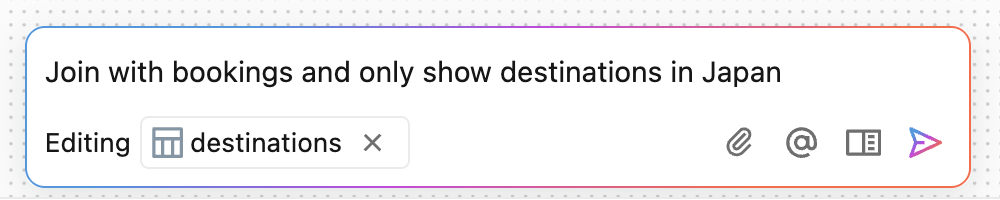
Type a prompt to generate or modify transformations. To view the history of Genie Code interactions and see more detail on each response, open the Genie Code side pane by clicking  in the right sidebar. When the side pane is open, the in-canvas toolbar is minimized. Genie Code shows a one-line summary of its most recent edit above the input box.
The table of contents
The Table of contents tab in the left menu lists every operator in the visual data prep and lets you search for one by name. Select an operator to focus it on the canvas. Every visual data prep is backed by generated code. To inspect the code for an operator, select it in the table of contents, then expand the Generated code section to view its underlying code.
Parameters
Parameters are named values defined for the visual data prep as a whole that you can reference from SQL and Python operators. To manage parameters, open the Parameters tab in the left menu.
Each parameter has a value that you set when you define it. When you schedule the visual data prep to run, you can optionally override these values for each schedule. For example, you might schedule the same visual data prep to run every day at noon with an environment parameter set to test, and again at 2 PM with environment set to production.
Reference a parameter from an operator as follows:
- SQL operator: Use named parameter marker syntax, such as
:environment. See Use named parameter markers. - Python operator: Call
dbutils.widgets.get(), such asdbutils.widgets.get("environment"). See Widgets tool (dbutils.widgets).
When you open a SQL or Python operator for editing, Lakeflow Designer shows an example of how to reference the available parameters above the source editor.