Note
Access to this page requires authorization. You can try signing in or changing directories.
Access to this page requires authorization. You can try changing directories.
Copilot in Power BI helps you quickly create and edit report pages by using natural language prompts. This AI-powered tool saves you hours when you build and refine reports, helping you generate professional visualizations without manual configuration.
Get started with Copilot
This procedure uses the Copilot pane in the Power BI service or Desktop, not the standalone Copilot experience.
If you're new to Copilot in Power BI, see Overview of Copilot for Power BI.
Make sure you select a report.
If you're in the Power BI service, select the Edit button to enter Edit view.
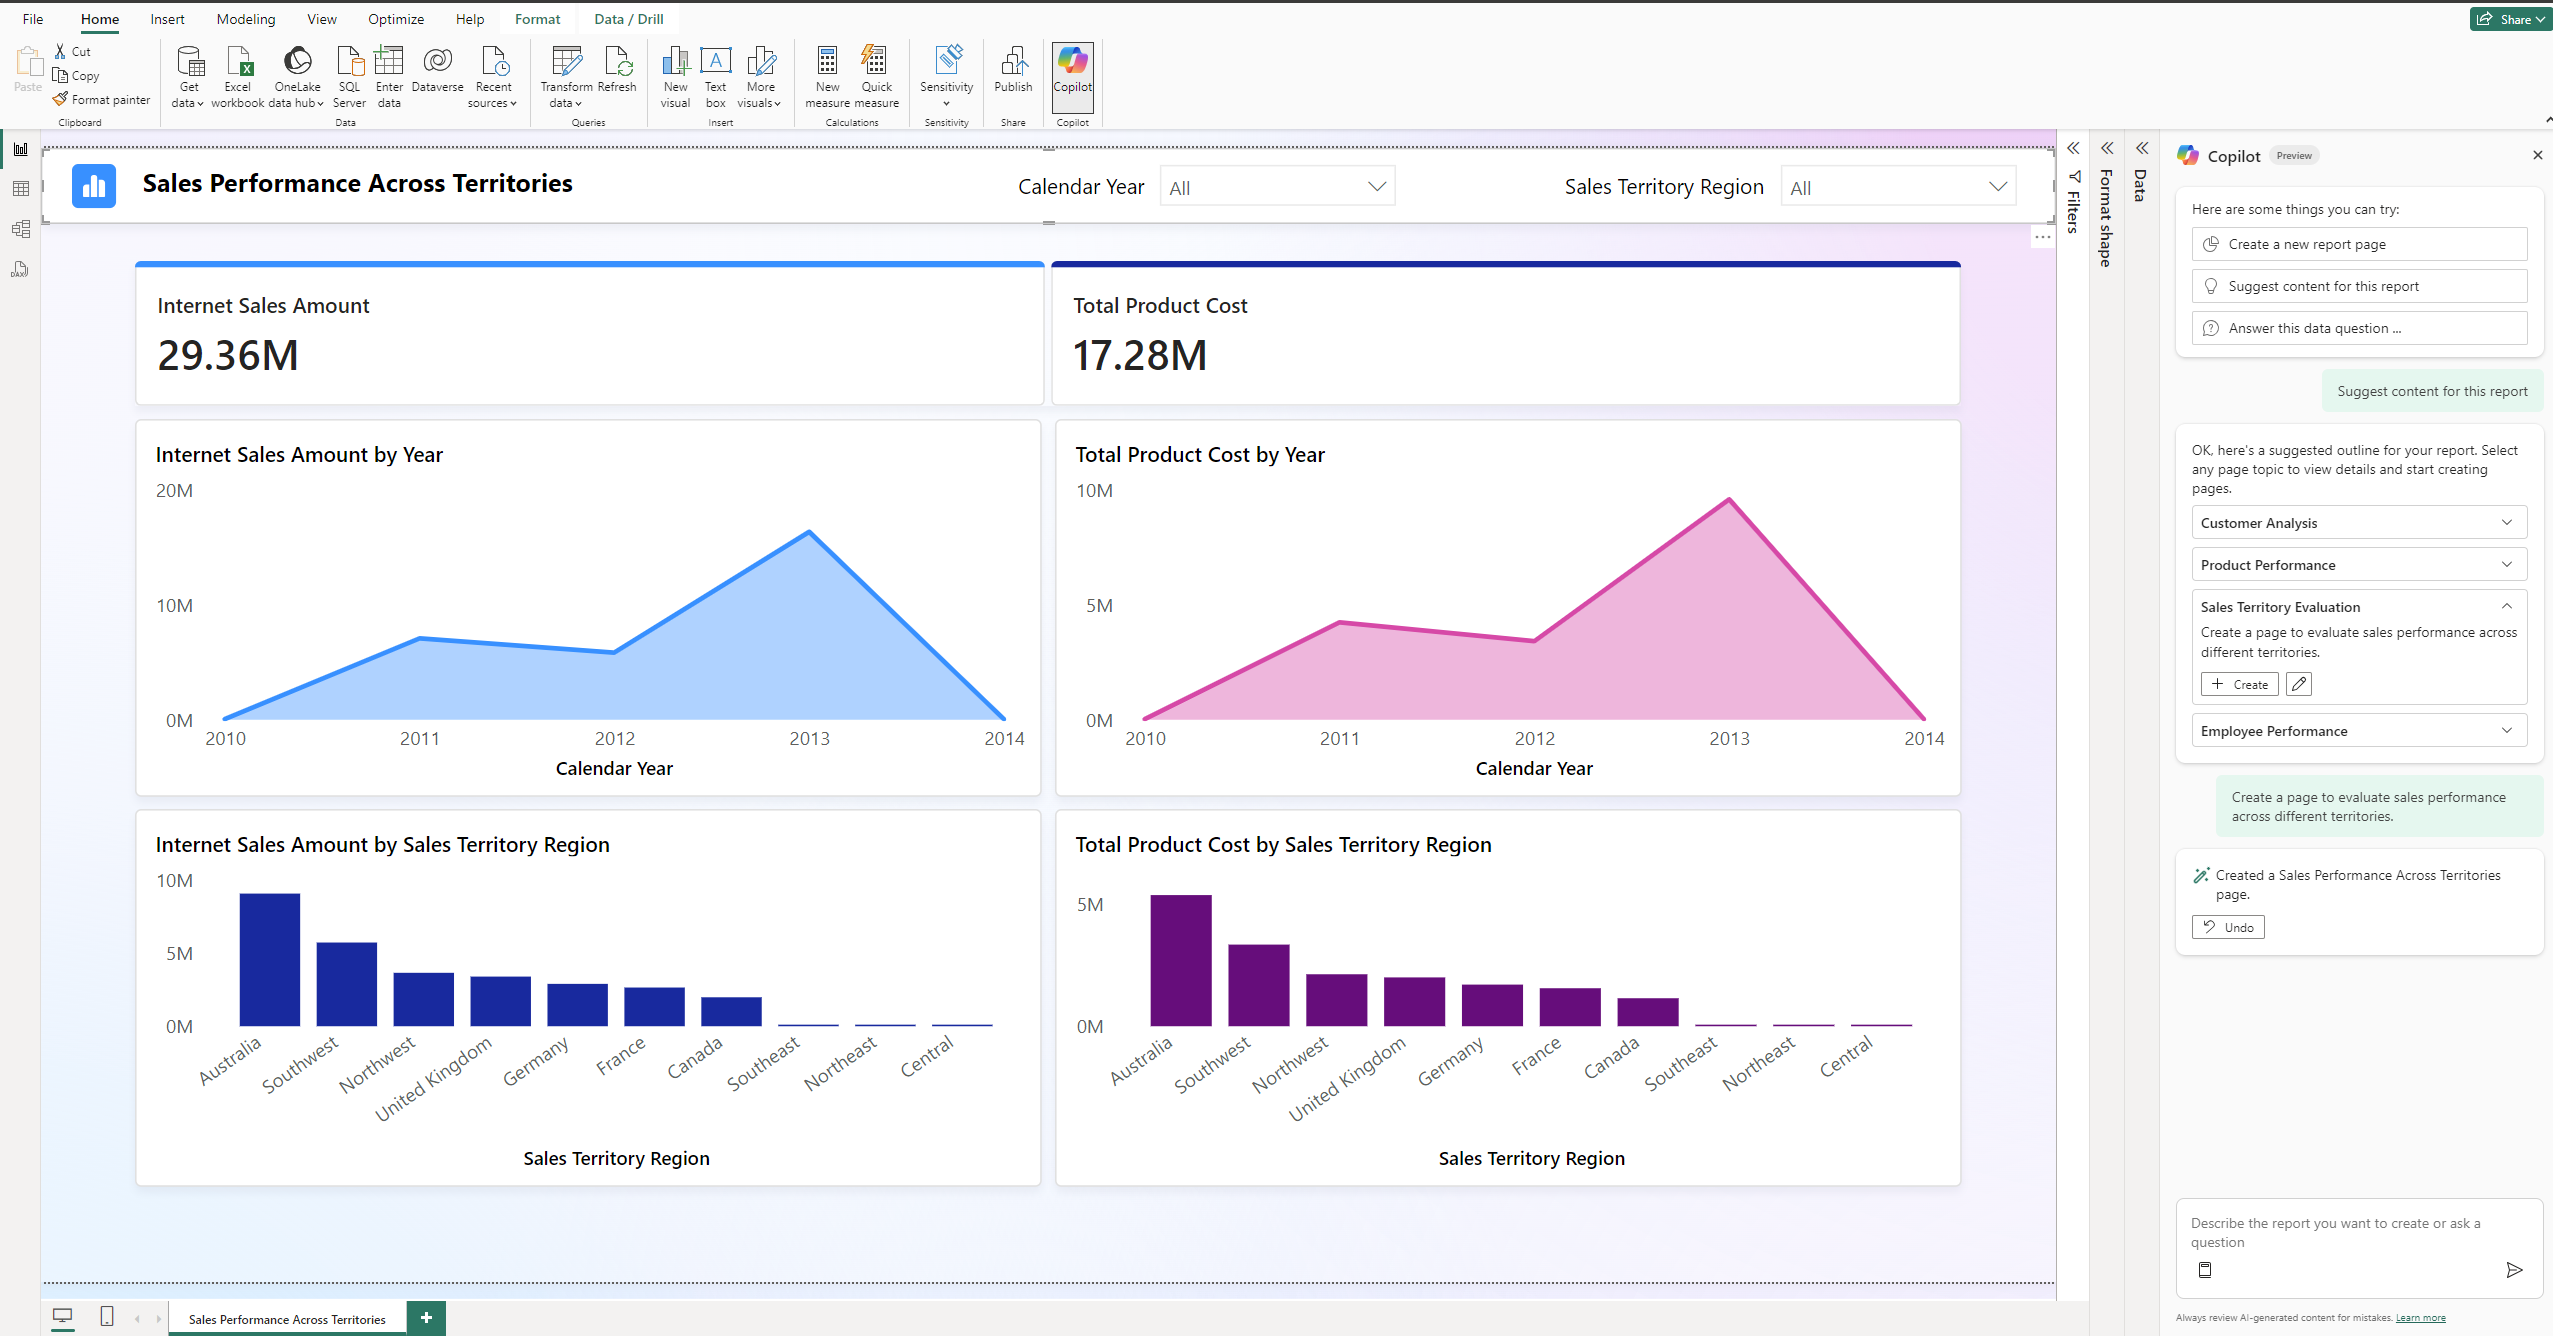
In the ribbon, select the Copilot icon.
Tip
If you don't see Copilot, your admins might not have enabled it in Microsoft Fabric, or you might not have selected a semantic model. Select a semantic model to see it.
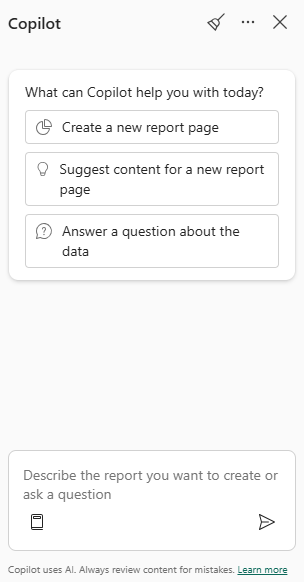
In the Copilot pane, select Suggest content for this report to have Copilot evaluate your data and make suggestions, or enter a prompt to describe the report or visuals you want Copilot to create.
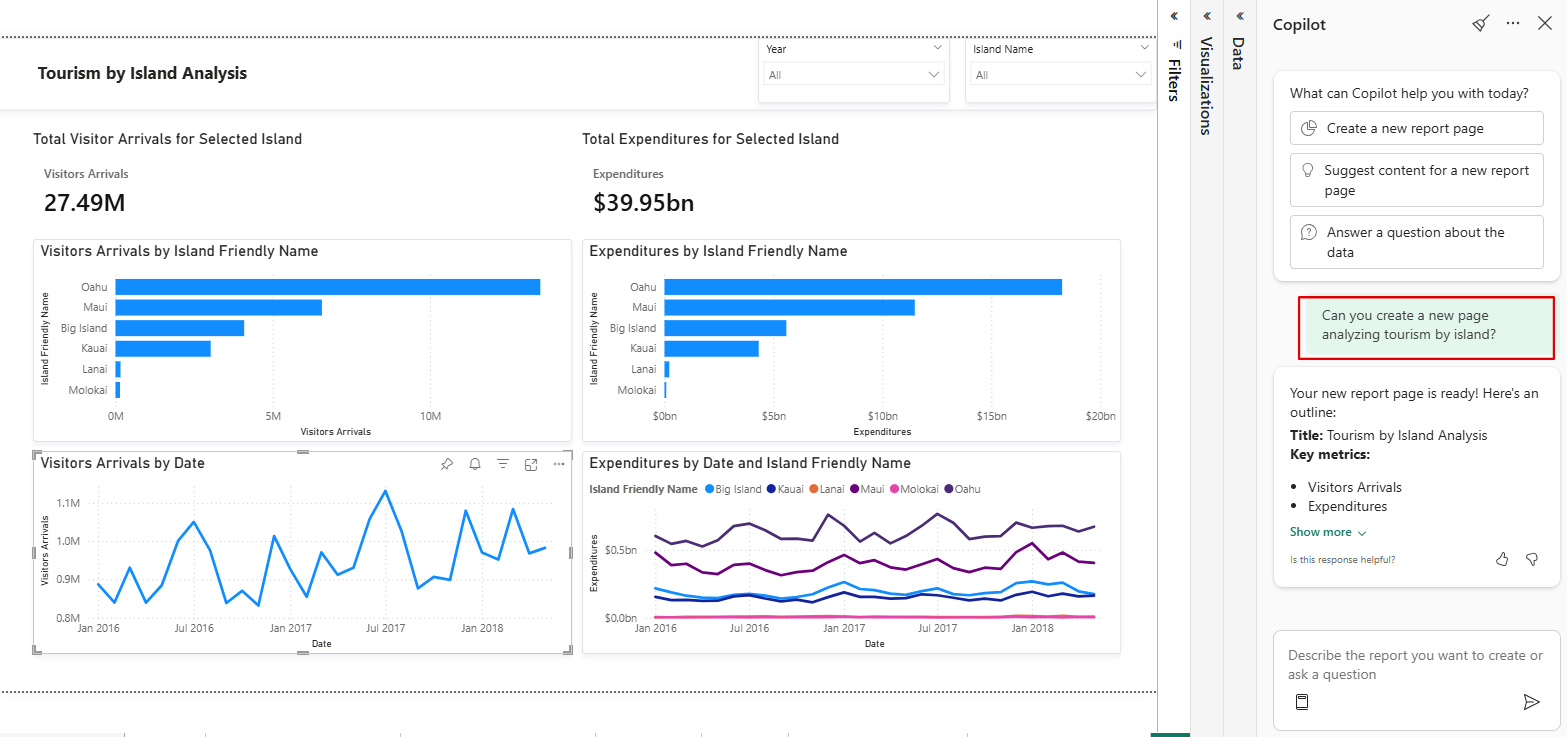
Copilot generates a report page based on your request.
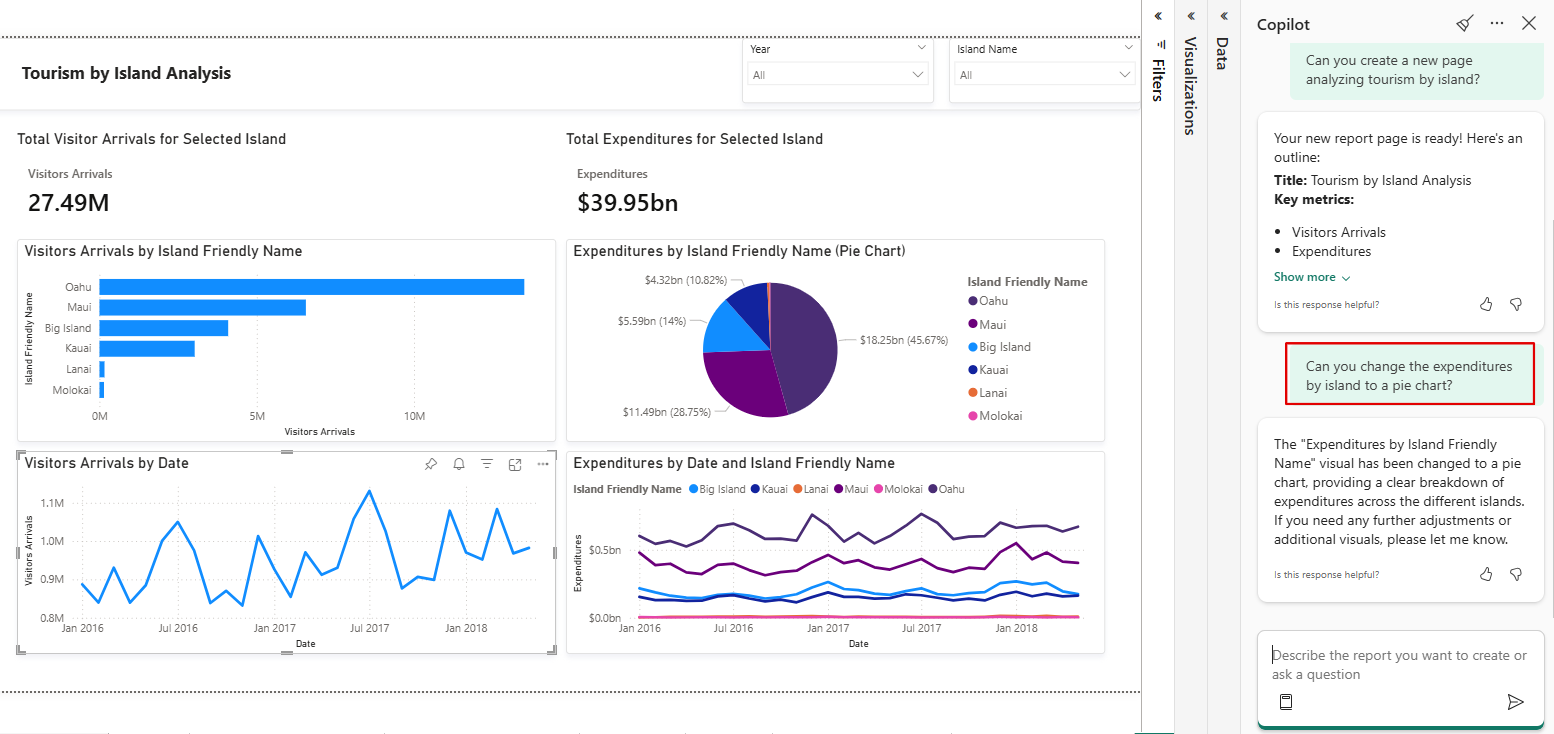
To further edit the report, prompt Copilot to add, delete, or change visuals.
If you need help writing prompts, see Write Copilot prompts that produce results in Power BI.
Create and edit reports
With updates to report creation in Power BI, you can work with Copilot to both create and edit report pages. These improvements provide more control, flexibility, and visual intelligence when building reports.
- Smarter report creation: Copilot delivers more accurate and relevant visuals, automatically selecting the best way to represent your data. It also supports a wider range of visual types, helping you present insights in the format that best fits your needs.
- Flexible editing: In addition to creating new pages, you can:
- Add visuals to existing report pages.
- Change visuals by selecting new visual types or adjusting their fields.
- Delete visuals you no longer need.
- Use undo and redo to reverse recent Copilot actions.
Create a narrative summary
You can also use Copilot for Power BI to create a narrative summary with just a few clicks. This narrative summarizes the entire report, specific pages, or even specific visuals. The summary helps you plan what visualizations you want to include in your report. See Create a narrative summary visual with Copilot for Power BI to learn how.
Save the report
In the Power BI service, save the report as you would any other when you're satisfied with it. If you close and reopen a Copilot-generated report, it opens in Reading view without the Copilot pane.
- Select Edit to see the Copilot button again.
Considerations and limitations
The following limitations apply when you create pages in specific semantic model scenarios.
- Q&A feature switch: Turn on the Q&A feature switch for your model to use Copilot for report creation and editing.
- Real-time streaming models: Copilot can't create report pages for semantic models that use real-time streaming.
- Live connection to Analysis Services: Copilot can't create pages for semantic models connected live to Analysis Services.
- Semantic models with implicit measures disabled: Copilot can't create report pages if you disable implicit measures in your semantic model.
- Custom visuals: Copilot doesn't support custom visuals.
- Styling changes: Copilot doesn't support styling or formatting changes.
- Complex visuals: Changing complex visuals might cause some loss of detail or formatting.