SQL Server
A family of Microsoft relational database management and analysis systems for e-commerce, line-of-business, and data warehousing solutions.
13,252 questions
This browser is no longer supported.
Upgrade to Microsoft Edge to take advantage of the latest features, security updates, and technical support.
' cx='32' cy='32' r='32' /%3E%3Ctext x='50%25' y='55%25' dominant-baseline='middle' text-anchor='middle' fill='%23FFF' %3EHK%3C/text%3E%3C/svg%3E)
We are currently observing a significant time difference when processing dimensions in SSAS 2019. Each one of them takes about ten times longer to process and we are unable to find a good reason for it.
To test this we've build the following setup:
Processing a small dimension with 116 rows and 2 attributes with an generated xmla script in the freshly deployed database takes 3 seconds in SSAS 2017 and 28 seconds in SSAS 2019.
We have checked the following options so far:
The OLAP database is very large, it contains about 450 dimensions and 53 cubes with 200 measuregroupes.
Any idea what might cause this? I can provide an empty database but for two dimensions and the OLAP project in question we used for testing and could replicate on a number of different servers.
Regards
Holger Kühn

Hi @Holger Kühn ,
Welcome to Microsoft Q&A!
I suggest that you could use some tools to monitor SSAS. I am used to analysis by SQL Server Profiler, but please noted that this feature will be removed in a future version of Microsoft SQL Server. Avoid using this feature in new development work, and plan to modify applications that currently use this feature.
During SSAS multi-dimensional MOLAP processing, SSAS will opens concurrent connections to each data source to execute SELECT queries to get data from the relational database, then create the indexes files in SSAS data folder. We need to look at the Profiler trace to see how much time is spent on reading relational database data, and how much time is creating aggregations, indexes, etc. At the end of processing is the commit. Knowing how much time the processing command spends at each stage can help us isolate the cause of the problem. The best way to get familiar with Profiler trace on processing is to run a simple processing command, then look at the events in Profiler.
Best regards,
Carrin
If the answer is the right solution, please click "Accept Answer" and kindly upvote it. If you have extra questions about this answer, please click "Comment".
Note: Please follow the steps in our documentation to enable e-mail notifications if you want to receive the related email notification for this thread.
This answer has been deleted due to a violation of our Code of Conduct. The answer was manually reported or identified through automated detection before action was taken. Please refer to our Code of Conduct for more information.
Comments have been turned off. Learn more
Hi Carrin,
Thanks for your tips, but as I wrote there is only the processing from one dimension on a freshly depoyed cube, so not aggregations and such. The SELECT query is at 543 ms, so this is not explaininng the 30sec processing.
As I can not attatch xel-files directly you can find them here. The xlsx is showing the SELECT - Query in Profiler:
https://kumo.dachs.blog/processing-dimensions-in-ssas-2019-takes-ten-times.zip
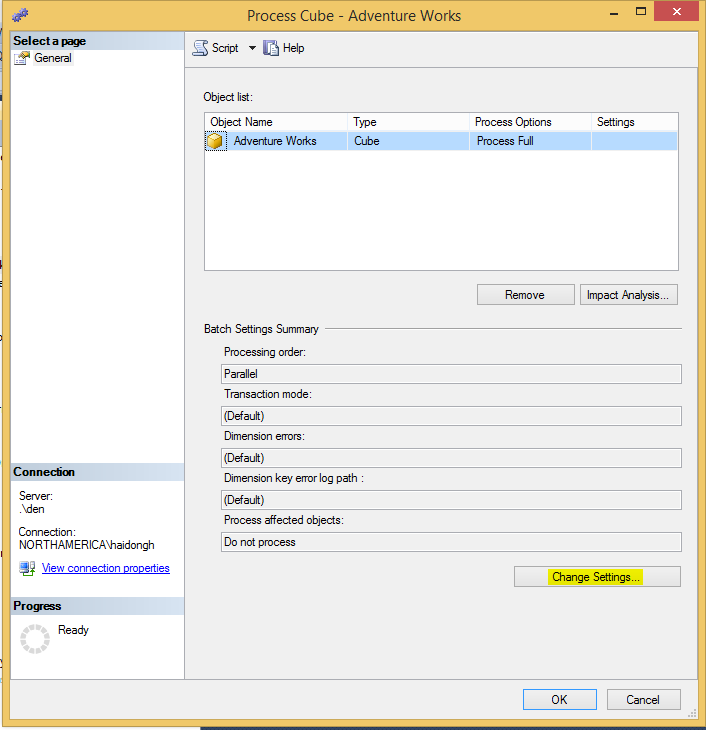
The processing was started with the following XMLA:
<Batch xmlns="http://schemas.microsoft.com/analysisservices/2003/engine">
  <Parallel>
    <Process xmlns:xsd="http://www.w3.org/2001/XMLSchema" xmlns:xsi="http://www.w3.org/2001/XMLSchema-instance" xmlns:ddl2="http://schemas.microsoft.com/analysisservices/2003/engine/2" xmlns:ddl2_2="http://schemas.microsoft.com/analysisservices/2003/engine/2/2" xmlns:ddl100_100="http://schemas.microsoft.com/analysisservices/2008/engine/100/100" xmlns:ddl200="http://schemas.microsoft.com/analysisservices/2010/engine/200" xmlns:ddl200_200="http://schemas.microsoft.com/analysisservices/2010/engine/200/200" xmlns:ddl300="http://schemas.microsoft.com/analysisservices/2011/engine/300" xmlns:ddl300_300="http://schemas.microsoft.com/analysisservices/2011/engine/300/300" xmlns:ddl400="http://schemas.microsoft.com/analysisservices/2012/engine/400" xmlns:ddl400_400="http://schemas.microsoft.com/analysisservices/2012/engine/400/400" xmlns:ddl500="http://schemas.microsoft.com/analysisservices/2013/engine/500" xmlns:ddl500_500="http://schemas.microsoft.com/analysisservices/2013/engine/500/500">
      <Object>
        <DatabaseID>SSAS_Test</DatabaseID>
        <DimensionID>Abrechnungsaktion</DimensionID>
      </Object>
      <Type>ProcessFull</Type>
      <WriteBackTableCreation>UseExisting</WriteBackTableCreation>
    </Process>
  </Parallel>
</Batch>
Holger
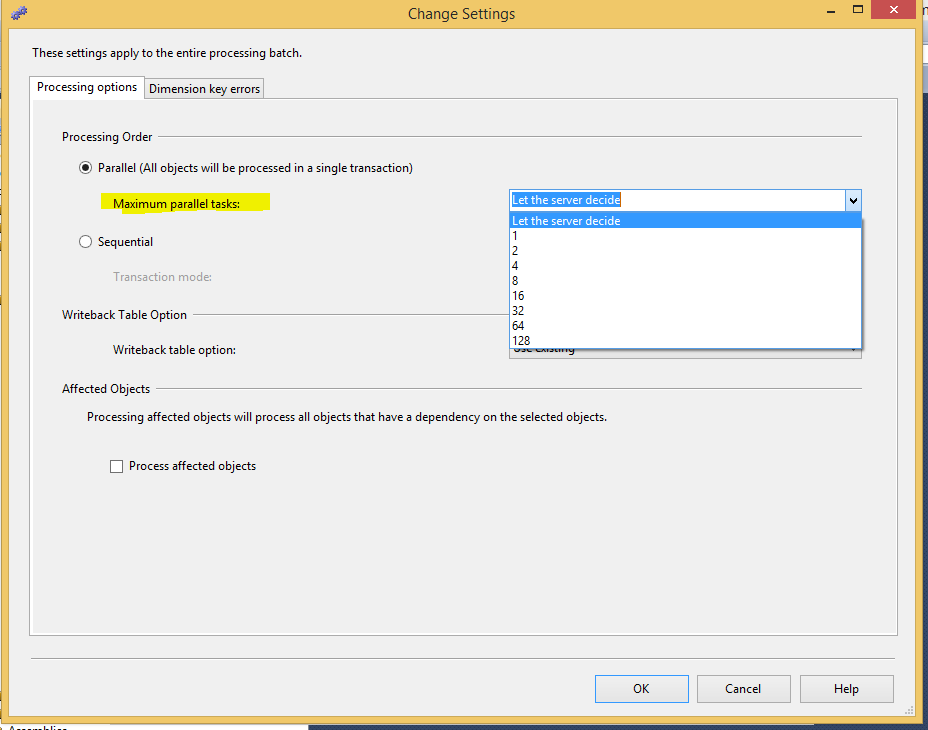
Hi @Holger Kühn , thanks for your reply. Processing Analysis Services dimensions and partitions is a resource-intensive operation. It should use all of the resources—CPU, memory, and disk I/O—available to Analysis Services. There are a few settings that can impact process parallelism of processing jobs on SSAS. Too little parallelism can cause underutilization of SSAS resources, and too much parallelism can cause relational database become too busy, or even error out. And also, maybe you could try to update it to latest CU 14. For more information, please refer to SQL Server Analysis Services Processing Order Options and Why an Upgrade can Cause Performance Regressions (Dear SQL DBA Episode 9).
3: https://www.littlekendra.com/2016/07/21/why-can-an-upgrade-cause-performance-regression-dear-sql-dba-episode-9/ 5: /api/attachments/168109-1-2.png?platform=QnA
' cx='32' cy='32' r='32' /%3E%3Ctext x='50%25' y='55%25' dominant-baseline='middle' text-anchor='middle' fill='%23FFF' %3EBW%3C/text%3E%3C/svg%3E)
I am currently having the same issue and reading your responses to this problem are not in the least helpful, as in my case all of these settings are configured. I am not using 2019 but am running on 2022, and as in this case, I also am upgraded from a 2017 environment that runs 10x's faster than than 2022 currently is.
' cx='32' cy='32' r='32' /%3E%3Ctext x='50%25' y='55%25' dominant-baseline='middle' text-anchor='middle' fill='%23FFF' %3EHB%3C/text%3E%3C/svg%3E)
We are also having the same issue with an SSAS 2022 database, and have yet to find the reason. In our case, the processing of the exact tables/partitions has slowly risen from 1.5 minutes to over 8 minutes over the past week, adding about 1 minute to the processing time each day. Looking at the SQL Profiler logs, the majority of the time is being spent on the 'Commit' phase. Here is an example of a process 'full' for a single partition containing 2500 records, in an otherwise empty database.