Note
Access to this page requires authorization. You can try signing in or changing directories.
Access to this page requires authorization. You can try changing directories.
Query Performance Insight provides intelligent query analysis for databases in an Azure Database for PostgreSQL flexible server. It helps you identify the top resource-consuming and long-running queries in your workload. This information helps you find the queries to optimize to improve overall workload performance and efficiently use the resource that you're paying for. Query Performance Insight helps you spend less time troubleshooting database performance by providing:
- Identification of your long running queries, and how they change over time.
- Determination of the wait types affecting those queries.
- Details on top database queries by calls (execution count), by data-usage, by IOPS, and by temporary file usage (potential tuning candidates for performance improvements).
- The ability to drill down into details of a query, to view the query ID and history of resource utilization.
- Deeper insight into overall databases resource consumption.
Prerequisites
- Query store is enabled on your database. If query store isn't running, the Azure portal prompts you to enable it. To enable query store, see Enable query store.
Note
Query store is currently disabled. Query Performance Insight depends on query store data. You need to enable it by setting the dynamic parameter pg_qs.query_capture_mode to either ALL or TOP.
- Query store wait sampling is enabled on your database. If query store wait sampling isn't running, the Azure portal prompts you to enable it. To enable query store wait sampling, see Enable query store wait sampling.
Note
Query store wait sampling is currently disabled. Query Performance Insight depends on query store wait sampling data. You need to enable it by setting the dynamic parameter pgms_wait_sampling.query_capture_mode to ALL.
- Log Analytics workspace is configured for storing three log categories including - PostgreSQL Sessions data, PostgreSQL query store Runtime, and PostgreSQL query store Wait Statistics. To configure log analytics, see Configure and access logs.
Note
Query store data isn't transmitted to the log analytics workspace. The logs (Sessions data, Query Store Runtime, and Query Store Wait Statistics) aren't sent to the log analytics workspace, which is necessary to use Query Performance Insight. To configure the diagnostic settings for an Azure Database for PostgreSQL flexible server and send the data to a log analytics workspace, see Configure and access logs in Azure Database for PostgreSQL.
Permissions
To use Query Performance Insight with Azure Database for PostgreSQL flexible server, you need the following Azure role-based access control (Azure RBAC) permissions assigned to your PostgreSQL flexible server:
- Microsoft.DBforPostgreSQL/flexibleServers/configurations/read
- Microsoft.DBforPostgreSQL/flexibleServers/providers/Microsoft.Insights/diagnosticSettings/read
- Microsoft.DBforPostgreSQL/flexibleServers/read
- Microsoft.Insights/Components/read
- Microsoft.Insights/DiagnosticSettings/read
- Microsoft.Insights/DiagnosticSettingsCategories/read
- Microsoft.Insights/Logs/AzureDiagnostics/read
- Microsoft.Insights/Logs/read
Using Query Performance Insight
The Query Performance Insight view in the Azure portal provides visualizations on key information from query store. Query Performance Insight is easy to use:
Open the Azure portal and find an Azure Database for PostgreSQL flexible server that you want to examine.
From the left-side menu, open Intelligent Performance > Query Performance Insight.
Select a time range for investigating queries.
On the first tab, review the list of Long Running Queries.
Use sliders or zoom to change the observed interval.
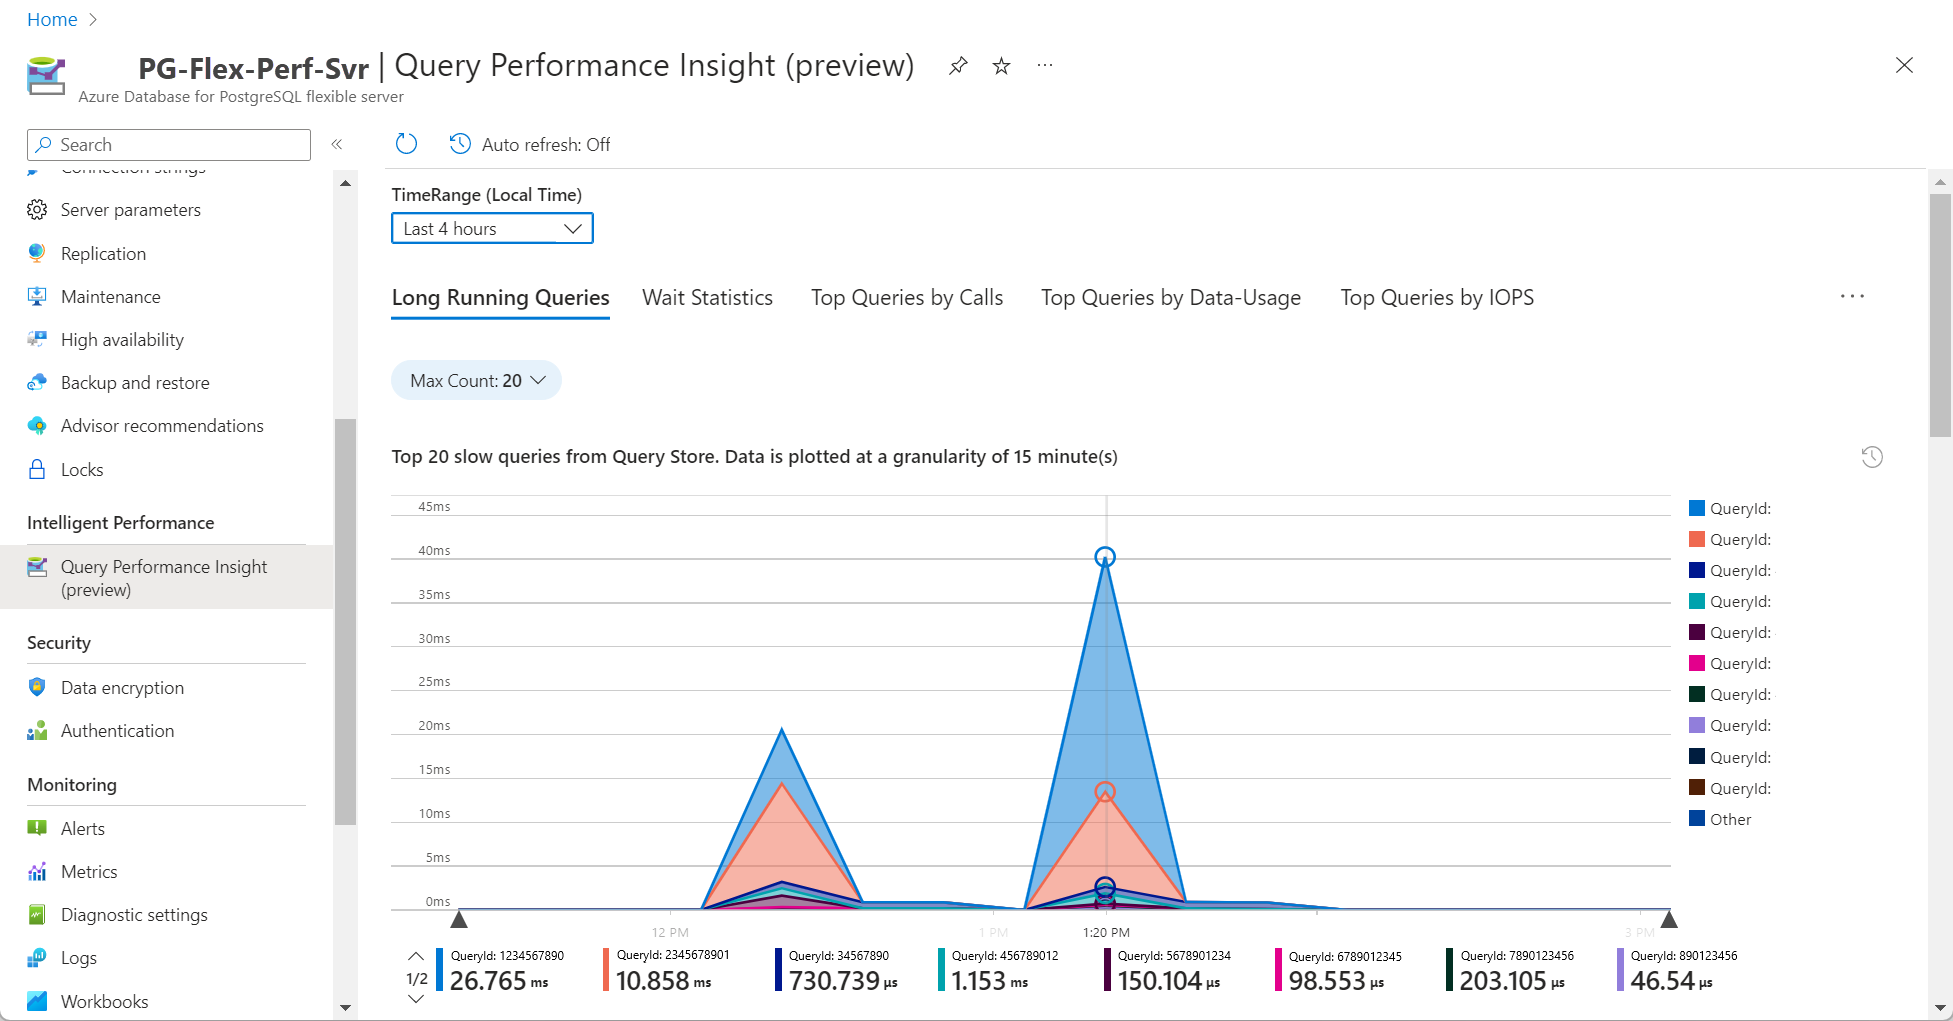
Optionally, select custom to specify a time range.
To view details of a specific query, select the
QueryId Snapshotdropdown.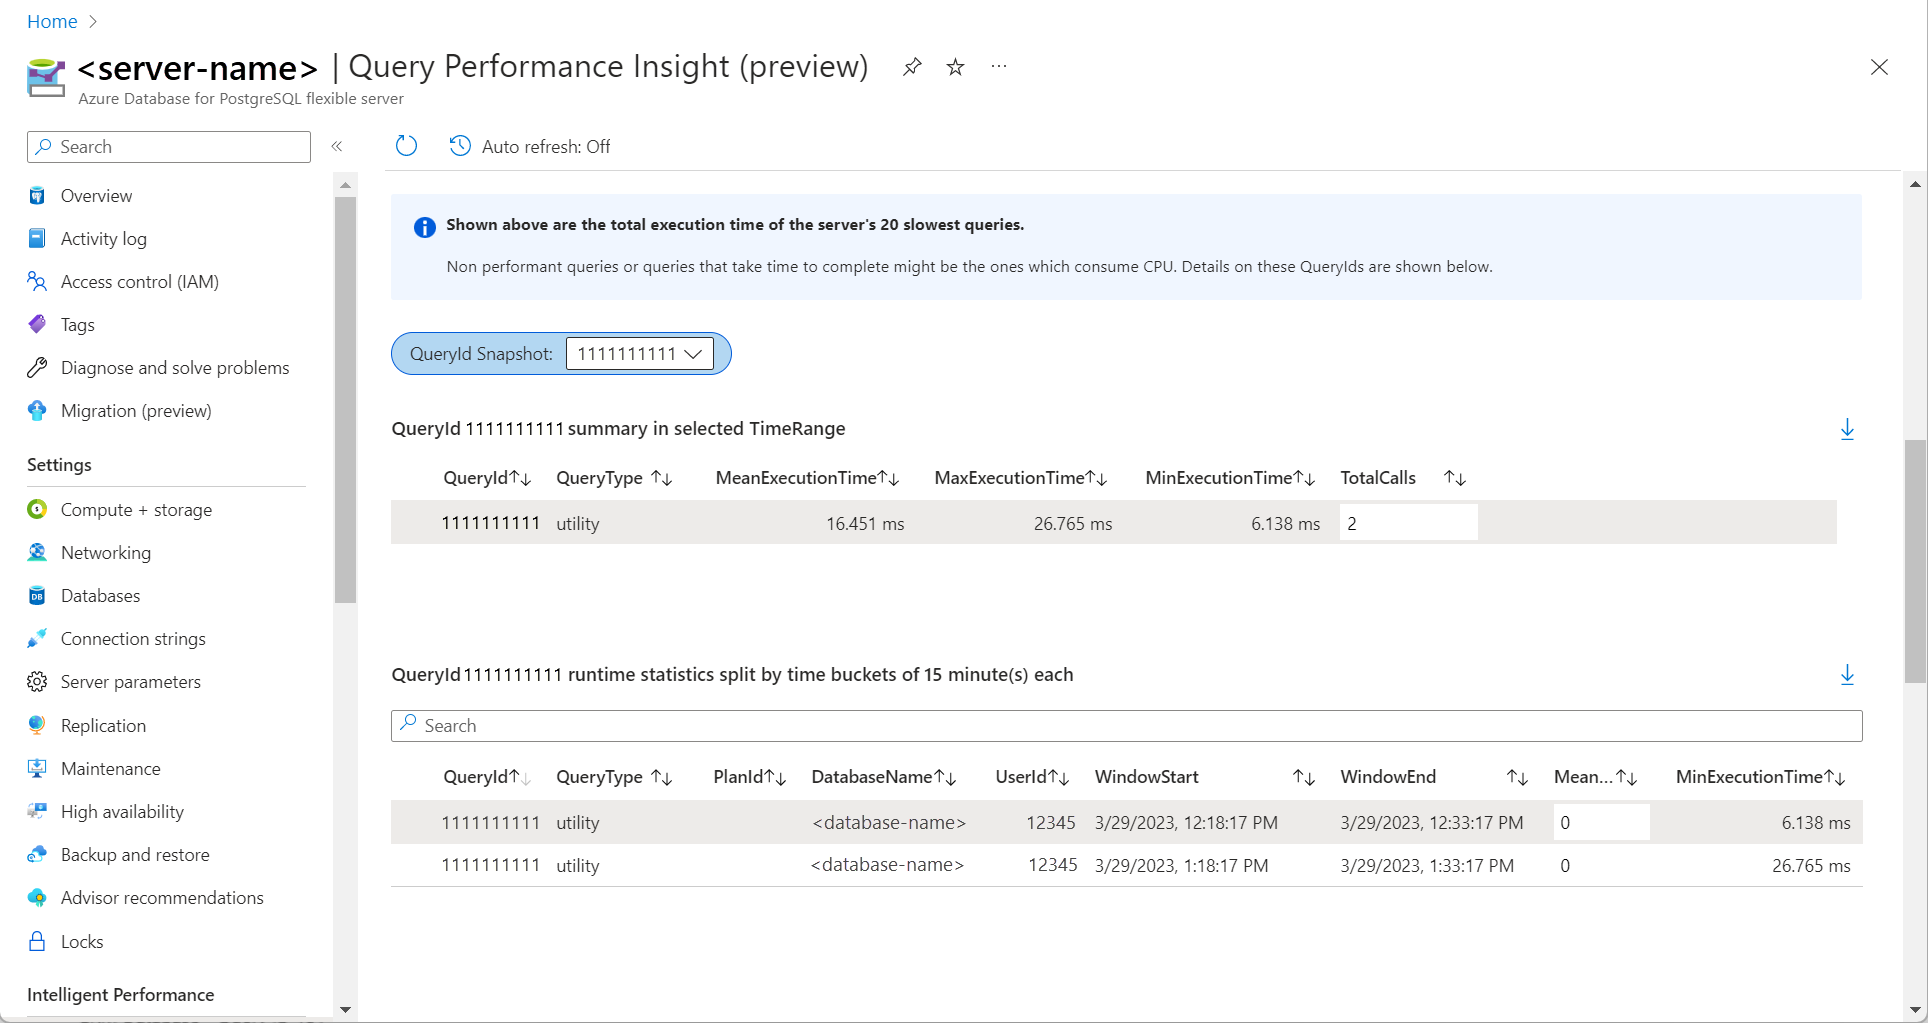
To get the Query Text of a specific query, connect to the
azure_sysdatabase on the server and queryquery_store.query_texts_viewwith theQueryId.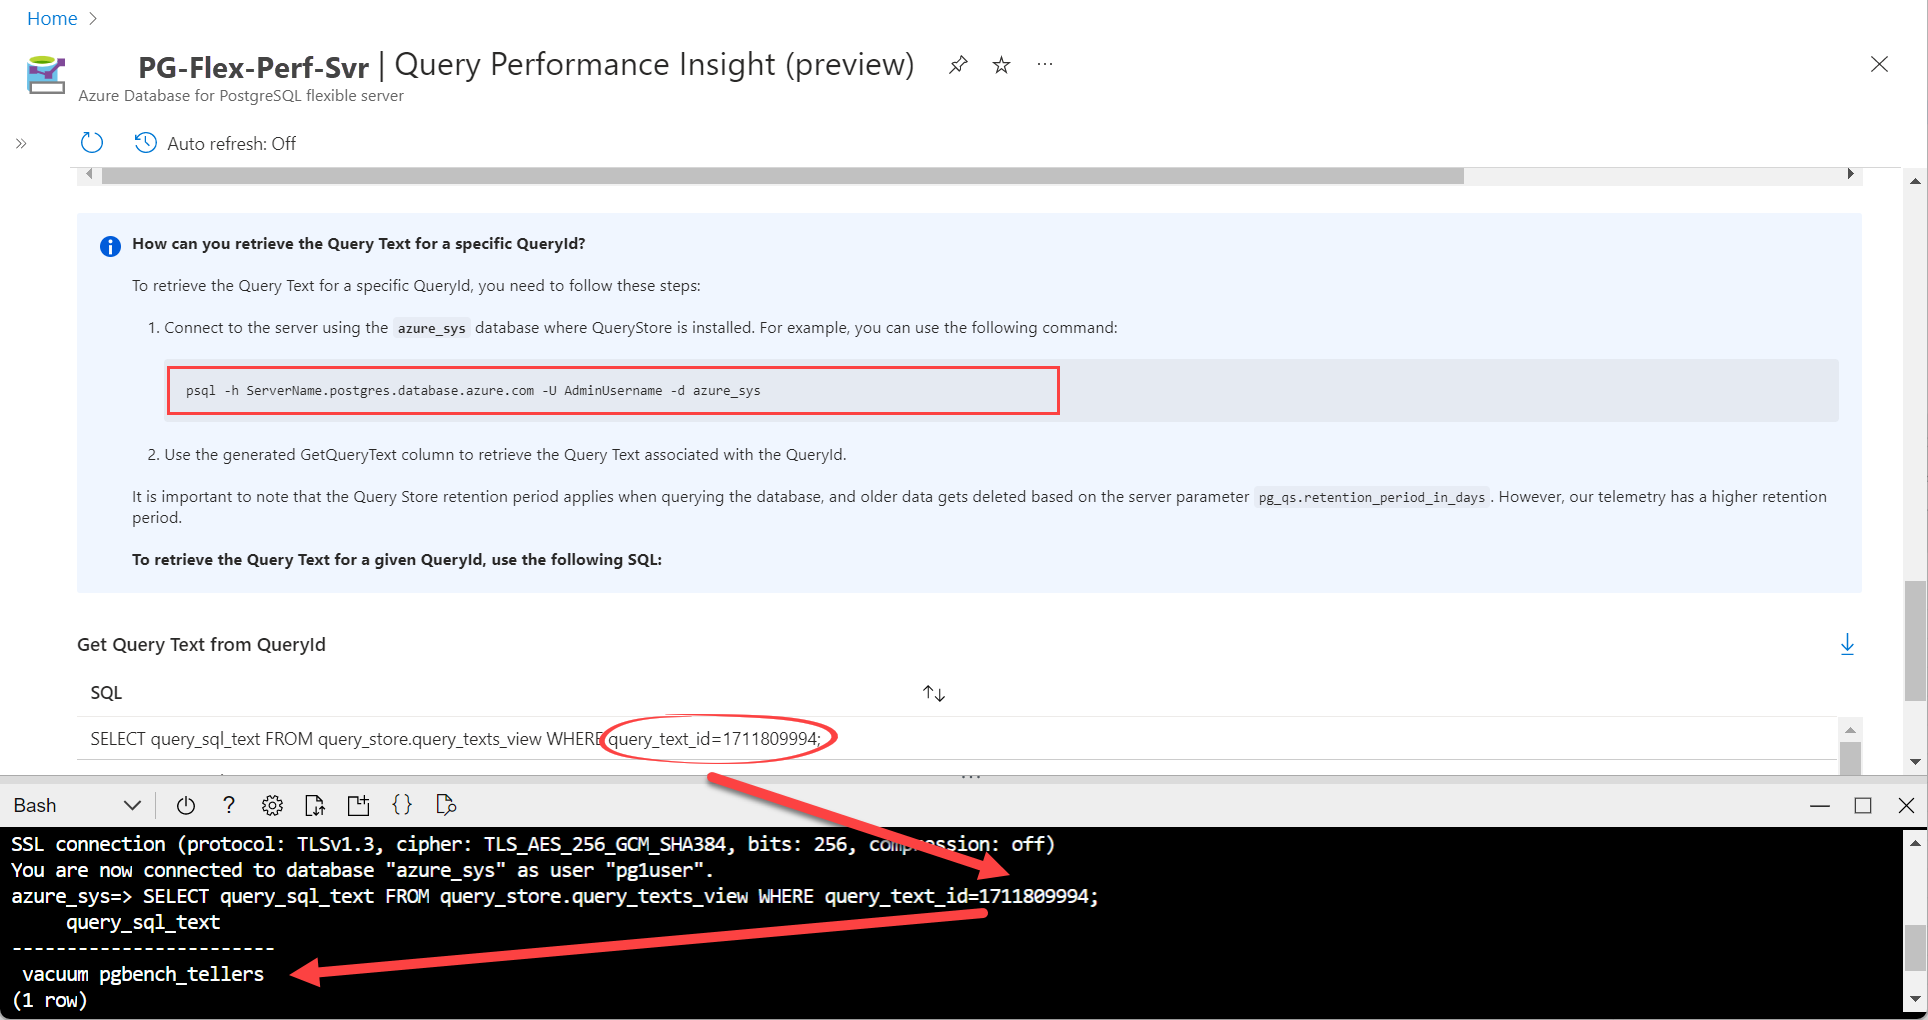
On the consecutive tabs, you can find other query insights, including:
- Wait Statistics
- Top Queries by Calls
- Top Queries by Data-Usage
- Top Queries by IOPS
- Top Queries by Temporary Files
Note
For an Azure Database for PostgreSQL flexible server to render the information in Query Performance Insight, Query store needs to capture a couple hours of data. If the database has no activity or if query store wasn't active during a certain period, the charts are empty when Query Performance Insight displays that time range. You can enable query store at any time if it's not running. For more information, see Best practices with query store.
Considerations
- Query Performance Insight isn't available for read replicas.
- For Query Performance Insight to work, the query store must have data. Since query store is an opt-in feature, it's not enabled by default on a server. You enable or disable query store globally for all databases on a server. You can't turn it on or off for individual databases.
- Enabling query store on the Burstable pricing tier might negatively affect performance. Don't enable it on that tier.