Note
Access to this page requires authorization. You can try signing in or changing directories.
Access to this page requires authorization. You can try changing directories.
Every node in an Azure Database for PostgreSQL flexible server provides access to logs. You can send these logs to your own Log Analytics workspace. Use the logs to identify, troubleshoot, and fix configuration errors and performance issues.
Steps to configure diagnostic settings
Use the Azure portal:
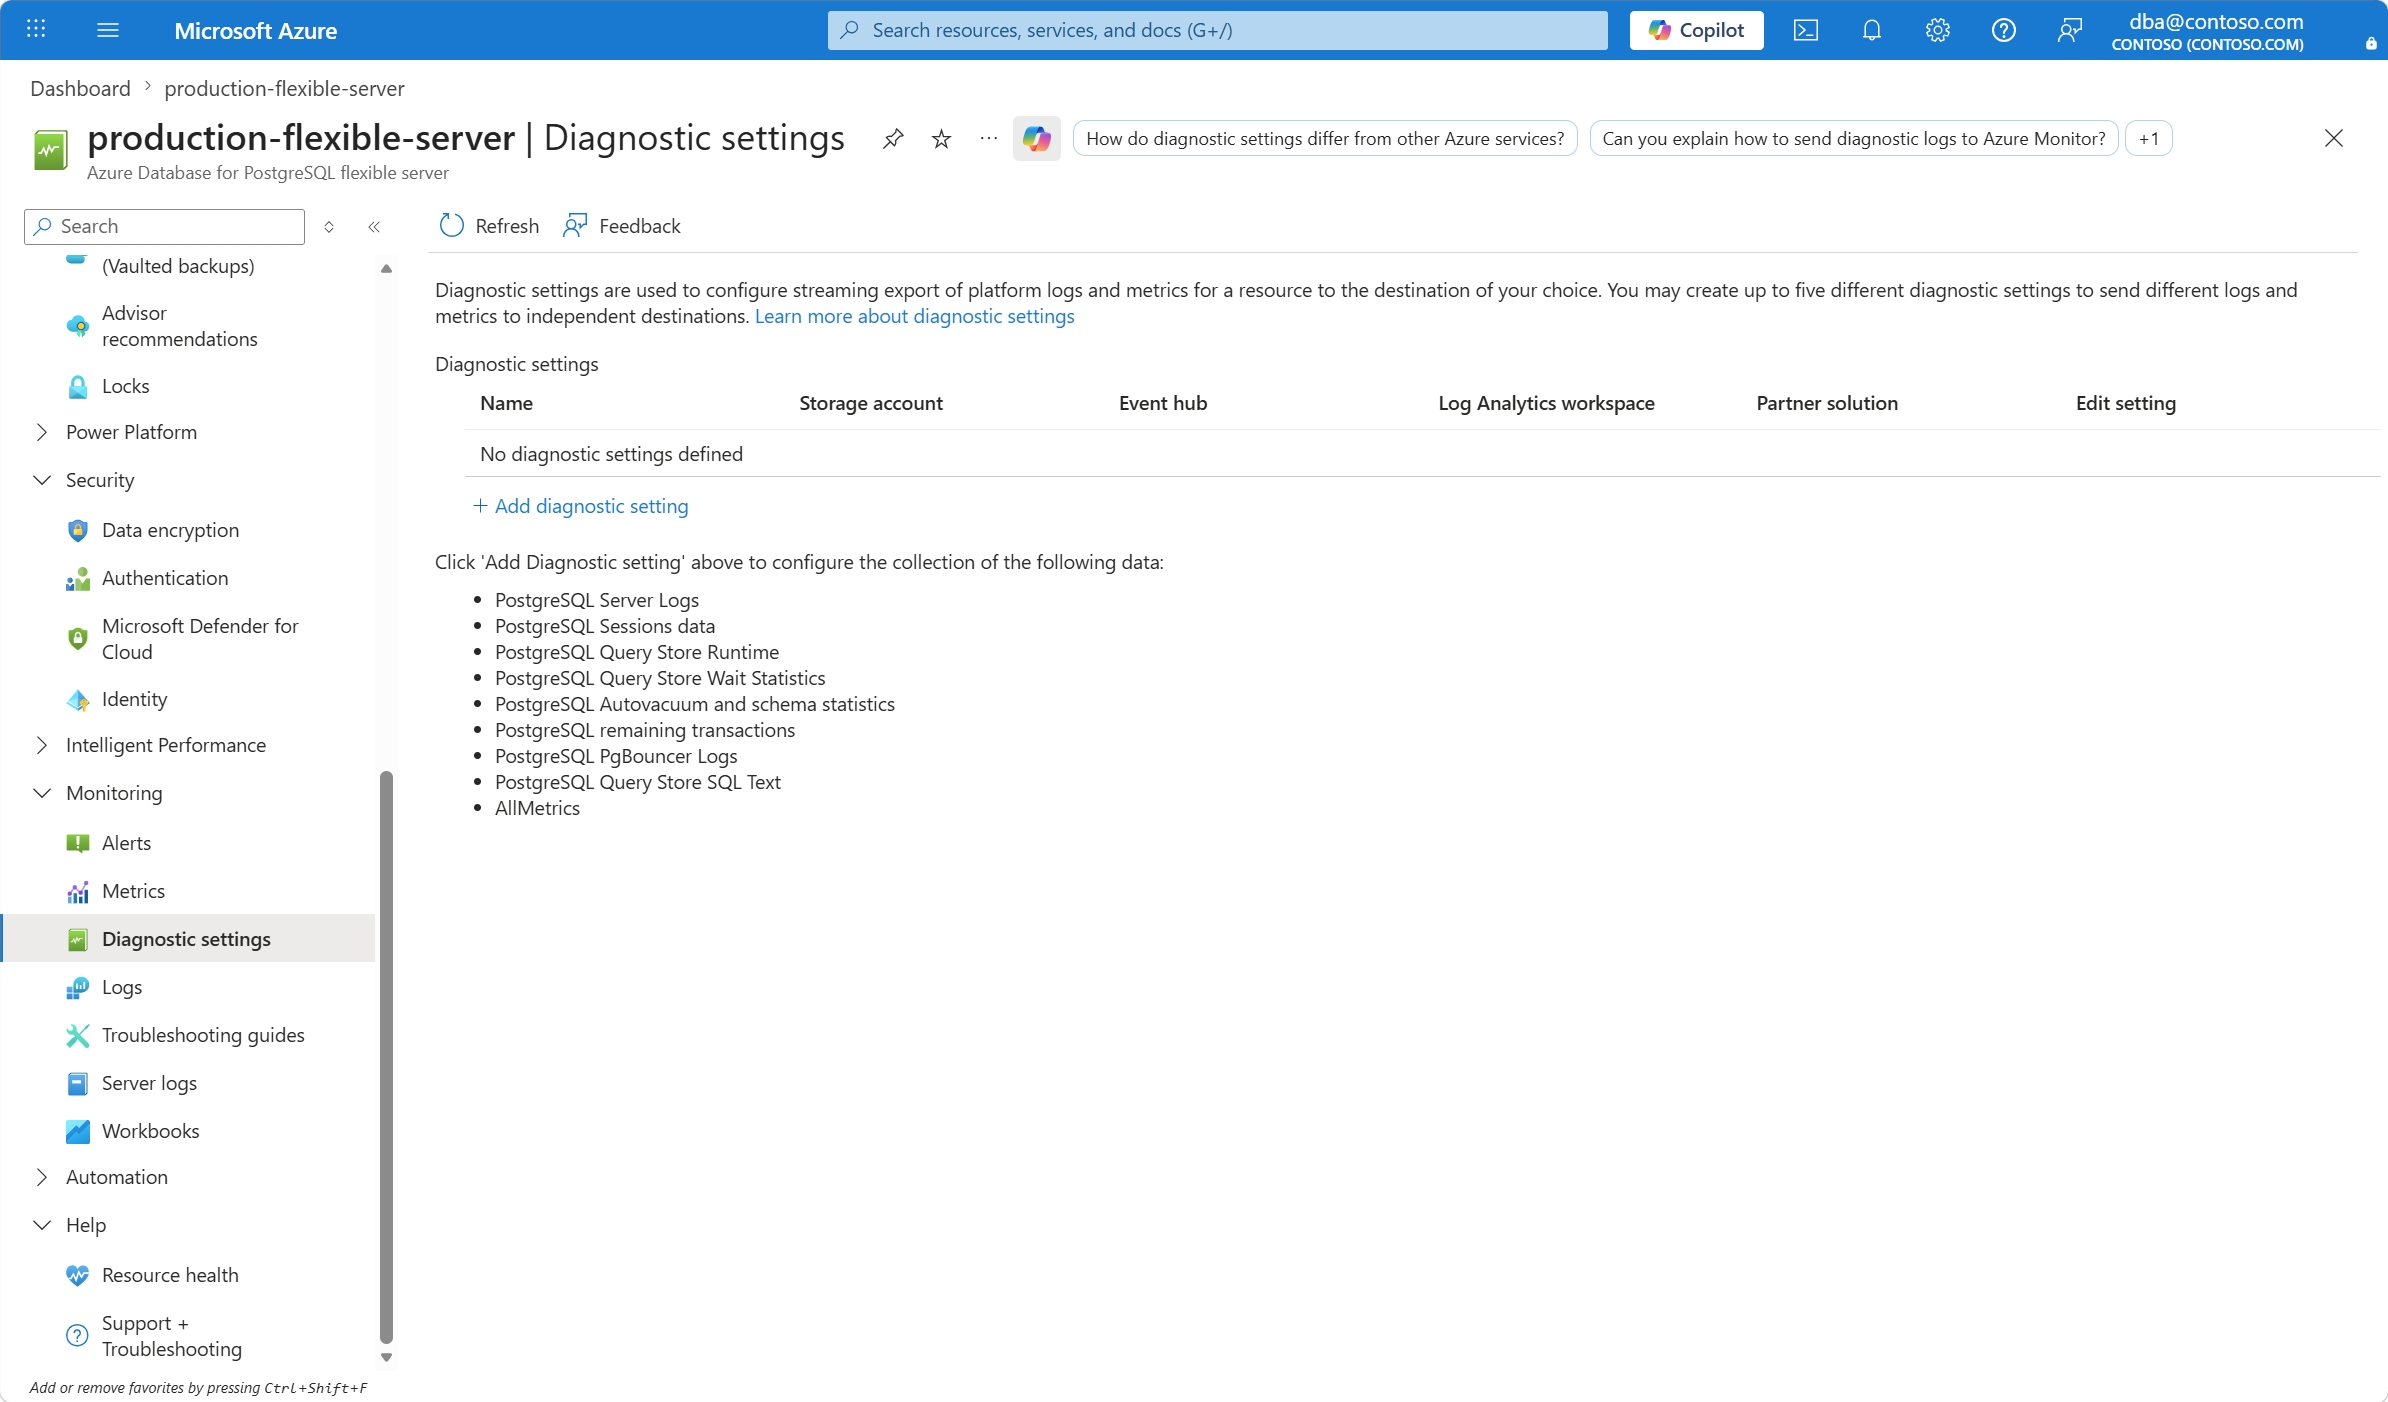
In the resource menu, under the Monitoring section, select Diagnostic settings. Select Add diagnostic setting.
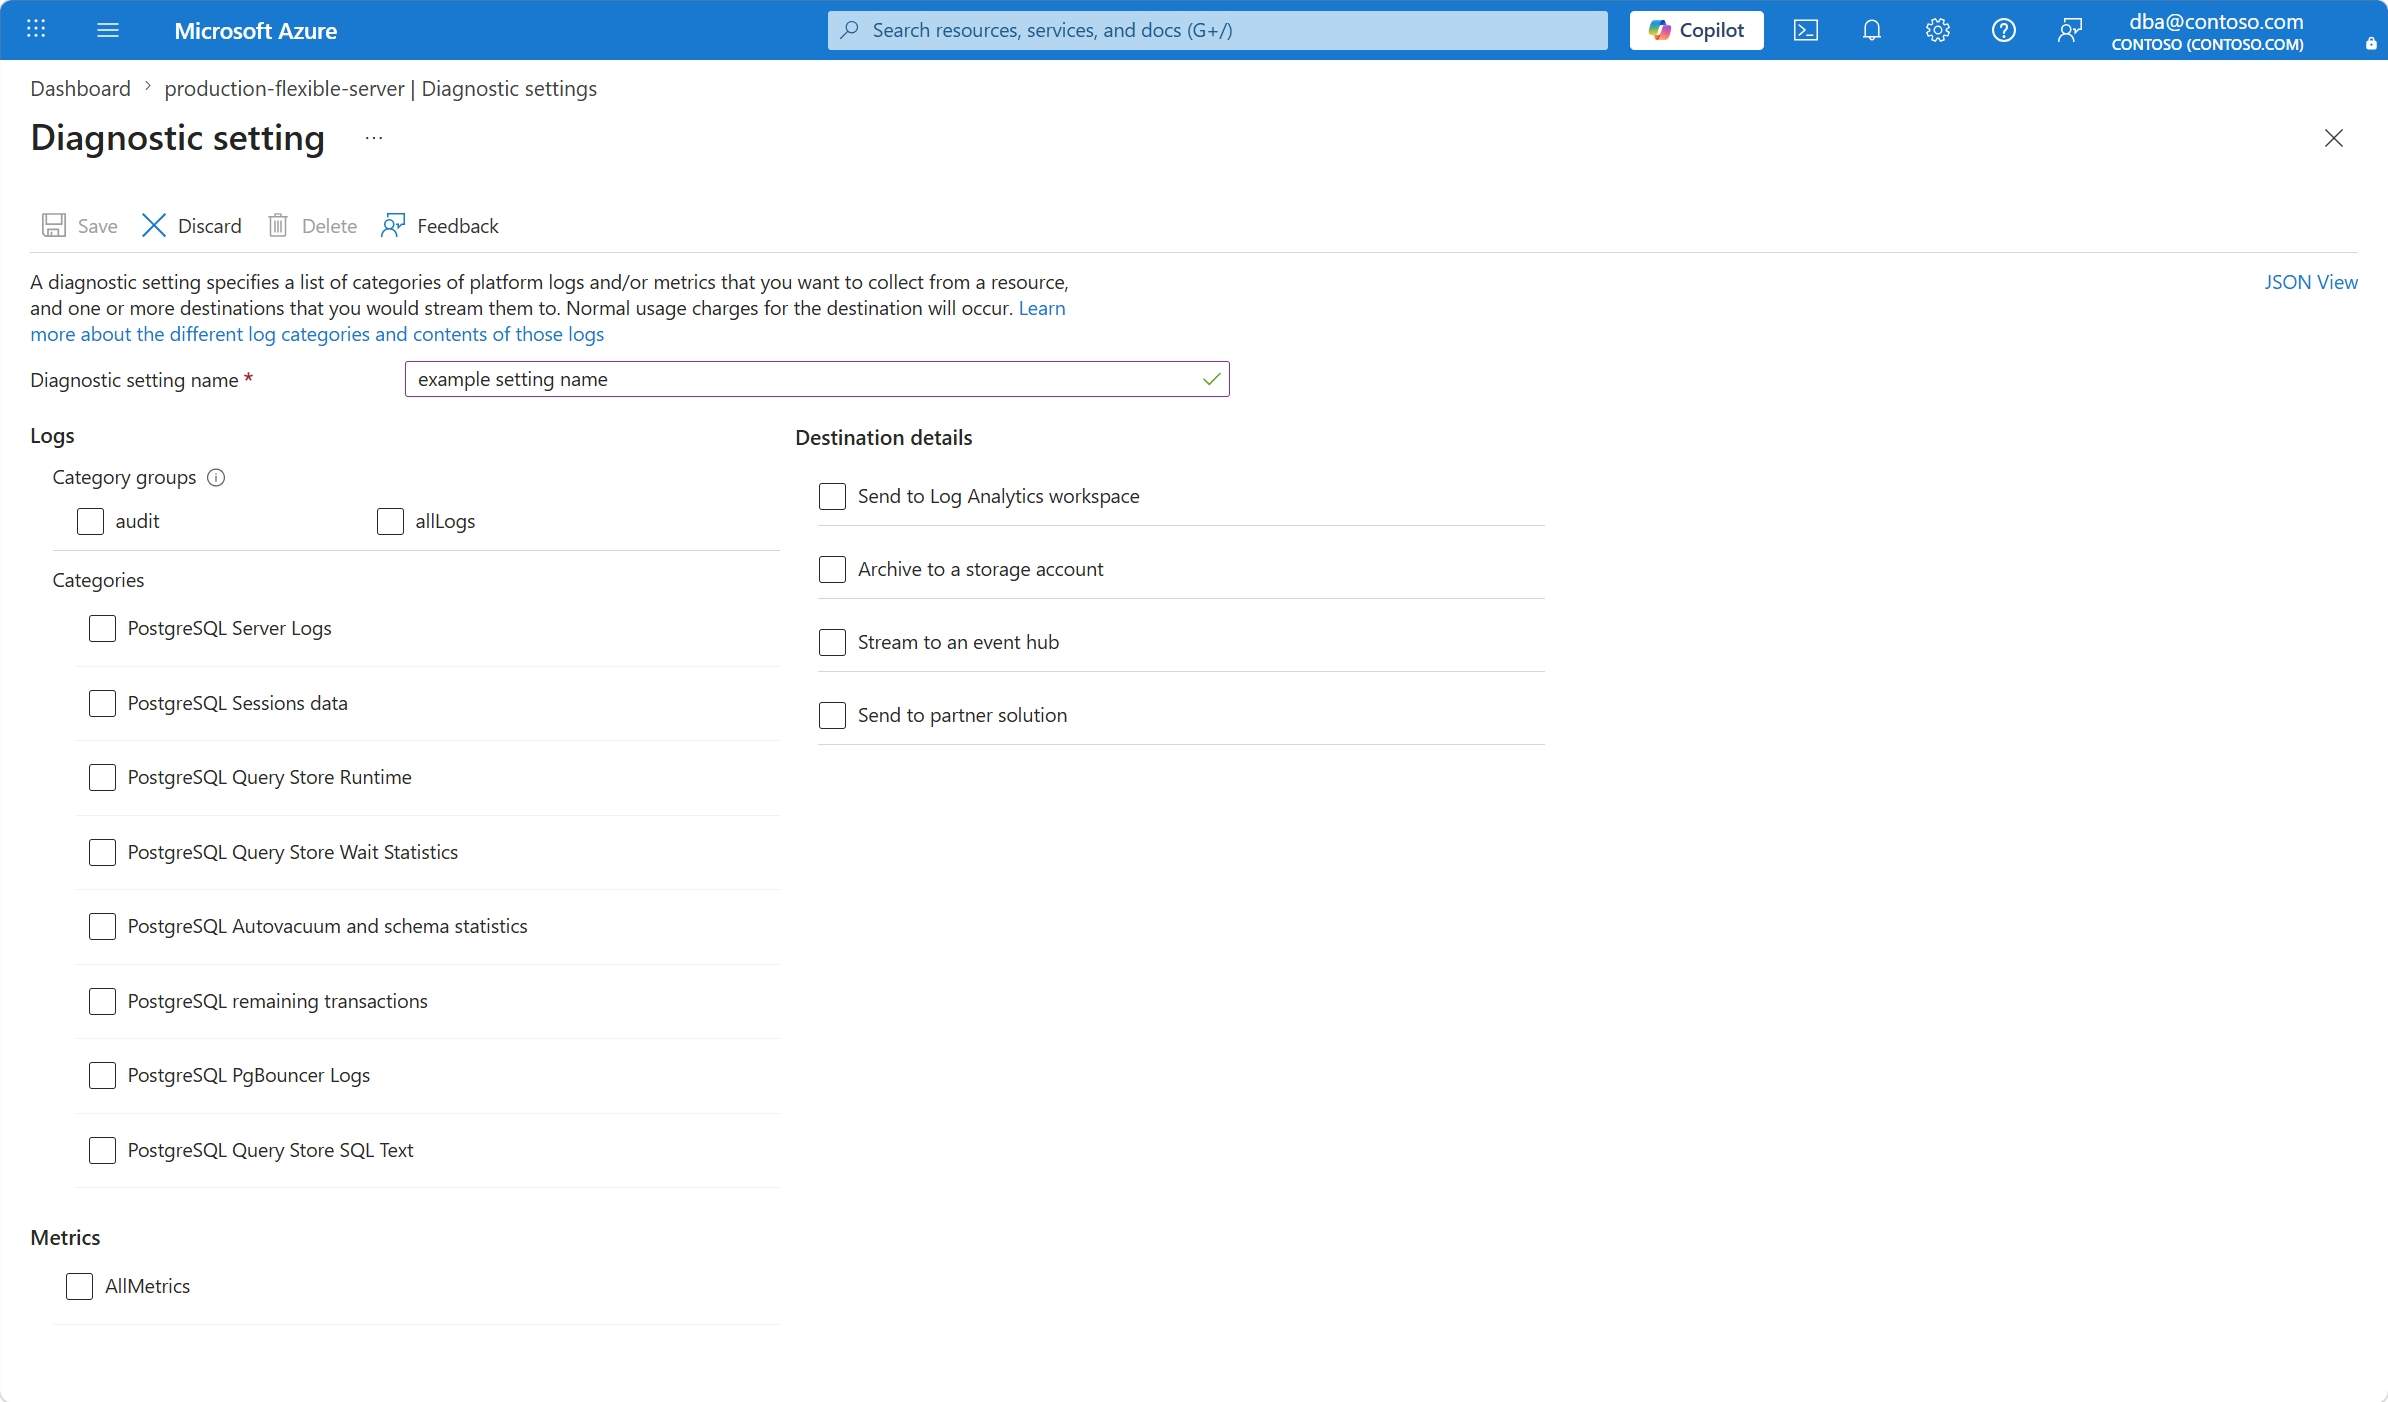
In Diagnostic setting name, enter a name for the setting.
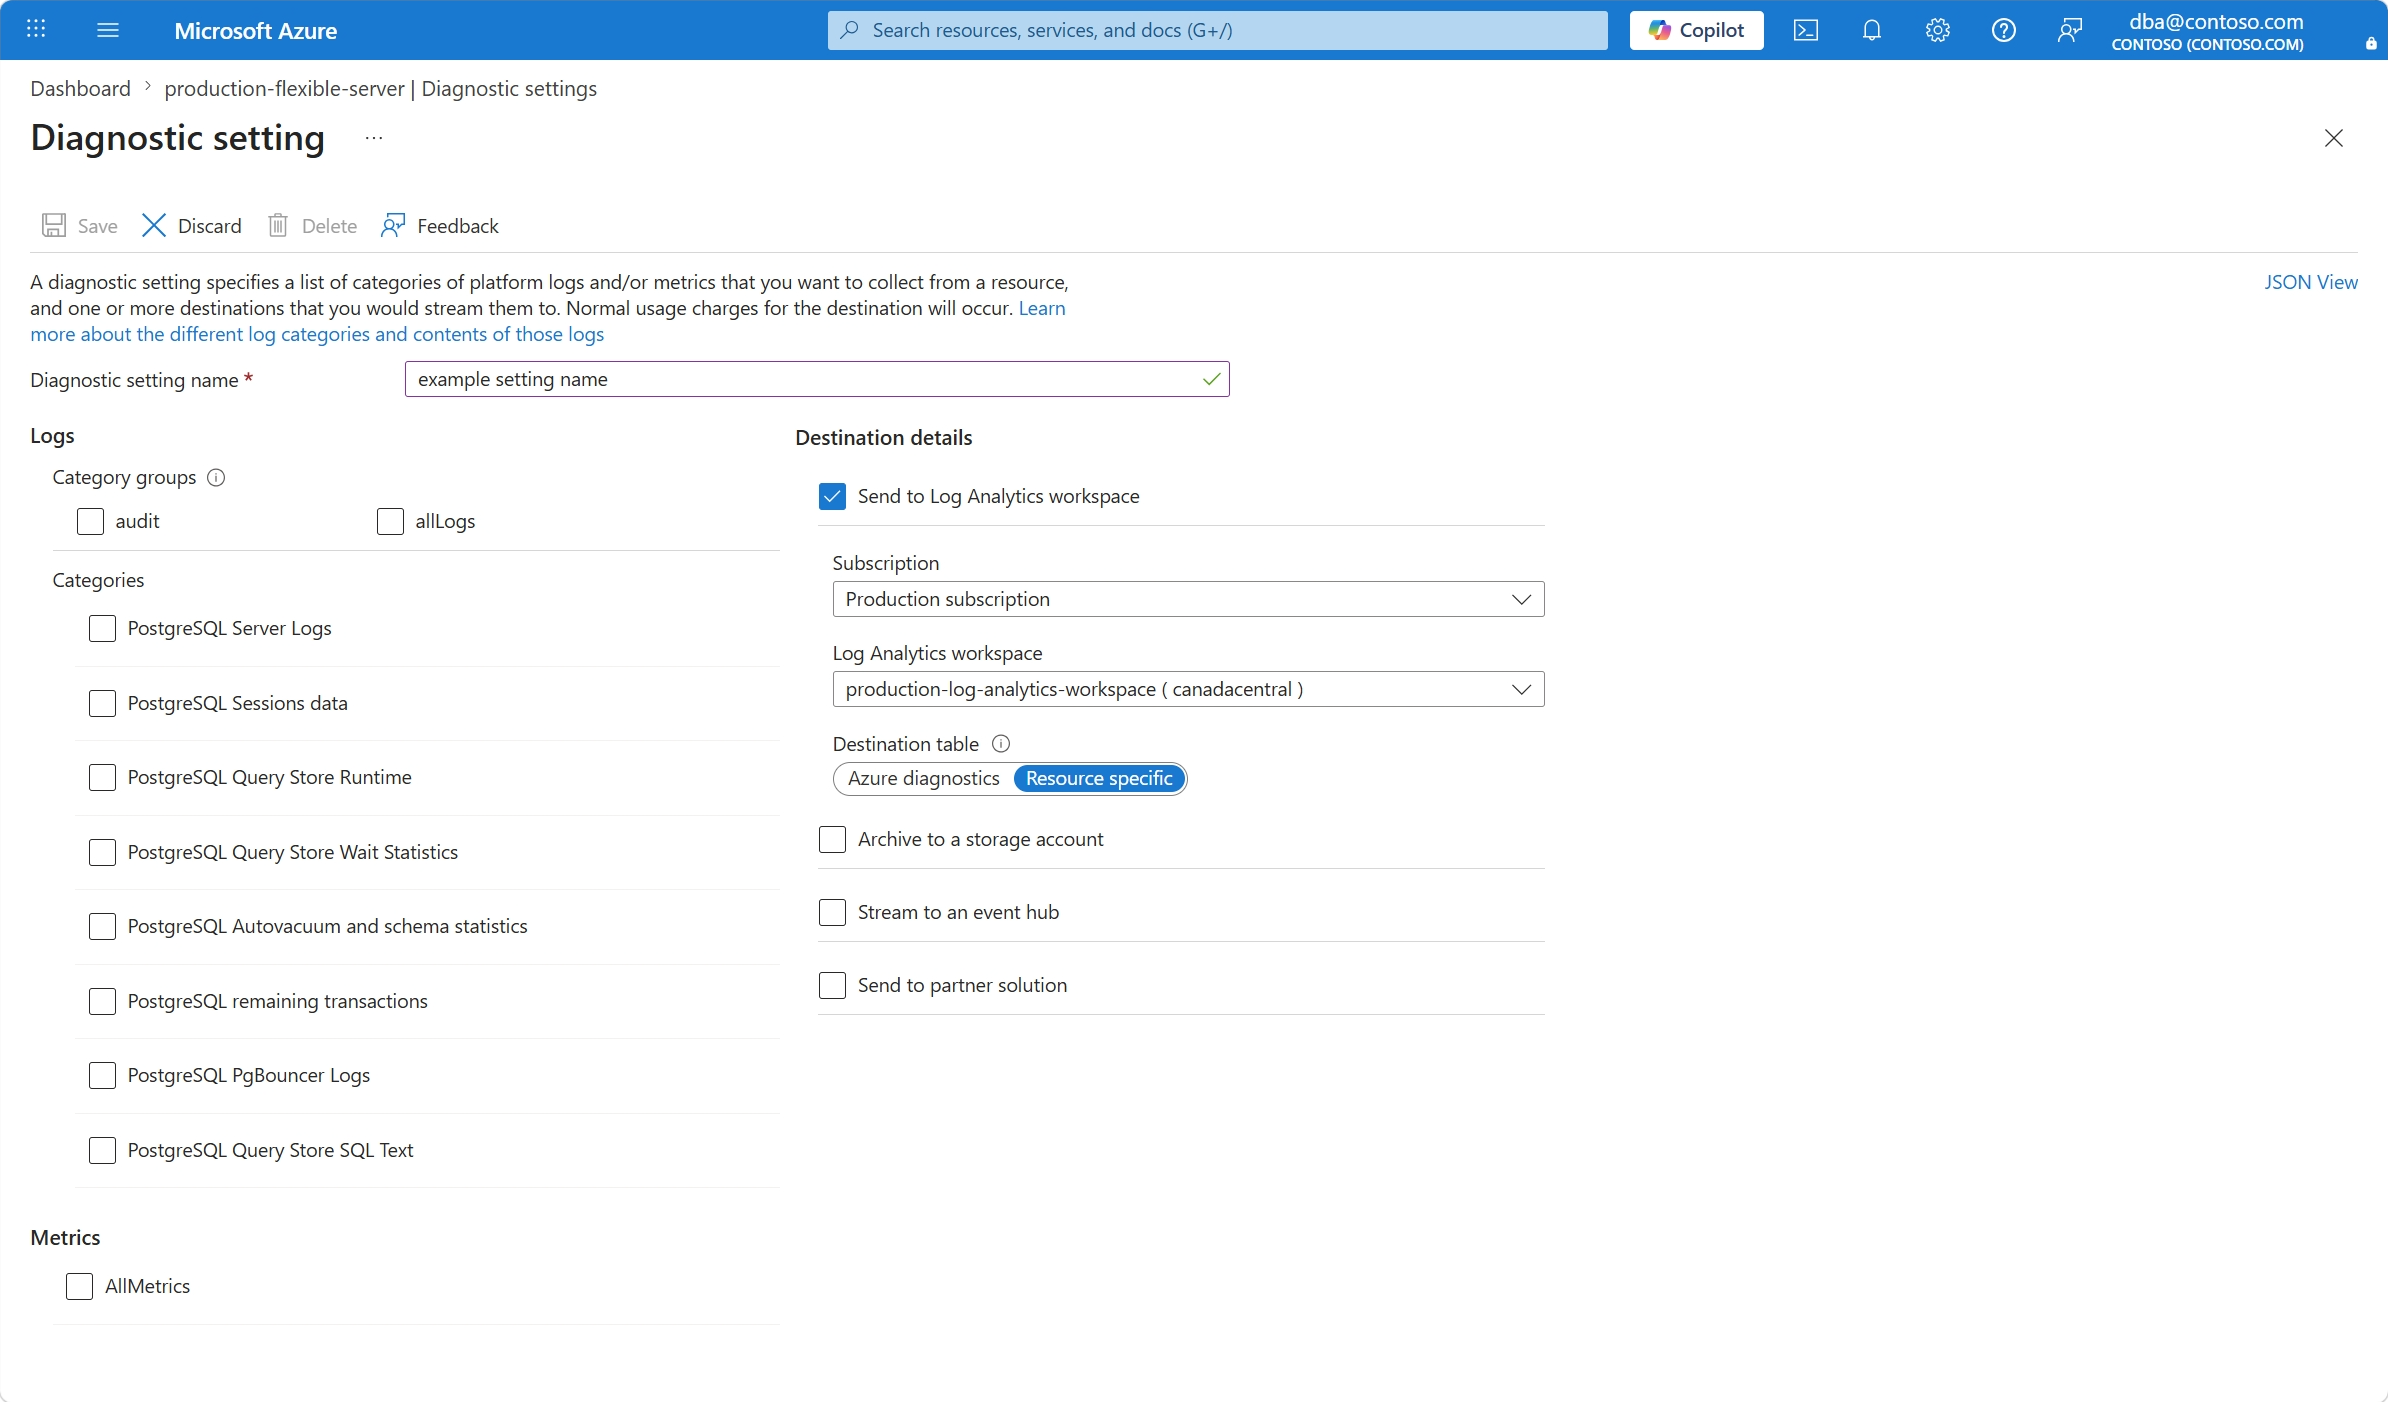
Under Destination details, select Send to Log Analytics workspace. From Subscription, choose the subscription that contains your Log Analytics workspace. On Log Analytics workspace, choose the workspace to which you want to stream logs or metrics. For Destination table, select Resource specific over Azure diagnostics. To learn more about the differences between the two, see Resource logs in Azure Monitor. If you want to send the selected categories to another destination type, instead of or in addition to, select the desired options under Destination details and configure them accordingly.
To stream logs to the selected workspace, select the individual categories (PostgreSQL Server logs, PostgreSQL Sessions data, PostgreSQL Query Store Runtime, PostgreSQL Query Store Wait Statistics, PostgreSQL Autovacuum and schema statistics, PostgreSQL remaining transactions, PostgreSQL PgBouncer Logs, or PostgreSQL Query Store SQL Text), or select any of the two checkboxes from Category groups (audit or allLogs). Selecting either or both category groups is equivalent to selecting all individual categories. To learn more about each individual log category, see Logs. To stream metrics to the selected workspace, under Metrics, select AllMetrics.
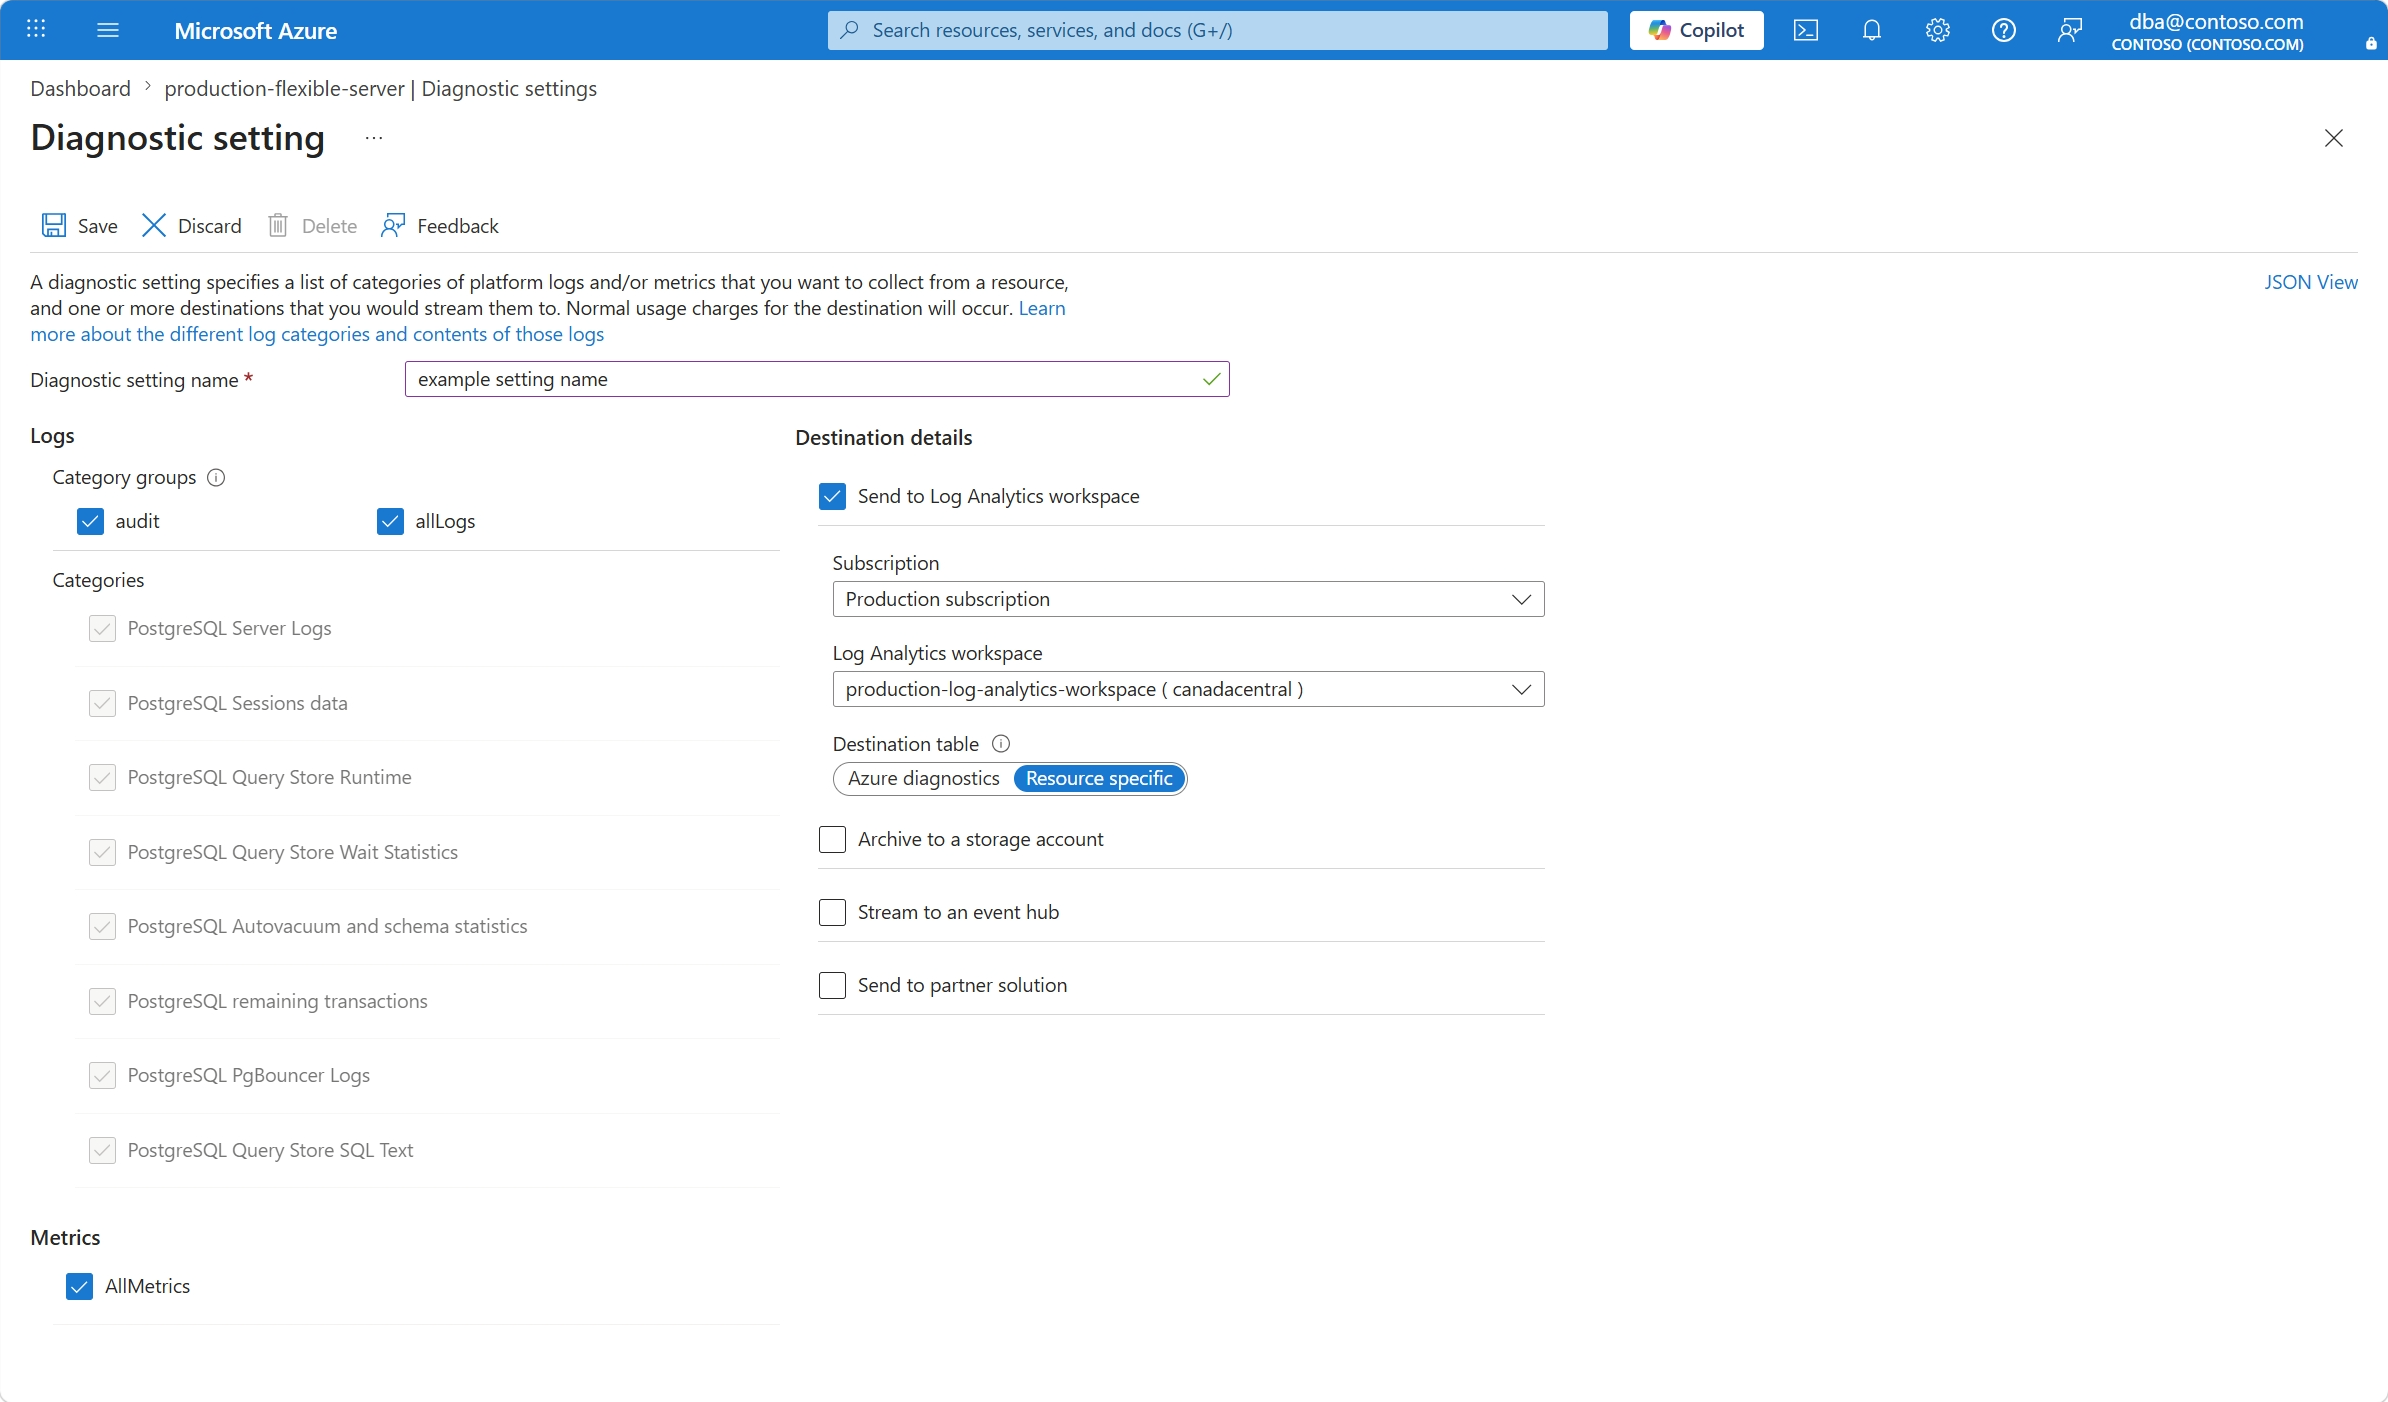
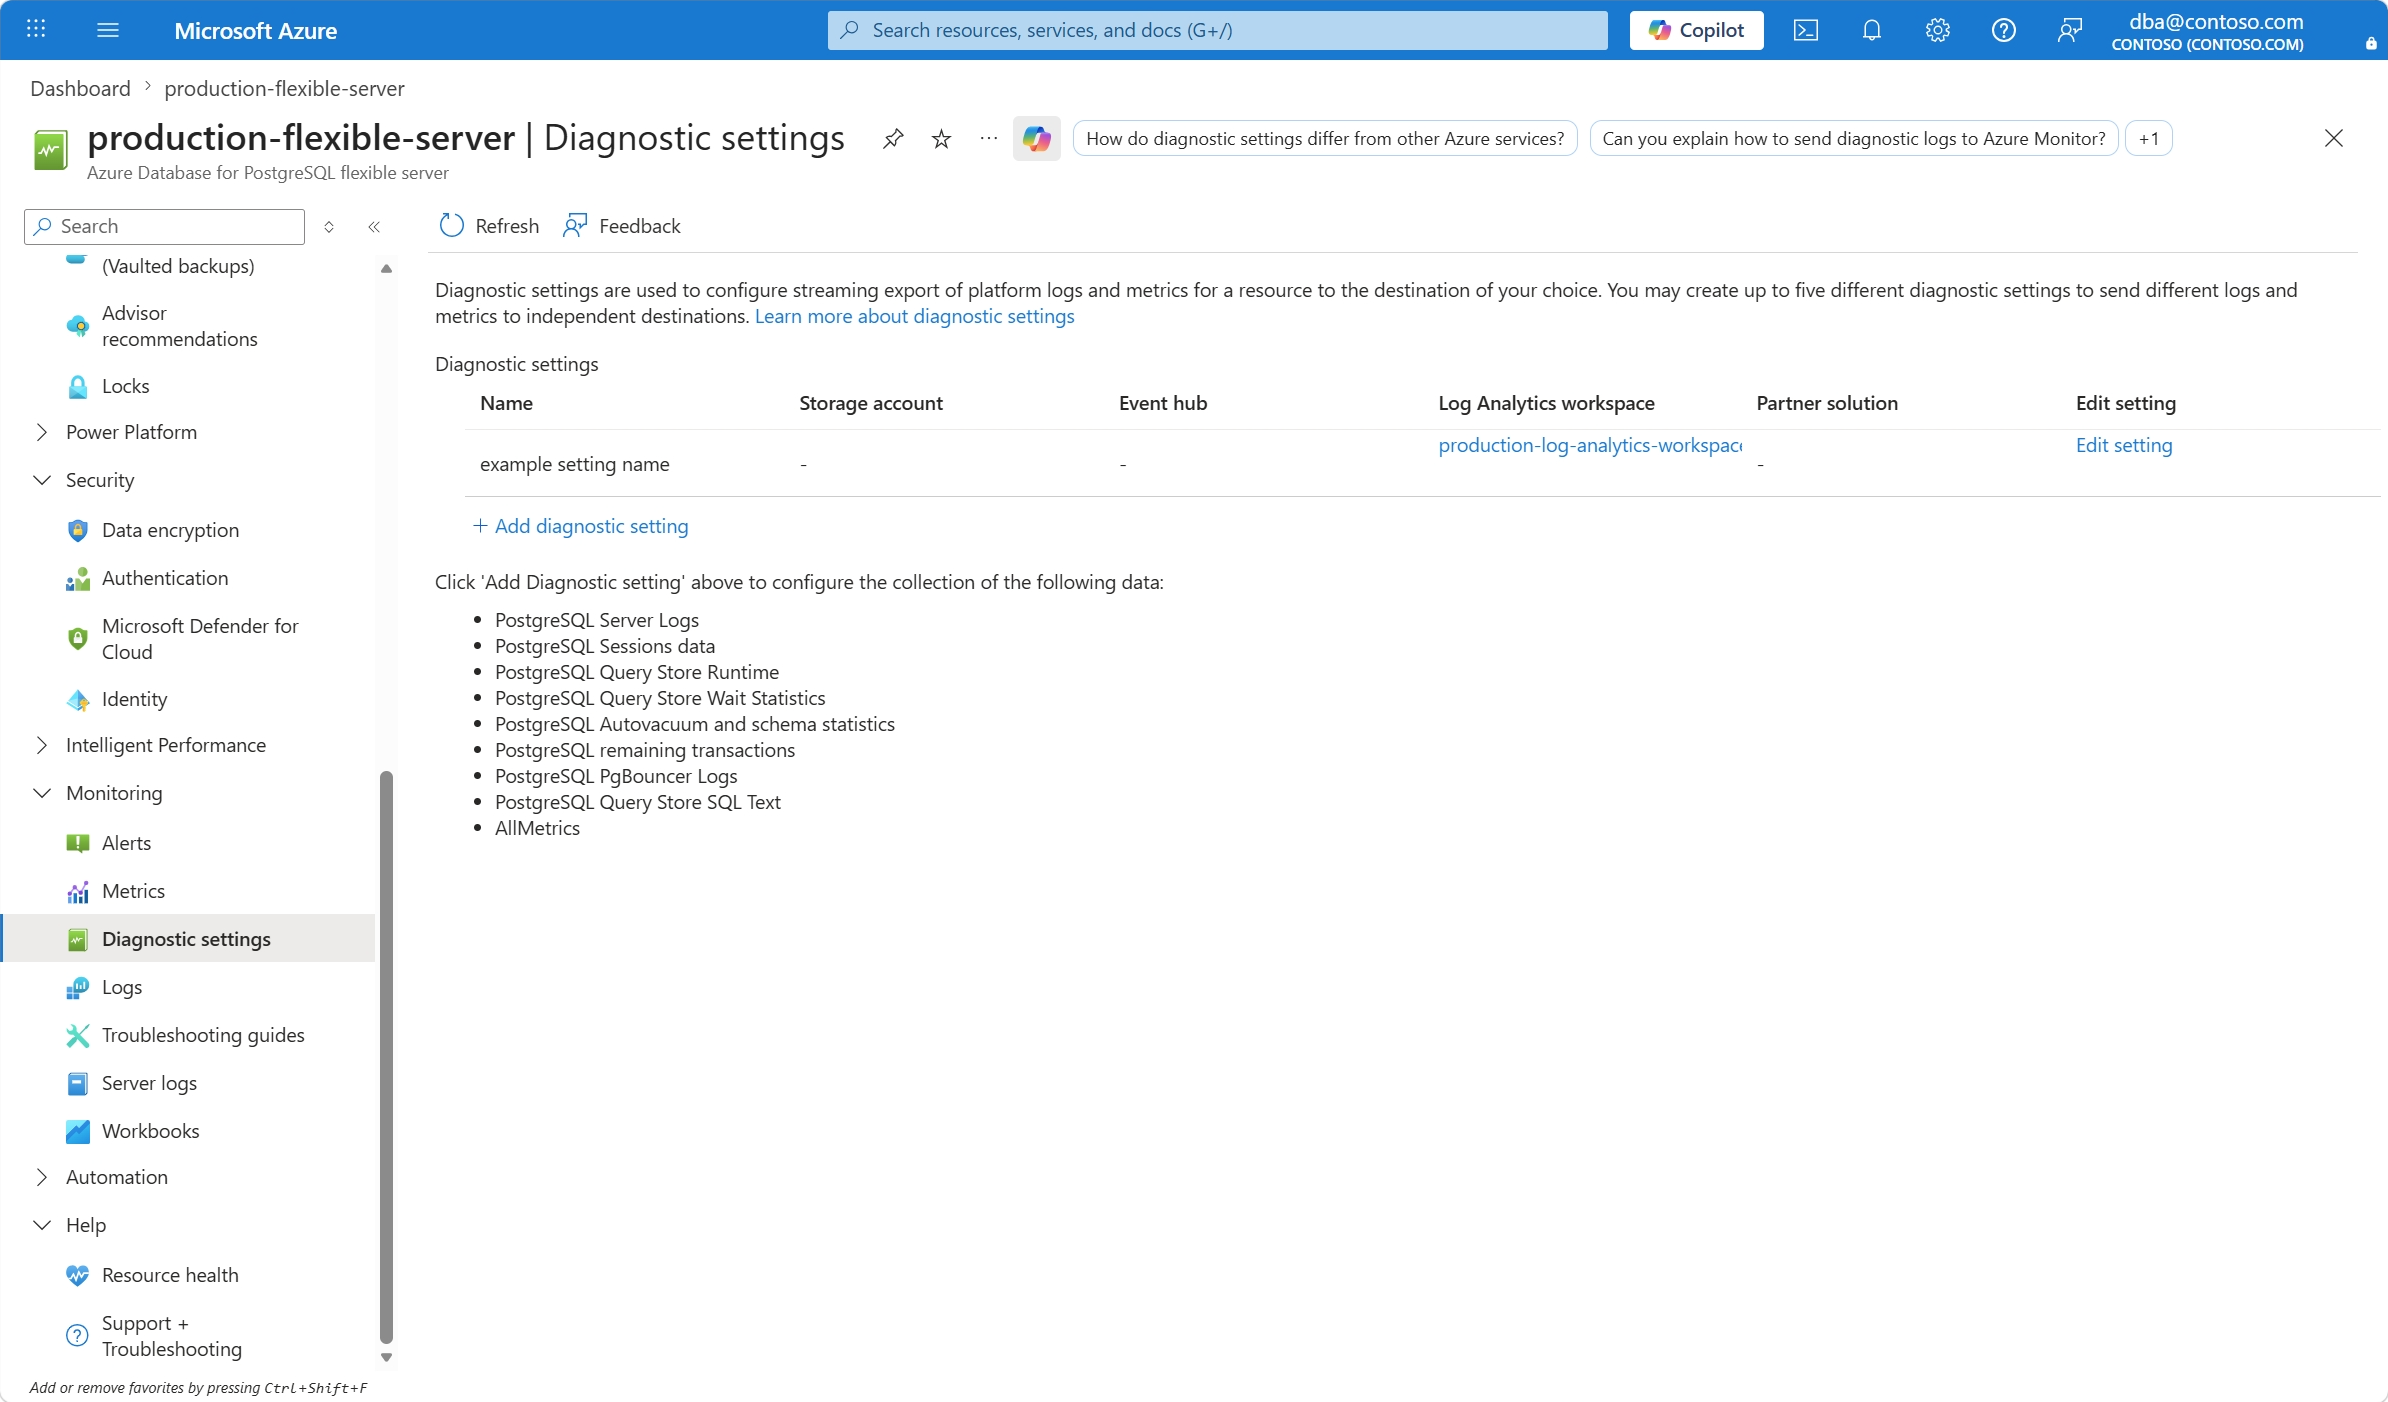
Select Save to apply the changes. After you save the changes, close the page with all configuration details to return to the Diagnostic settings page.
Important
You can't select one category on more than one diagnostic setting for the same flexible server if the destination is the same for both. However, you can select the same category on different diagnostic settings for the same flexible server, as long as the destinations are different.
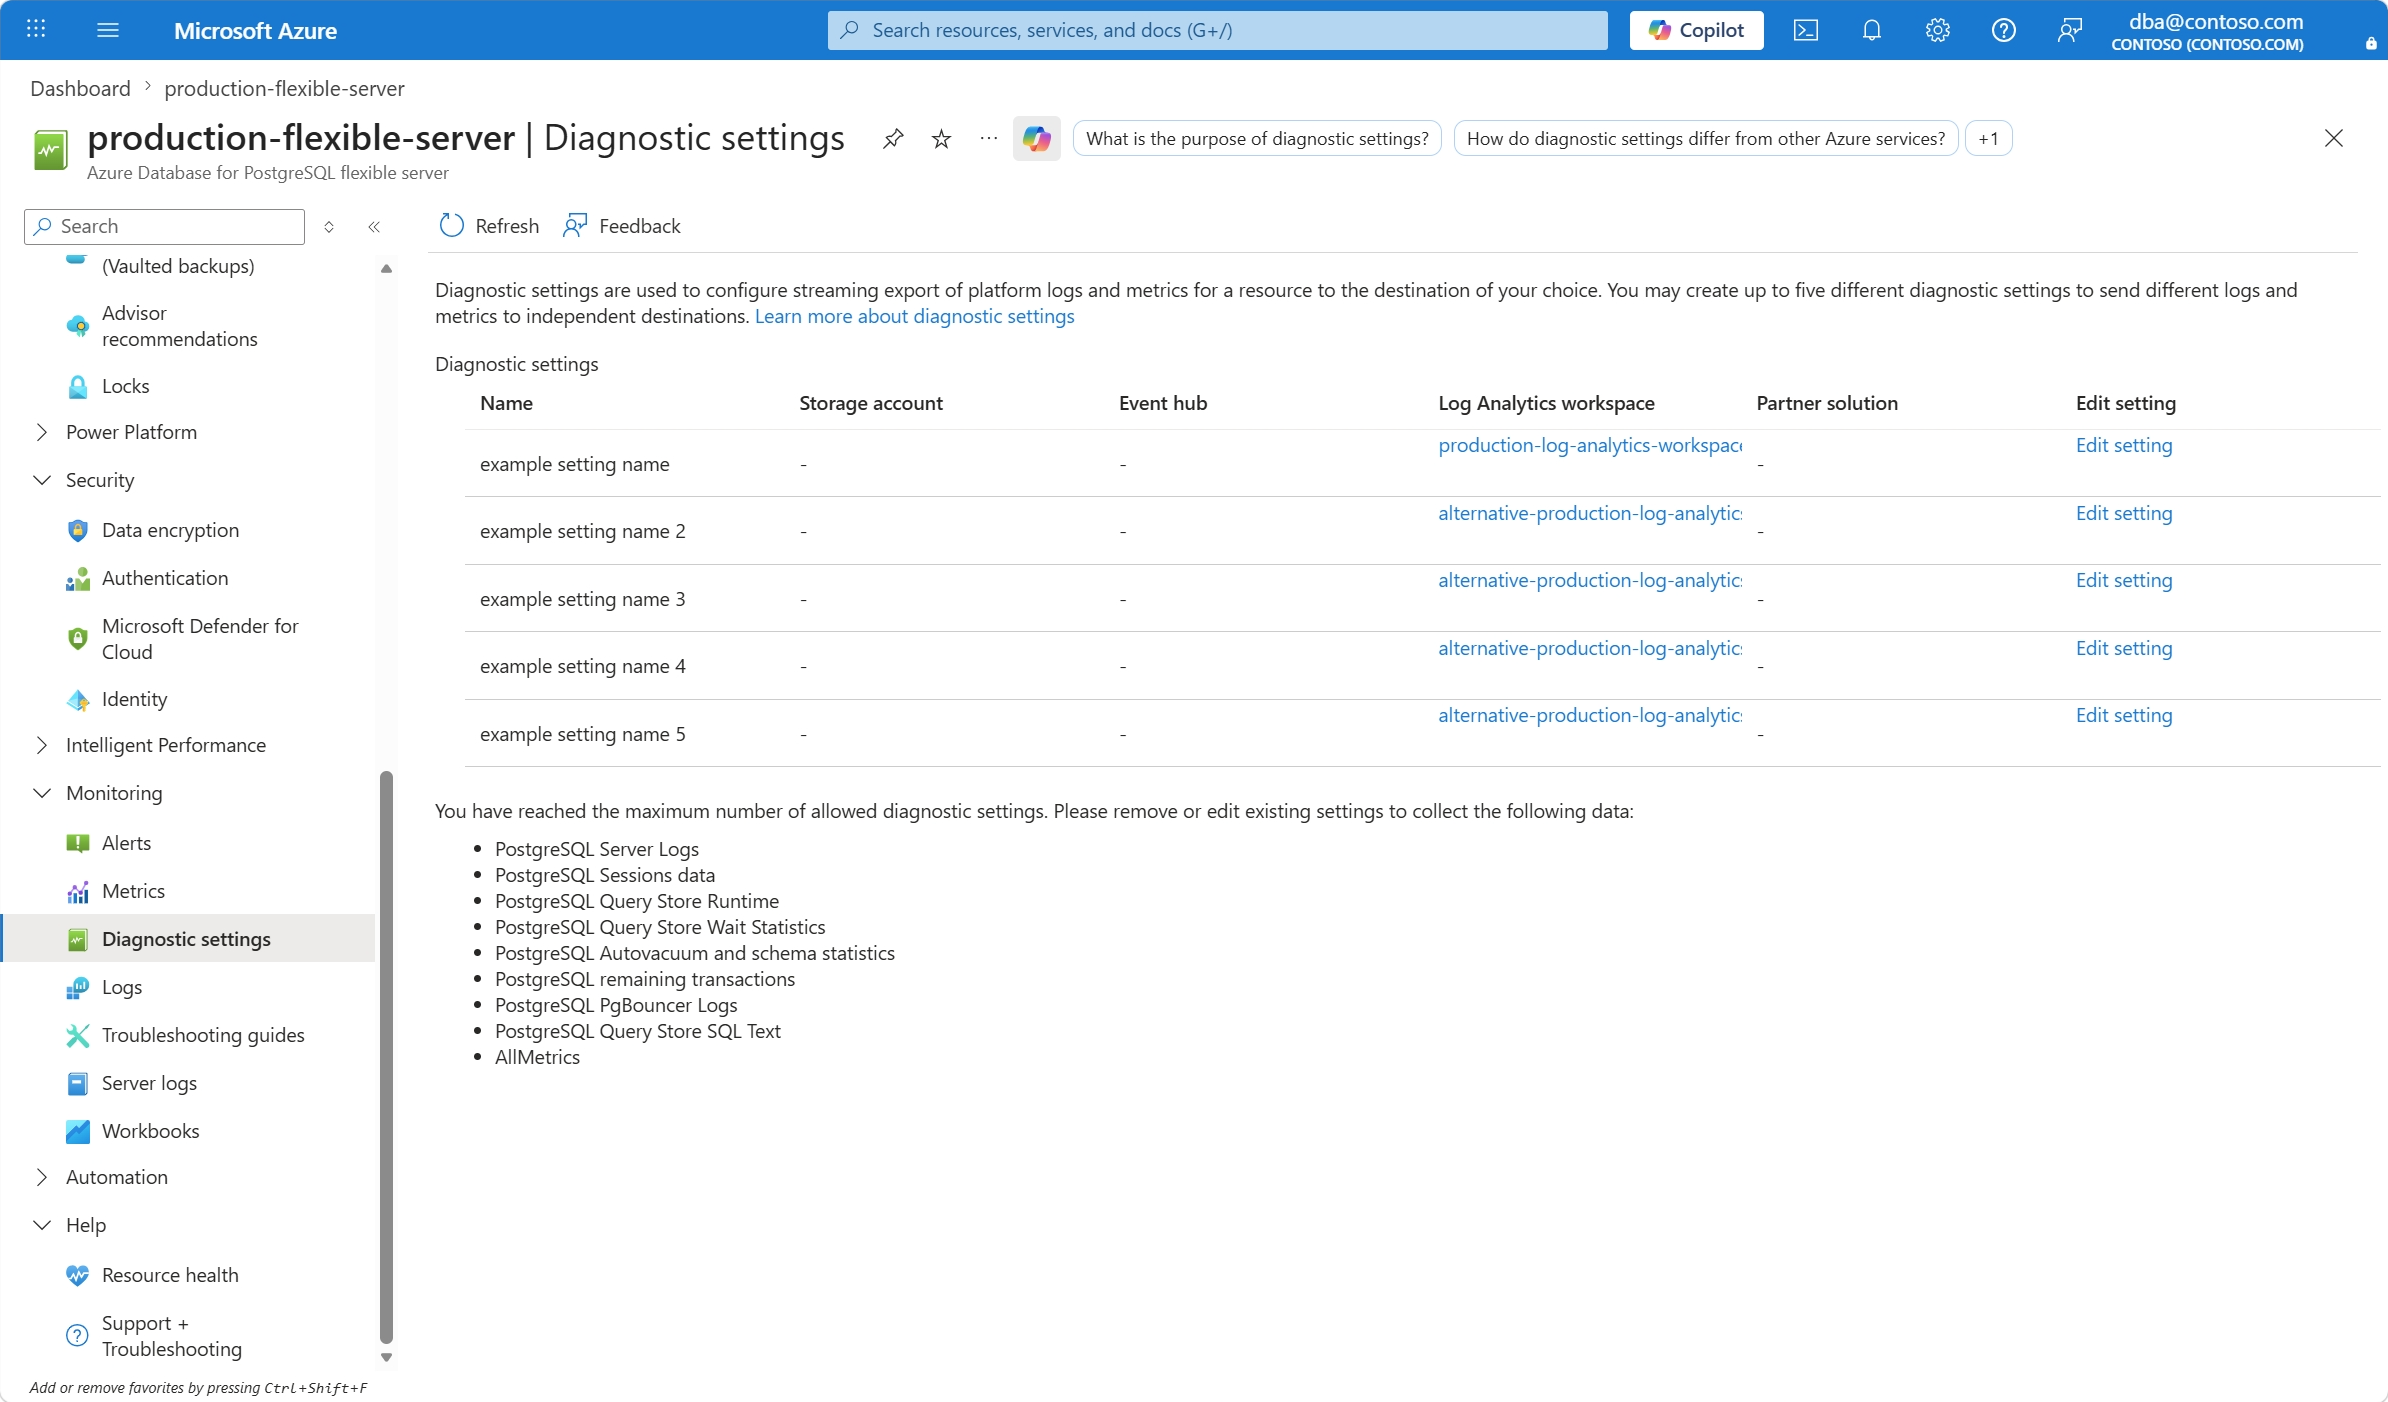
You can create up to five diagnostic settings for any given resource. When you reach that limit, the option to add a diagnostic setting is replaced with a message that indicates you reached the limit.
Access resource logs
How you access the logs depends on which endpoint you choose. For Azure Storage, see the logs storage account article. For Event Hubs, see the stream Azure logs article.
For Log Analytics workspaces, you send logs to the workspace you selected. If you configure the diagnostic setting to use resource specific tables, which is the recommended way, refer to [Azure Database for PostgreSQL resource logs] to see the mapping between category name of the log and its corresponding resource specific table. If, on the other hand, you configure the diagnostic settings to use Azure diagnostics as the destination table, all events from all categories land on the same AzureDiagnostics table.
To learn more about querying and alerting, see the Overview of Log Analytics in Azure Monitor.
The following queries are some examples you can try to get started. You can also configure alerts based on queries.
All events in server log of one server in last day
If the destination of your diagnostic setting from which you're streaming the PostgreSQLLogs category is resource specific tables, use the following query:
PGSQLServerLogs
| where LogicalServerName == "example-flexible-server"
| where TimeGenerated > ago(1d)
If it's Azure diagnostics, use the following query:
AzureDiagnostics
| where LogicalServerName_s == "example-flexible-server"
| where Category == "PostgreSQLLogs"
| where TimeGenerated > ago(1d)
All remote connection attempts in last 6 hours to any server streaming logs to this workspace
If the destination of your diagnostic setting from which you're streaming the PostgreSQLLogs category is resource specific tables, use the following query:
PGSQLServerLogs
| where Message contains "connection received" and Message !contains "host=127.0.0.1"
| where TimeGenerated > ago(6h)
If it's Azure diagnostics, use the following query:
AzureDiagnostics
| where Message contains "connection received" and Message !contains "host=127.0.0.1"
| where Category == "PostgreSQLLogs" and TimeGenerated > ago(6h)
Sessions collected from pg_stat_activity system view for one server in last 30 minutes
If the destination of your diagnostic setting from which you're streaming the PostgreSQLFlexSessions category is resource specific tables, use the following query:
PGSQLPgStatActivitySessions
| where LogicalServerName == "example-flexible-server"
| where TimeGenerated > ago(30m)
If it's Azure diagnostics, use the following query:
AzureDiagnostics
| where LogicalServerName_s == "example-flexible-server"
| where Category =='PostgreSQLFlexSessions'
| where TimeGenerated > ago(30m)
Query store runtime statistics for one server in last 2 days
If the destination of your diagnostic setting from which you're streaming the PostgreSQLFlexQueryStoreRuntime category is resource specific tables, use the following query:
PGSQLQueryStoreRuntime
| where LogicalServerName == "example-flexible-server"
| where TimeGenerated > ago(2d)
If it's Azure diagnostics, use the following query:
AzureDiagnostics
| where LogicalServerName_s == "example-flexible-server"
| where Category =='PostgreSQLFlexQueryStoreRuntime'
| where TimeGenerated > ago(2d)
Query store waits statistics for one server in last 3 days
If the destination of your diagnostic setting from which you're streaming the PostgreSQLFlexQueryStoreWaitStats category is resource specific tables, use the following query:
PGSQLQueryStoreWaits
| where LogicalServerName == "example-flexible-server"
| where TimeGenerated > ago(3d)

If it's Azure diagnostics, use the following query:

```kusto
AzureDiagnostics
| where LogicalServerName_s == "example-flexible-server"
| where Category =='PostgreSQLFlexQueryStoreWaitStats'
| where TimeGenerated > ago(3d)
Query store query text for one server in last 3 days
If the destination of your diagnostic setting from which you're streaming the PostgreSQLQueryStoreSqlText category is resource specific tables, use the following query:
PGSQLQueryStoreQueryText
| where LogicalServerName == "example-flexible-server"
| where TimeGenerated > ago(3d)
Important
For multiple reasons, it's strongly discouraged to use Azure diagnostics destination table for any of the categories available. But it's specially important for the PostgreSQLQueryStoreSqlText category. To learn about the reasons why resource specific tables are far better than Azure diagnostics, refer to collection modes in Log Analytics workspaces.
Autovacuum and schema statistics for one server in last 5 hours
If the destination of your diagnostic setting from which you're streaming the PostgreSQLFlexTableStats category is resource specific tables, use the following query:
PGSQLAutovacuumStats
| where LogicalServerName == "example-flexible-server"
| where TimeGenerated > ago(5h)
If it's Azure diagnostics, use the following query:
AzureDiagnostics
| where LogicalServerName_s == "example-flexible-server"
| where Category =='PostgreSQLFlexTableStats'
| where TimeGenerated > ago(1d)
Remaining transactions until emergency autovacuum or wraparound protection for each database in one server in last day
If the destination of your diagnostic setting from which you're streaming the PostgreSQLFlexDatabaseXacts category is resource specific tables, use the following query:
PGSQLDbTransactionsStats
| where LogicalServerName == "example-flexible-server"
| where TimeGenerated > ago(1d)
If it's Azure diagnostics, use the following query:
AzureDiagnostics
| where LogicalServerName_s == "example-flexible-server"
| where Category =='PostgreSQLFlexDatabaseXacts'
| where TimeGenerated > ago(1d)
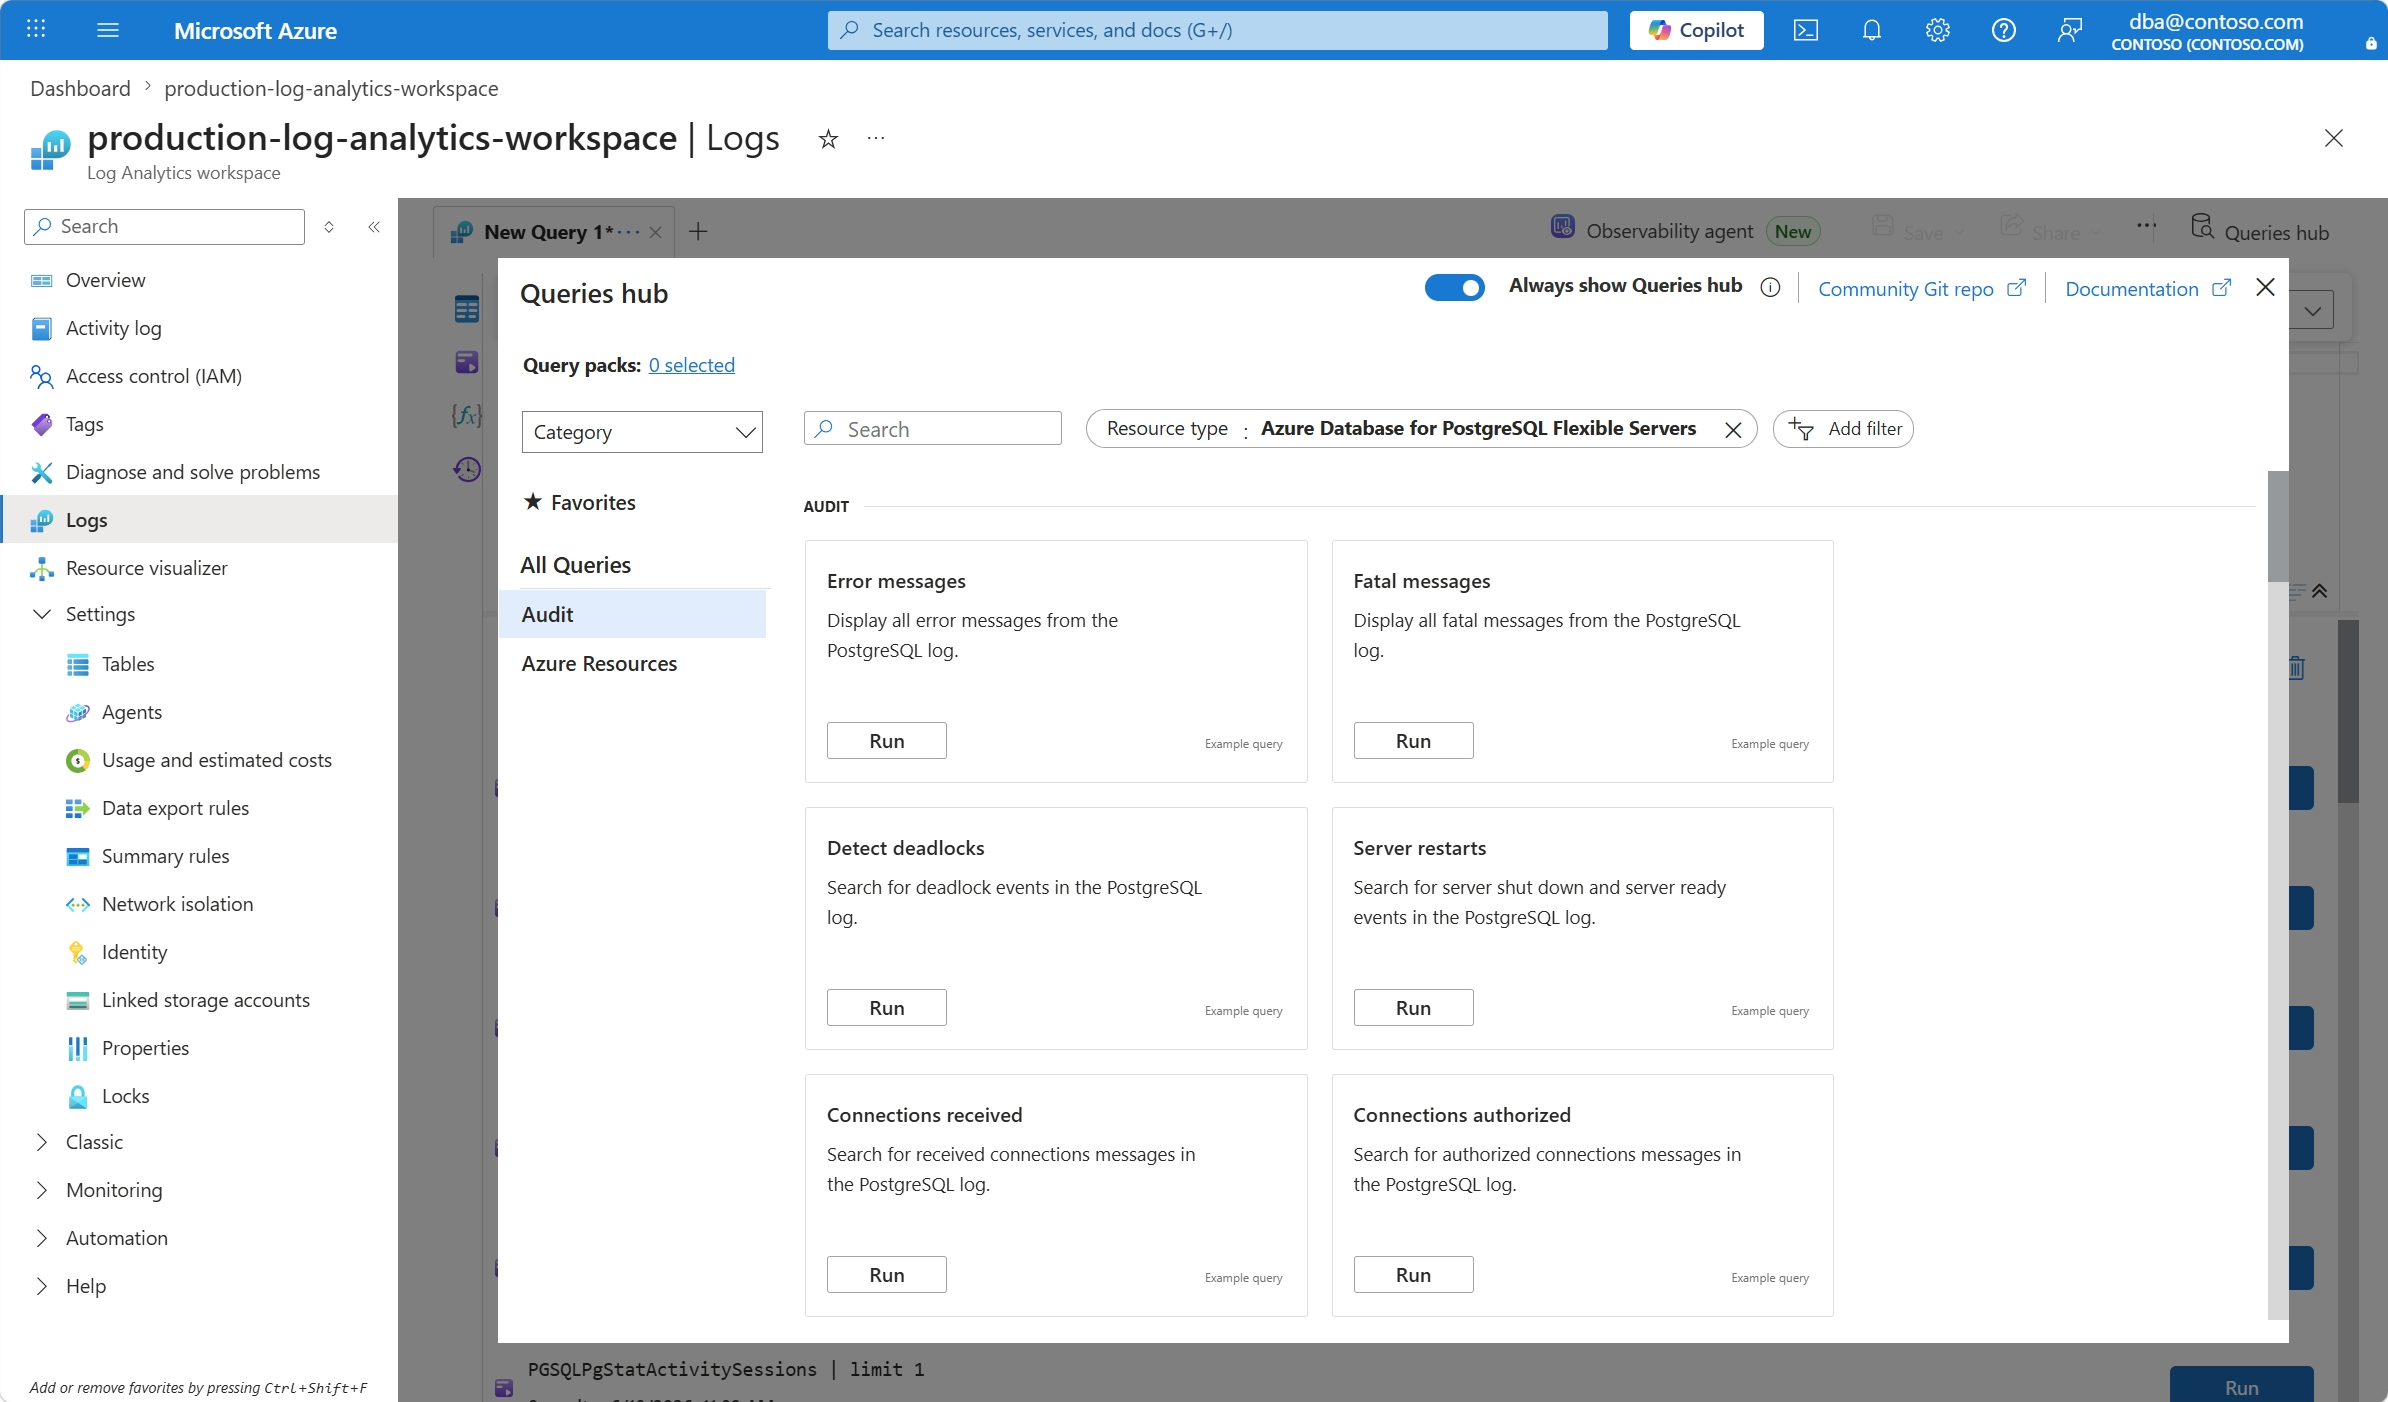
For more advanced query examples, visit the queries hub of your Log Analytics workspace and filter by Resource type equals to Azure Database for PostgreSQL Flexible Servers.