Monitor Azure Service Fabric
This article describes:
- The types of monitoring data you can collect for this service.
- Ways to analyze that data.
Note
If you're already familiar with this service and/or Azure Monitor and just want to know how to analyze monitoring data, see the Analyze section near the end of this article.
When you have critical applications and business processes that rely on Azure resources, you need to monitor and get alerts for your system. The Azure Monitor service collects and aggregates metrics and logs from every component of your system. Azure Monitor provides you with a view of availability, performance, and resilience, and notifies you of issues. You can use the Azure portal, PowerShell, Azure CLI, REST API, or client libraries to set up and view monitoring data.
- For more information on Azure Monitor, see the Azure Monitor overview.
- For more information on how to monitor Azure resources in general, see Monitor Azure resources with Azure Monitor.
Azure Service Fabric monitoring
Azure Service Fabric has the following layers that you can monitor:
- Application monitoring: The applications that run on the nodes. You can monitor applications with Application Insights key or SDK, EventStore, or ASP.NET Core logging.
- Platform (cluster) monitoring: Client metrics, logs, and events for the platform or cluster nodes, including container metrics. The metrics and logs are different for Linux or Windows nodes.
- Infrastructure (performance) monitoring: Service health and performance counters for the service infrastructure.
You can monitor how your applications are used, the actions taken by the Service Fabric platform, your resource utilization with performance counters, and the overall health of your cluster. Azure Monitor logs and Application Insights offer built-in integration with Service Fabric.
- To learn about best practices, see Monitoring and diagnostic best practices for Azure Service Fabric.
- For a tutorial that shows how to view Service Fabric events and health reports, query the EventStore APIs, and monitor performance counters, see Tutorial: Monitor a Service Fabric cluster in Azure.
- To learn how to configure Azure Monitor logs to monitor your Windows containers orchestrated on Service Fabric, see Tutorial: Monitor Windows containers on Service Fabric using Azure Monitor logs.
Service Fabric Explorer
Service Fabric Explorer, a desktop application for Windows, macOS, and Linux, is an open-source tool for inspecting and managing Azure Service Fabric clusters. To enable automation, every action that can be taken through Service Fabric Explorer can also be done through PowerShell or a REST API.
Application monitoring
Application monitoring tracks how features and components of your application are being used. You want to monitor your applications to make sure issues that impact users are caught. The responsibility of application monitoring is on the users developing an application and its services since it is unique to the business logic of your application. Monitoring your applications can be useful in the following scenarios:
- How much traffic is my application experiencing? - Do you need to scale your services to meet user demands or address a potential bottleneck in your application?
- Are my service-to-service calls successful and tracked?
- What actions are taken by the users of my application? - Collecting telemetry can guide future feature development and better diagnostics for application errors
- Is my application throwing unhandled exceptions?
- What is happening within the services running inside my containers?
The great thing about application monitoring is that developers can use whatever tools and framework they'd like since it lives within the context of your application! You can learn more about the Azure solution for application monitoring with Azure Monitor Application Insights in Event analysis with Application Insights.
We also have a tutorial with how to set this up for .NET Applications. This tutorial goes over how to install the right tools, an example to write custom telemetry in your application, and viewing the application diagnostics and telemetry in the Azure portal.
Application logging
Instrumenting your code is not only a way to gain insights about your users, but also the only way you can know whether something is wrong in your application, and to diagnose what needs to be fixed. Although technically it's possible to connect a debugger to a production service, it's not a common practice. So, having detailed instrumentation data is important.
Some products automatically instrument your code. Although these solutions can work well, manual instrumentation is almost always required to be specific to your business logic. In the end, you must have enough information to forensically debug the application. Service Fabric applications can be instrumented with any logging framework. This section describes a few different approaches to instrumenting your code, and when to choose one approach over another.
Application Insights SDK: Application Insights has a rich integration with Service Fabric out of the box. Users can add the AI Service Fabric nuget packages and receive data and logs created and collected viewable in the Azure portal. Additionally, users are encouraged to add their own telemetry in order to diagnose and debug their applications and track which services and parts of their application are used the most. The TelemetryClient class in the SDK provides many ways to track telemetry in your applications. For more information, see Event analysis and visualization with Application Insights.
Check out an example of how to instrument and add application insights to your application in our tutorial for monitoring and diagnosing a .NET application.
EventSource: When you create a Service Fabric solution from a template in Visual Studio, an EventSource-derived class (ServiceEventSource or ActorEventSource) is generated. A template is created, in which you can add events for your application or service. The EventSource name must be unique, and should be renamed from the default template string MyCompany-<solution>-<project>. Having multiple EventSource definitions that use the same name causes an issue at run time. Each defined event must have a unique identifier. If an identifier is not unique, a runtime failure occurs. Some organizations preassign ranges of values for identifiers to avoid conflicts between separate development teams. For more information, see Vance's blog or the MSDN documentation.
ASP.NET Core logging: It's important to carefully plan how you will instrument your code. The right instrumentation plan can help you avoid potentially destabilizing your code base, and then needing to reinstrument the code. To reduce risk, you can choose an instrumentation library like Microsoft.Extensions.Logging, which is part of Microsoft ASP.NET Core. ASP.NET Core has an ILogger interface that you can use with the provider of your choice, while minimizing the effect on existing code. You can use the code in ASP.NET Core on Windows and Linux, and in the full .NET Framework, so your instrumentation code is standardized.
For examples on how to use these suggestions, see Add logging to your Service Fabric application.
Platform (cluster) monitoring
A user is in control over what telemetry comes from their application since a user writes the code itself, but what about the diagnostics from the Service Fabric platform? One of Service Fabric's goals is to keep applications resilient to hardware failures. This goal is achieved through the platform's system services' ability to detect infrastructure issues and rapidly failover workloads to other nodes in the cluster. But in this particular case, what if the system services themselves have issues? Or if in attempting to deploy or move a workload, rules for the placement of services are violated? Service Fabric provides diagnostics for these and more to make sure you are informed about activity taking place in your cluster. Some sample scenarios for cluster monitoring include:
For more information on platform (cluster) monitoring, see Monitoring the cluster.
Service Fabric events
Service Fabric provides a comprehensive set of diagnostics events out of the box, which you can access through the EventStore or the operational event channel the platform exposes. These Service Fabric events illustrate actions done by the platform on different entities such as nodes, applications, services, and partitions. The same events are available on both Windows and Linux clusters.
Service Fabric event channels: On Windows, Service Fabric events are available from a single ETW provider with a set of relevant
logLevelKeywordFiltersused to pick between Operational and Data & Messaging channels. This is the way in which we separate out outgoing Service Fabric events to be filtered on as needed. On Linux, Service Fabric events come through LTTng and are put into one Storage table, from where they can be filtered as needed. These channels contain curated, structured events that can be used to better understand the state of your cluster. Diagnostics are enabled by default at the cluster creation time, which create an Azure Storage table where the events from these channels are sent for you to query in the future.EventStore is a feature that shows Service Fabric platform events in Service Fabric Explorer and programmatically through the Service Fabric Client Library REST API. You can see a snapshot view of what's going on in your cluster for each node, service, and application, and query based on the time of the event. The EventStore APIs are available only for Windows clusters running on Azure. On Windows machines, these events are fed into the Event Log, so you can see Service Fabric Events in Event Viewer.
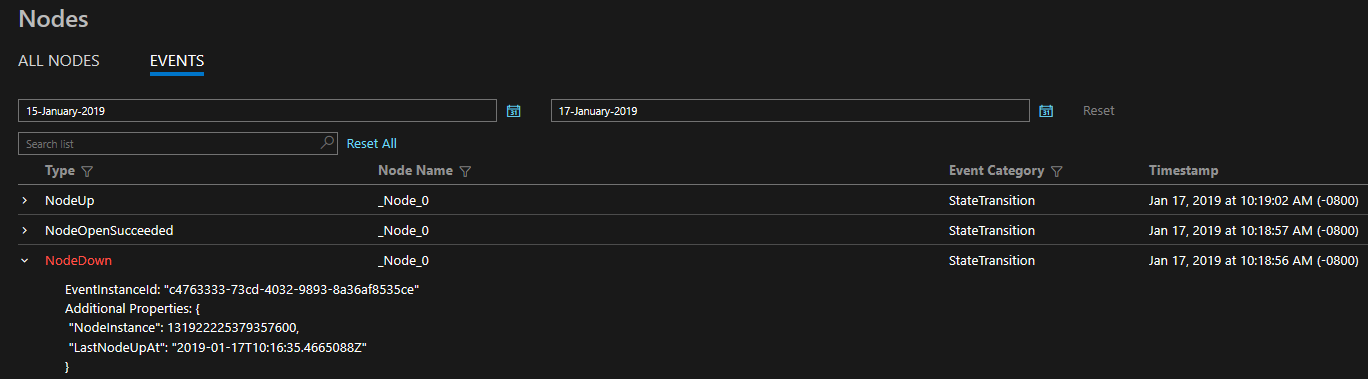
The diagnostics provided are in the form of a comprehensive set of events out of the box. These Service Fabric events illustrate actions done by the platform on different entities such as Nodes, Applications, Services, Partitions etc. In the last scenario above, if a node were to go down, the platform would emit a NodeDown event and you could be notified immediately by your monitoring tool of choice. Other common examples include ApplicationUpgradeRollbackStarted or PartitionReconfigured during a failover. The same events are available on both Windows and Linux clusters.
The events are sent through standard channels on both Windows and Linux and can be read by any monitoring tool that supports these. The Azure Monitor solution is Azure Monitor logs. Feel free to read more about our Azure Monitor logs integration which includes a custom operational dashboard for your cluster and some sample queries from which you can create alerts. More cluster monitoring concepts are available at Platform level event and log generation.
Health monitoring
The Service Fabric platform includes a health model, which provides extensible health reporting for the status of entities in a cluster. Each node, application, service, partition, replica, or instance, has a continuously updatable health status. The health status can either be "OK", "Warning", or "Error". Think of Service Fabric events as verbs done by the cluster to various entities and health as an adjective for each entity. Each time the health of a particular entity transitions, an event will also be emitted. This way you can set up queries and alerts for health events in your monitoring tool of choice, just like any other event.
Additionally, we even let users override health for entities. If your application is going through an upgrade and you have validation tests failing, you can write to Service Fabric Health using the Health API to indicate your application is no longer healthy, and Service Fabric will automatically roll back the upgrade! For more on the health model, check out the introduction to Service Fabric health monitoring
Watchdogs
Generally, a watchdog is a separate service that watches health and load across services, pings endpoints, and reports unexpected health events in the cluster. This can help prevent errors that may not be detected based only on the performance of a single service. Watchdogs are also a good place to host code that performs remedial actions that don't require user interaction, such as cleaning up log files in storage at certain time intervals. If you want a fully implemented, open source SF watchdog service that includes an easy-to-use watchdog extensibility model and that runs in both Windows and Linux clusters, see the FabricObserver project. FabricObserver is production-ready software. We encourage you to deploy FabricObserver to your test and production clusters and extend it to meet your needs either through its plug-in model or by forking it and writing your own built-in observers. The former (plug-ins) is the recommended approach.
Infrastructure (performance) monitoring
Now that we've covered the diagnostics in your application and the platform, how do we know the hardware is functioning as expected? Monitoring your underlying infrastructure is a key part of understanding the state of your cluster and your resource utilization. Measuring system performance depends on many factors that can be subjective depending on your workloads. These factors are typically measured through performance counters. These performance counters can come from a variety of sources including the operating system, the .NET framework, or the Service Fabric platform itself. Some scenarios in which they would be useful are
- Am I utilizing my hardware efficiently? Do you want to use your hardware at 90% CPU or 10% CPU. This comes in handy when scaling your cluster, or optimizing your application's processes.
- Can I predict infrastructure issues proactively? - many issues are preceded by sudden changes (drops) in performance, so you can use performance counters such as network I/O and CPU utilization to predict and diagnose the issues proactively.
A list of performance counters that should be collected at the infrastructure level can be found at Performance metrics.
Azure Monitor Logs is recommended for monitoring cluster level events. After you configure the Log Analytics agent with your workspace, you can collect:
- Performance metrics such as CPU utilization.
- .NET performance counters such as process level CPU utilization.
- Service Fabric performance counters such as number of exceptions from a reliable service.
- Container metrics such as CPU utilization.
Resource types
Azure uses the concept of resource types and IDs to identify everything in a subscription. Azure Monitor similarly organizes core monitoring data into metrics and logs based on resource types, also called namespaces. Different metrics and logs are available for different resource types. Your service might be associated with more than one resource type.
Resource types are also part of the resource IDs for every resource running in Azure. For example, one resource type for a virtual machine is Microsoft.Compute/virtualMachines. For a list of services and their associated resource types, see Resource providers.
For more information about the resource types for Azure Service Fabric, see Service Fabric monitoring data reference.
Data storage
For Azure Monitor:
- Metrics data is stored in the Azure Monitor metrics database.
- Log data is stored in the Azure Monitor logs store. Log Analytics is a tool in the Azure portal that can query this store.
- The Azure activity log is a separate store with its own interface in the Azure portal.
You can optionally route metric and activity log data to the Azure Monitor logs store. You can then use Log Analytics to query the data and correlate it with other log data.
Many services can use diagnostic settings to send metric and log data to other storage locations outside Azure Monitor. Examples include Azure Storage, hosted partner systems, and non-Azure partner systems, by using Event Hubs.
For detailed information on how Azure Monitor stores data, see Azure Monitor data platform.
Azure Monitor platform metrics
Azure Monitor provides platform metrics for many services. For a list of all metrics it's possible to gather for all resources in Azure Monitor, see Supported metrics in Azure Monitor.
This service doesn't gather platform metrics.
Non-Azure Monitor based metrics
This service provides other metrics that aren't included in the Azure Monitor metrics database.
Guest OS metrics
Metrics for the guest operating system (OS) that runs on Service Fabric cluster nodes must be collected through one or more agents that run on the guest OS. Guest OS metrics include performance counters that track guest CPU percentage or memory usage, both of which are frequently used for autoscaling or alerting.
A best practice is to use and configure the Azure Monitor agent to send guest OS performance metrics through the custom metrics API into the Azure Monitor metrics database. You can send the guest OS metrics to Azure Monitor Logs by using the same agent. Then you can query on those metrics and logs by using Log Analytics.
Note
The Azure Monitor agent replaces the Azure Diagnostics extension and Log Analytics agent for guest OS routing. For more information, see Overview of Azure Monitor agents.
Azure Monitor resource logs
Resource logs provide insight into operations that were done by an Azure resource. Logs are generated automatically, but you must route them to Azure Monitor Logs to save or query them. Logs are organized into categories. A given namespace can have multiple resource log categories you can collect.
This service doesn't collect resource logs, but you can find information about them in Monitoring data from Azure resources.
Service Fabric logs and events
Service Fabric can collect the following logs:
- For Windows clusters, you can set up cluster monitoring with Diagnostics Agent and Azure Monitor logs.
- For Linux clusters, Azure Monitor Logs is also the recommended tool for Azure platform and infrastructure monitoring. Linux platform diagnostics require different configuration. For more information, see Service Fabric Linux cluster events in Syslog.
- You can configure the Azure Monitor agent to send guest OS logs to Azure Monitor Logs, where you can query on them by using Log Analytics.
- You can write Service Fabric container logs to stdout or stderr so they're available in Azure Monitor Logs.
- You can set up the container monitoring solution for Azure Monitor Logs to view container events.
Other logging solutions
Although the two solutions we recommended, Azure Monitor logs and Application Insights, have built in integration with Service Fabric, many events are written out through ETW providers and are extensible with other logging solutions. You should also look into the Elastic Stack (especially if you are considering running a cluster in an offline environment), Dynatrace, or any other platform of your preference. For a list of integrated partners, see Azure Service Fabric Monitoring Partners.
The key points for any platform you choose should include how comfortable you are with the user interface, the querying capabilities, the custom visualizations and dashboards available, and the additional tools they provide to enhance your monitoring experience.
Azure activity log
The activity log contains subscription-level events that track operations for each Azure resource as seen from outside that resource; for example, creating a new resource or starting a virtual machine.
Collection: Activity log events are automatically generated and collected in a separate store for viewing in the Azure portal.
Routing: You can send activity log data to Azure Monitor Logs so you can analyze it alongside other log data. Other locations such as Azure Storage, Azure Event Hubs, and certain Microsoft monitoring partners are also available. For more information on how to route the activity log, see Overview of the Azure activity log.
Analyze monitoring data
There are many tools for analyzing monitoring data.
Azure Monitor tools
Azure Monitor supports the following basic tools:
Metrics explorer, a tool in the Azure portal that allows you to view and analyze metrics for Azure resources. For more information, see Analyze metrics with Azure Monitor metrics explorer.
Log Analytics, a tool in the Azure portal that allows you to query and analyze log data by using the Kusto query language (KQL). For more information, see Get started with log queries in Azure Monitor.
The activity log, which has a user interface in the Azure portal for viewing and basic searches. To do more in-depth analysis, you have to route the data to Azure Monitor logs and run more complex queries in Log Analytics.
Tools that allow more complex visualization include:
- Dashboards that let you combine different kinds of data into a single pane in the Azure portal.
- Workbooks, customizable reports that you can create in the Azure portal. Workbooks can include text, metrics, and log queries.
- Grafana, an open platform tool that excels in operational dashboards. You can use Grafana to create dashboards that include data from multiple sources other than Azure Monitor.
- Power BI, a business analytics service that provides interactive visualizations across various data sources. You can configure Power BI to automatically import log data from Azure Monitor to take advantage of these visualizations.
For an overview of common Service Fabric monitoring analytics scenarios, see Diagnose common scenarios with Service Fabric.
Azure Monitor export tools
You can get data out of Azure Monitor into other tools by using the following methods:
Metrics: Use the REST API for metrics to extract metric data from the Azure Monitor metrics database. The API supports filter expressions to refine the data retrieved. For more information, see Azure Monitor REST API reference.
Logs: Use the REST API or the associated client libraries.
Another option is the workspace data export.
To get started with the REST API for Azure Monitor, see Azure monitoring REST API walkthrough.
Kusto queries
You can analyze monitoring data in the Azure Monitor Logs / Log Analytics store by using the Kusto query language (KQL).
Important
When you select Logs from the service's menu in the portal, Log Analytics opens with the query scope set to the current service. This scope means that log queries will only include data from that type of resource. If you want to run a query that includes data from other Azure services, select Logs from the Azure Monitor menu. See Log query scope and time range in Azure Monitor Log Analytics for details.
For a list of common queries for any service, see the Log Analytics queries interface.
Sample queries
The following queries return Service Fabric Events, including actions on nodes. For other useful queries, see Service Fabric Events.
Return operational events recorded in the last hour:
ServiceFabricOperationalEvent
| where TimeGenerated > ago(1h)
| join kind=leftouter ServiceFabricEvent on EventId
| project EventId, EventName, TaskName, Computer, ApplicationName, EventMessage, TimeGenerated
| sort by TimeGenerated
Return Health Reports with HealthState == 3 (Error), and extract more properties from the EventMessage field:
ServiceFabricOperationalEvent
| join kind=leftouter ServiceFabricEvent on EventId
| extend HealthStateId = extract(@"HealthState=(\S+) ", 1, EventMessage, typeof(int))
| where TaskName == 'HM' and HealthStateId == 3
| extend SourceId = extract(@"SourceId=(\S+) ", 1, EventMessage, typeof(string)),
         Property = extract(@"Property=(\S+) ", 1, EventMessage, typeof(string)),
         HealthState = case(HealthStateId == 0, 'Invalid', HealthStateId == 1, 'Ok', HealthStateId == 2, 'Warning', HealthStateId == 3, 'Error', 'Unknown'),
         TTL = extract(@"TTL=(\S+) ", 1, EventMessage, typeof(string)),
         SequenceNumber = extract(@"SequenceNumber=(\S+) ", 1, EventMessage, typeof(string)),
         Description = extract(@"Description='([\S\s, ^']+)' ", 1, EventMessage, typeof(string)),
         RemoveWhenExpired = extract(@"RemoveWhenExpired=(\S+) ", 1, EventMessage, typeof(bool)),
         SourceUTCTimestamp = extract(@"SourceUTCTimestamp=(\S+)", 1, EventMessage, typeof(datetime)),
         ApplicationName = extract(@"ApplicationName=(\S+) ", 1, EventMessage, typeof(string)),
         ServiceManifest = extract(@"ServiceManifest=(\S+) ", 1, EventMessage, typeof(string)),
         InstanceId = extract(@"InstanceId=(\S+) ", 1, EventMessage, typeof(string)),
         ServicePackageActivationId = extract(@"ServicePackageActivationId=(\S+) ", 1, EventMessage, typeof(string)),
         NodeName = extract(@"NodeName=(\S+) ", 1, EventMessage, typeof(string)),
         Partition = extract(@"Partition=(\S+) ", 1, EventMessage, typeof(string)),
         StatelessInstance = extract(@"StatelessInstance=(\S+) ", 1, EventMessage, typeof(string)),
         StatefulReplica = extract(@"StatefulReplica=(\S+) ", 1, EventMessage, typeof(string))
Get Service Fabric operational events aggregated with the specific service and node:
ServiceFabricOperationalEvent
| where ApplicationName  != "" and ServiceName != ""
| summarize AggregatedValue = count() by ApplicationName, ServiceName, Computer
Alerts
Azure Monitor alerts proactively notify you when specific conditions are found in your monitoring data. Alerts allow you to identify and address issues in your system before your customers notice them. For more information, see Azure Monitor alerts.
There are many sources of common alerts for Azure resources. For examples of common alerts for Azure resources, see Sample log alert queries. The Azure Monitor Baseline Alerts (AMBA) site provides a semi-automated method of implementing important platform metric alerts, dashboards, and guidelines. The site applies to a continually expanding subset of Azure services, including all services that are part of the Azure Landing Zone (ALZ).
The common alert schema standardizes the consumption of Azure Monitor alert notifications. For more information, see Common alert schema.
Types of alerts
You can alert on any metric or log data source in the Azure Monitor data platform. There are many different types of alerts depending on the services you're monitoring and the monitoring data you're collecting. Different types of alerts have various benefits and drawbacks. For more information, see Choose the right monitoring alert type.
The following list describes the types of Azure Monitor alerts you can create:
- Metric alerts evaluate resource metrics at regular intervals. Metrics can be platform metrics, custom metrics, logs from Azure Monitor converted to metrics, or Application Insights metrics. Metric alerts can also apply multiple conditions and dynamic thresholds.
- Log alerts allow users to use a Log Analytics query to evaluate resource logs at a predefined frequency.
- Activity log alerts trigger when a new activity log event occurs that matches defined conditions. Resource Health alerts and Service Health alerts are activity log alerts that report on your service and resource health.
Some Azure services also support smart detection alerts, Prometheus alerts, or recommended alert rules.
For some services, you can monitor at scale by applying the same metric alert rule to multiple resources of the same type that exist in the same Azure region. Individual notifications are sent for each monitored resource. For supported Azure services and clouds, see Monitor multiple resources with one alert rule.
Service Fabric alert rules
The following table lists some alert rules for Service Fabric. These alerts are just examples. You can set alerts for any metric, log entry, or activity log entry listed in the Service Fabric monitoring data reference or the List of Service Fabric events.
| Alert type | Condition | Description |
|---|---|---|
| Node event | Node goes down | ServiceFabricOperationalEvent where EventID >= 25622 and EventID <= 25626. These Event IDs are found in the Node events reference. |
| Application event | Application upgrade rollback | ServiceFabricOperationalEvent where EventID == 29623 or EventID == 29624. These Event IDs are found in the Application events reference. |
| Resource health | Upgrade service unreachable/unavailable | Cluster goes to UpgradeServiceUnreachable state. |
Advisor recommendations
For some services, if critical conditions or imminent changes occur during resource operations, an alert displays on the service Overview page in the portal. You can find more information and recommended fixes for the alert in Advisor recommendations under Monitoring in the left menu. During normal operations, no advisor recommendations display.
For more information on Azure Advisor, see Azure Advisor overview.
Recommended setup
Now that we've gone over each area of monitoring and example scenarios, here is a summary of the Azure monitoring tools and set up needed to monitor all areas above.
- Application monitoring with Application Insights
- Cluster monitoring with Diagnostics Agent and Azure Monitor logs
- Infrastructure monitoring with Azure Monitor logs
You can also use and modify the sample ARM template to automate deployment of all necessary resources and agents.
Related content
- See Service Fabric monitoring data reference for a reference of the metrics, logs, and other important values created for Service Fabric.
- See Monitoring Azure resources with Azure Monitor for general details on monitoring Azure resources.
- See the List of Service Fabric events.
Feedback
Coming soon: Throughout 2024 we will be phasing out GitHub Issues as the feedback mechanism for content and replacing it with a new feedback system. For more information see: https://aka.ms/ContentUserFeedback.
Submit and view feedback for