Note
Access to this page requires authorization. You can try signing in or changing directories.
Access to this page requires authorization. You can try changing directories.
This article is the fourth in a series about disaster recovery (DR) for an Azure data platform. It provides recommendations and lessons learned for implementing a DR strategy, including guidance about how to define recovery objectives, test DR procedures, and address operational considerations.
Lessons learned
Ensure that all the parties involved understand the difference between high availability (HA) and DR. Confusing these concepts can result in mismatched solutions.
Work with business stakeholders to define recovery point objectives (RPOs) and recovery time objectives (RTOs) based on the following factors:
The amount of downtime that they can tolerate. Faster recovery usually costs more.
The types of incidents that stakeholders need protection against and how likely they are to occur. For example, a server failure is more likely than a natural disaster that affects all datacenters in a region.
The effects of system unavailability on their business.
The operational expenses (OPEX) budget for the long-term solution.
Consider which degraded service options your users can accept, such as:
Access to visualization dashboards, even if the data isn't up to date. In this scenario, users can view their data even if ingestion pipelines fail.
Read access without write capabilities.
Your target RTO and RPO determine which DR strategy to use. Common strategies include active-active, active-passive, and redeploy on disaster. Also consider your composite service-level objective (SLO) to account for all tolerable downtime thresholds.
Ensure that you understand all the components that might affect the availability of your systems:
Identity management
Networking topology
Secret management and key management
Data sources
Automation and job scheduling
Source repository and deployment pipelines like GitHub and Azure DevOps
Early detection of outages can decrease RTO and RPO values. Apply the following practices:
Define what an outage is and how it maps to the definition of an outage according to Microsoft.
Implement a monitoring and alerting system with clear ownership so that your team reviews metrics and alerts promptly.
For subscription design, extra infrastructure for DR can reside in the original subscription. Platform as a service (PaaS) offerings like Azure Data Lake Storage typically include native failover features. These capabilities support secondary instances in other regions while remaining within the original subscription. To optimize costs, you can allocate a dedicated resource group exclusively for DR-related resources.
Subscription limits might introduce constraints in this approach.
This approach also adds design complexity and requires governance controls to prevent teams from using DR resource groups for routine workflows.
Design the DR workflow based on the criticality and dependencies of a solution. For example, don't try to rebuild an Azure Analysis Services instance before your data warehouse is operational because it triggers an error. Leave development labs for later in the process and recover core enterprise solutions first.
Run recovery tasks in parallel across solutions to reduce total RTO.
If your solution uses Fabric pipelines, include on-premises data gateways in the scope. Use Azure Site Recovery for these machines.
Automate recovery operations where possible to reduce human error, especially for high-pressure situations.
Adopt resource provisioning through Bicep, Azure Resource Manager templates (ARM templates), Terraform, or PowerShell scripts.
Adopt versioning of source code and resource configuration.
Use continuous integration and continuous delivery (CI/CD) release pipelines instead of running steps manually.
Plan for failback and failover. Document the procedures to return operations to the primary instances after they recover.
Define clear indicators and metrics to validate that failover succeeds and that your solutions are operational. Confirm that performance returns to normal, also known as primary functional.
Decide whether your service-level agreements (SLAs) must remain unchanged after failover or whether a temporary reduction in service quality is acceptable. The answer depends on workload criticality. For example, a room-booking system has different downtime tolerance from a core financial or operational system.
Define RTOs and RPOs at the user-scenario level rather than the infrastructure level. Scenario-based targets make it easier to identify which processes and components to prioritize during recovery.
Perform capacity checks in the target region before you proceed with a failover. In a major disaster, many customers might attempt to fail over to the same paired region simultaneously. This scenario can result in delays or contention in resource provisioning. If these risks are unacceptable, consider either an active-active or active-passive DR strategy.
Create and maintain a DR plan to document the recovery process and the action owners. Assign a backup contact for each role to account for unavailable team members.
Perform regular DR drills to validate the DR plan workflow, ensure that it meets the required RTO and RPO requirements, and train the responsible teams. Regularly test data and configuration backups to confirm that they can support recovery when needed.
Collaborate early with networking, identity, and resource provisioning teams to agree on:
Traffic redirection to the secondary site. Consider tools such as Domain Name System (DNS) redirection or Azure Traffic Manager.
How to grant access to the secondary site quickly and securely.
During a disaster, communicate clearly with all involved parties to run the plan efficiently. Inform the following groups throughout recovery:
- Decision-makers
- Incident response teams
- Affected internal users and teams
- External teams
Coordinate resource recovery in the right sequence to maximize efficiency.
Antipatterns
Copy and paste this article series
This article series provides guidance for customers who want a deeper understanding of an Azure-specific DR process. It draws on generic Microsoft intellectual property and reference architectures rather than any single customer-specific Azure implementation.
This content provides a strong foundational understanding. But you must tailor your approach by considering your unique context, implementation, and requirements to develop a fit-for-purpose DR strategy and process.
Treat DR as a tech-only process
DR planning tends to focus on technical tasks, but restoring systems without meeting business requirements still fails. Business stakeholders define DR requirements and validate that service recovery meets business needs.
Engage business stakeholders throughout all DR activities to produce a process that works when needed and delivers real business value.
Create static DR plans
Azure is constantly evolving, and so are the ways that customers use its services. Your DR process must keep pace with those changes.
Reassess your DR plan regularly as part of your software development life cycle or through periodic reviews to keep it current with any changes to your components, services, or solutions.
Paper-based assessments
Organizations often assess DR readiness through documentation reviews or tabletop exercises without running actual recovery tests. This approach can give a false sense of security because real failures rarely match theoretical scenarios.
A complete end-to-end simulation is difficult across a modern data ecosystem, but aim to test as much of the affected environment as possible. Regular drills build your team's confidence and familiarity with the DR plan.
Rely on Microsoft to do it all
Azure services define a clear shared responsibility model for reliability based on the cloud service tier.
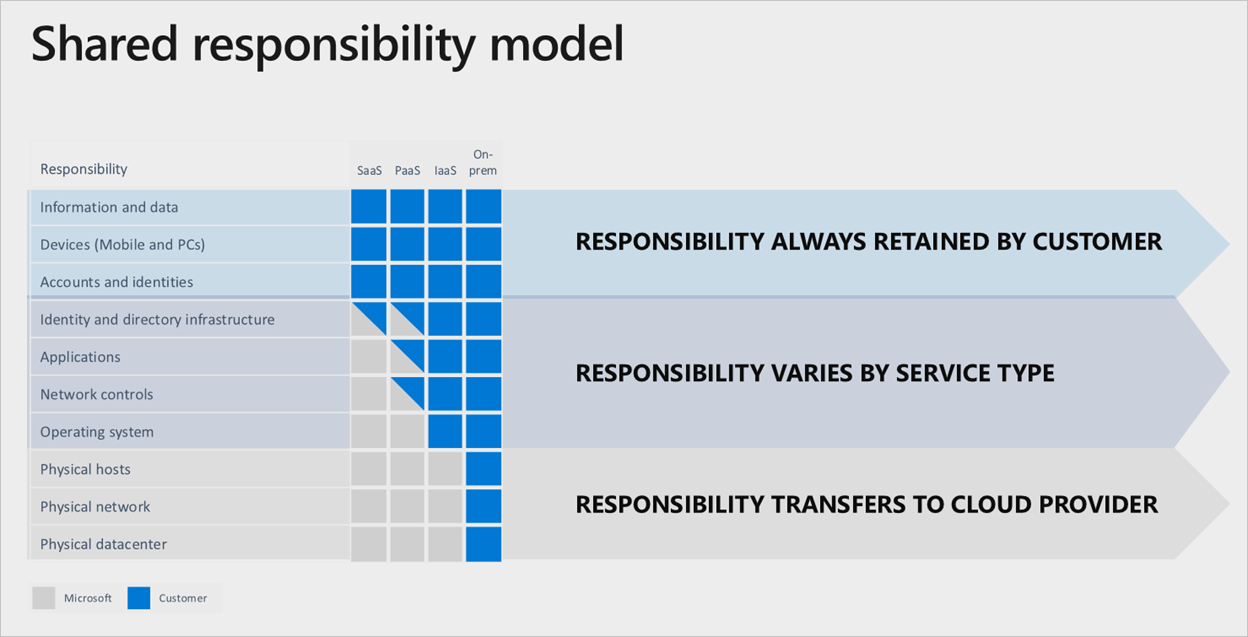
Even with a full SaaS stack, you remain responsible for your accounts, identities, and data, and the devices that users use to access Azure services.
Event scope and strategy
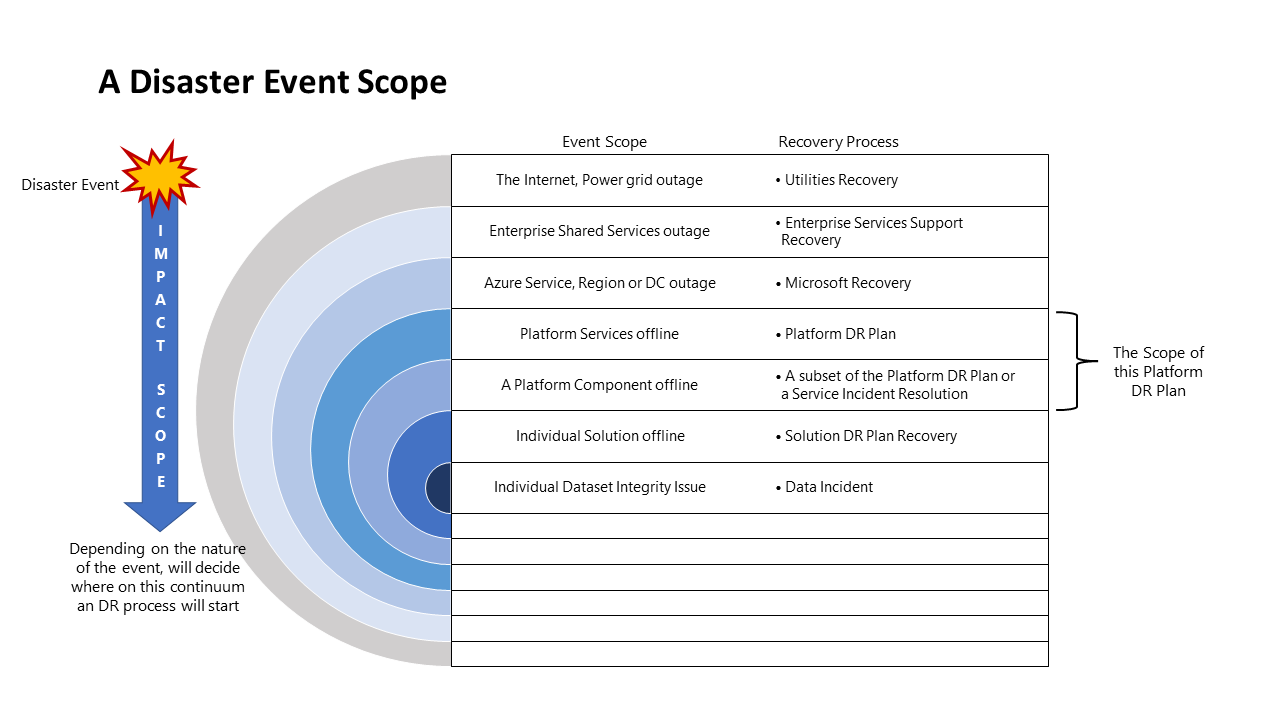
Disaster event scope
Different events have varying scopes of impact that require different responses. The following diagram shows the scope of impact and response for a disaster event.
DR strategy options
Choose from four high-level DR strategies:
Wait for Microsoft: The solution stays offline until Microsoft restores services in the affected region. You then validate and update the solution before you return it to service.
Redeploy on disaster: You manually redeploy the solution from scratch in an available region after a disaster.
Warm spare (active-passive): You deploy a secondary solution in another region with minimal capacity, but it receives no production traffic. The secondary services run at reduced performance or remain turned off until a DR event occurs.
Hot spare (active-active): The solution runs in an active-active setup across multiple regions. Each instance receives, processes, and serves data as part of the overall system.
DR strategy effects
Cost is often the deciding factor when you choose a DR strategy, but RTO, recovery complexity, and customer impact also matter.
Note
Cost Optimization is one of the five pillars of architectural excellence within the Azure Well-Architected Framework. Its goal is to reduce unnecessary expenses and improve operational efficiencies.
The following table compares the four options for a complete Azure regional outage in the primary region that hosts the Contoso data platform. Green indicates a favorable outcome for that factor. Orange indicates a moderate outcome. Red indicates an unfavorable outcome.
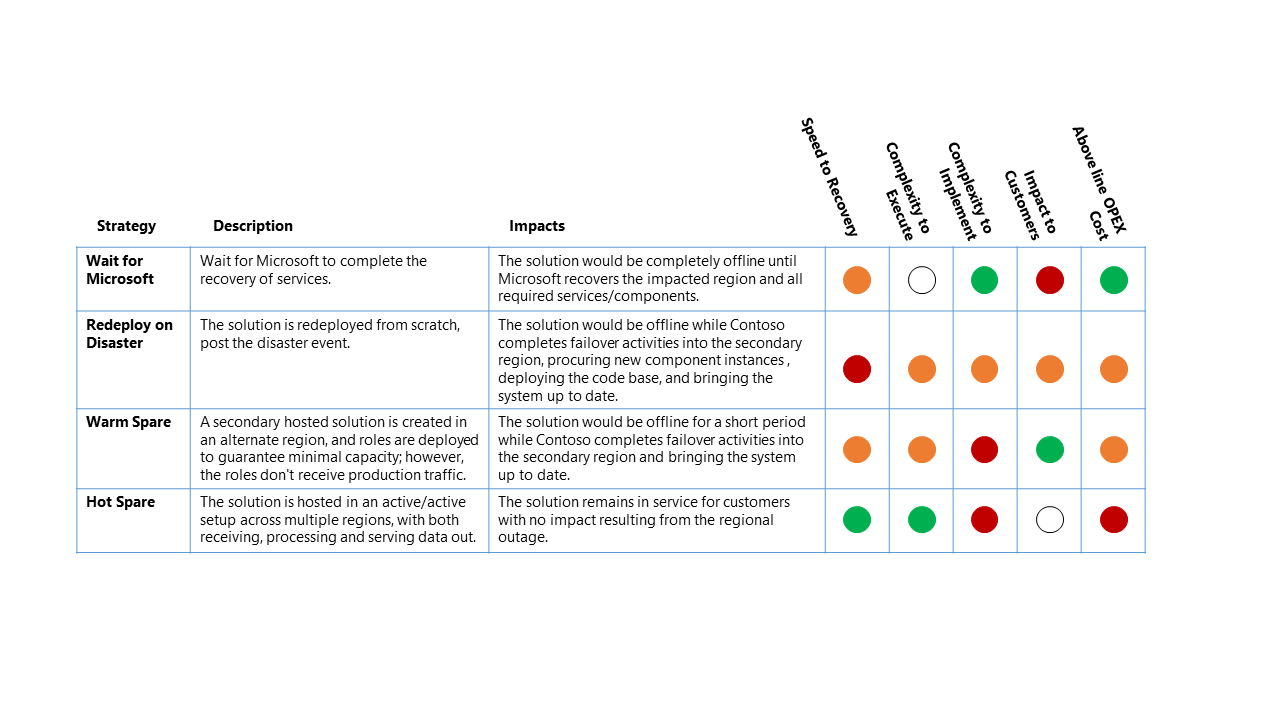
Classification key
For this outage scenario, the following factors determine the relative impact of each DR strategy:
RTO: The expected elapsed time from the disaster event to platform service recovery
Complexity to run: The complexity for the organization to carry out the recovery activities
Complexity to implement: The complexity for the organization to implement the DR strategy
Customer impact: The direct impact to customers of the data platform service from the DR strategy
Above-the-line OPEX cost: The extra cost expected from implementing this strategy, like increased monthly billing for Azure for extra components and extra resources required