View and configure team velocity
Azure DevOps Services | Azure DevOps Server 2022 - Azure DevOps Server 2019
Velocity metrics provide useful information, so teams can plan and forecast sprints and determine how well they estimate and meet planned commitments. You can get an indication of how much work a team can complete during a sprint based on either a count of work items completed or the sum of estimates made for effort (product backlog items), story points (user stories), or size (requirements). Use velocity as an aid to determine team capacity and don't confuse it with key performance indicators.
Prerequisites
- Project membership:
- You must be a member of a project. Get added to a project or create one.
- Team membership and permissions:
- To add a widget to a team dashboard, you need to be a member of the team.
- You must have Basic access or greater.
- You need dashboard permissions, or be a team admin or project admin.
- Feature enablement:
- Boards must be enabled. If disabled, none of the work tracking Analytics widgets will display. To re-enable it, see TTurn an Azure DevOps service on or off.
- Task awareness:
- Be aware of the required and recommended tasks, listed later in this article.
- Project membership:
- You must be a member of a project. Get added to a project or create one.
- Team membership and permissions:
- To add a widget to a team dashboard, you need to be a member of the team.
- You must have Basic access or greater.
- You need dashboard permissions, or be a team admin or project admin.
- Feature enablement:
- Enable or install Analytics. You must be an account owner or a member of the Project Collection Administrators group to add extensions or enable the service.
- Boards must be enabled. If disabled, none of the work tracking Analytics widgets display. To re-enable it, see Turn an Azure DevOps service on or off.
Tip
The images in this article may differ from what you see in your web portal. These differences can be due to updates to your web app, options enabled by you or your admin, and the process chosen when creating your project (Agile, Basic, Scrum, or CMMI). The Basic process is available starting from Azure DevOps Server 2019 Update 1.
Velocity chart types
You can choose between two Velocity charts: the in-context Velocity chart from the Backlogs page and the Velocity widget for dashboards. Both charts help you quickly understand the workflow state categories described in the table below.
Items in the Proposed or Resolved states are excluded from the Completed, Completed Late, and Incomplete calculations. For more information, see How workflow category states are used in Azure Boards. Your selections are personal and persist across sessions until changed.
| Workflow state | Description |
|---|---|
| Planned | Work items assigned to a sprint before it starts. If reassigned after the sprint begins, they remain Planned in the original sprint and appear as Late or Incomplete in the new sprint. |
| Completed | Work items assigned to the sprint and completed before the end of the sprint. |
| Completed Late | Work items assigned to the sprint but completed after the sprint ends. |
| Incomplete | Work items assigned to the sprint but not yet completed. |
| Resolved | Bugs assigned to the sprint, indicating a solution was implemented but not yet verified. |
Later in this article, learn how to open the Velocity in-context report or configure the Velocity widget.
You can configure each chart in the following ways:
- Sum of Effort, Story Points, size fields, or other supported numeric fields assigned to backlog items.
- Count of work items on the backlog.
- Number of iterations.
The widget offers more configuration options. For more information, see Configure and view Velocity charts.
You can choose between two Velocity charts: the in-context Velocity chart from the Backlogs page and the Velocity widget for dashboards. With the Velocity widget, you can quickly determine:
- Planned velocity
- Actual (completed) velocity
- Work completed later than planned
- Amount of work not completed
Both charts support visualizing team velocity for several sprints. The Velocity widget, however, supports the following configuration options:
- Sum of Effort, Story Points, Size fields, or other supported numeric fields assigned to backlog items.
- Count of work items on the backlog.
- Number of iterations.
- Advanced features.
View the Velocity in-context report
Velocity reports are available for both product and portfolio backlogs. Each report includes interactive controls, allowing users to customize the view to their specific interests.
Sign in to your project (
https://dev.azure.com/{Your_Organization/Your_Project}).Select Boards > Backlogs > Analytics to open the Velocity report for your product or portfolio backlog.
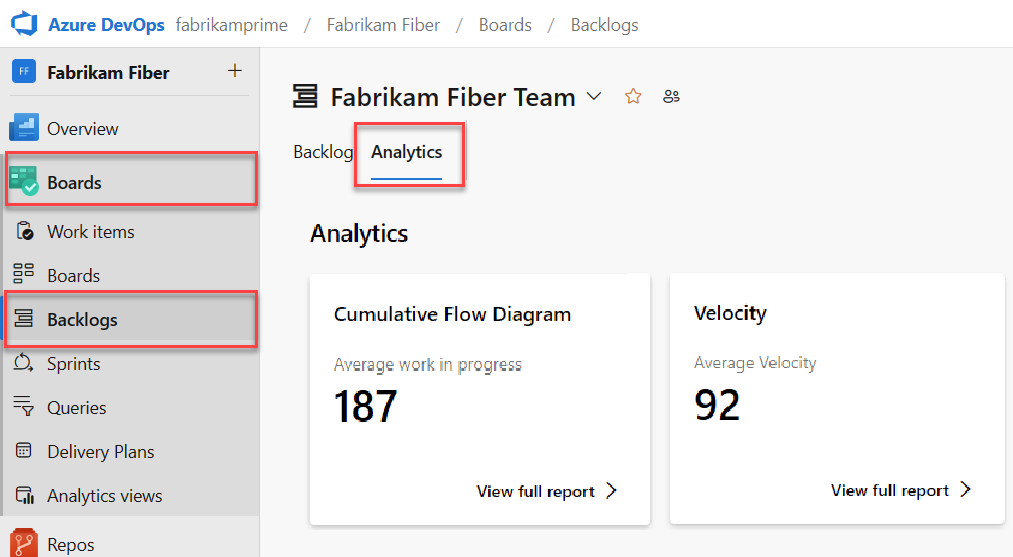
To change to a different backlog, choose from the backlog selector, and then select View full report for Velocity.
Use the interactive controls to select the count or sum field and number of iterations. Select Custom iterations to specify any number of iterations between 1 and 15.
If your team doesn't complete a sprint or if you're working on items before a sprint start date, there's no data to analyze and forecast. You might see this message: Set iteration dates to use this widget. To resolve this situation, set an iteration date range to include present date or wait for the sprint to start.
Hover over a column area to show a summary of planned and completed work items. For example, for the 07_2019 sprint, 131 items are planned.
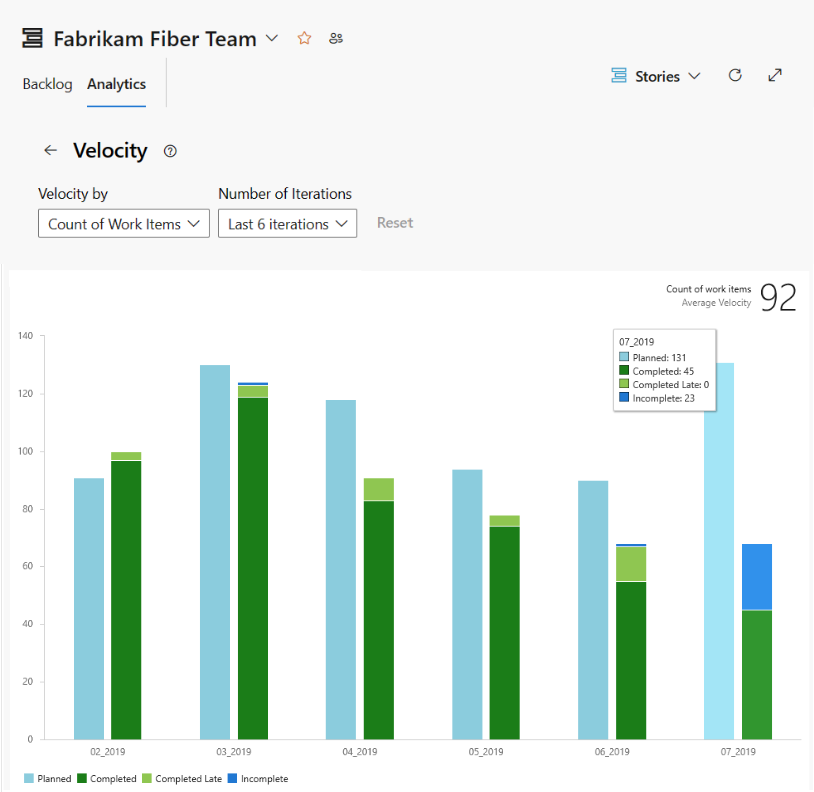
For more information, see the workflow state descriptions mentioned earlier in this article.
To add the report to a dashboard, select the
 actions icon and select Copy to Dashboard.
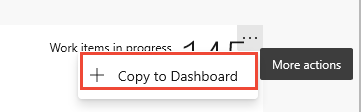
Select the dashboard and select OK.
To return to the Analytics summary, select the
 back arrow.
From the web portal, open your product backlog.
Check that you selected the right project, select Boards > Backlogs, and then select the correct team from the team selector menu.
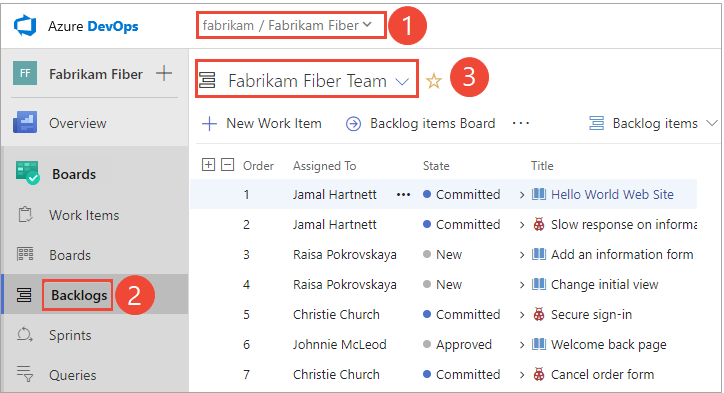
To select another team, open the selector and select a different team or select the
 Browse all backlogs option. Or, you can enter a keyword in the search box to filter the list of team backlogs for the project.
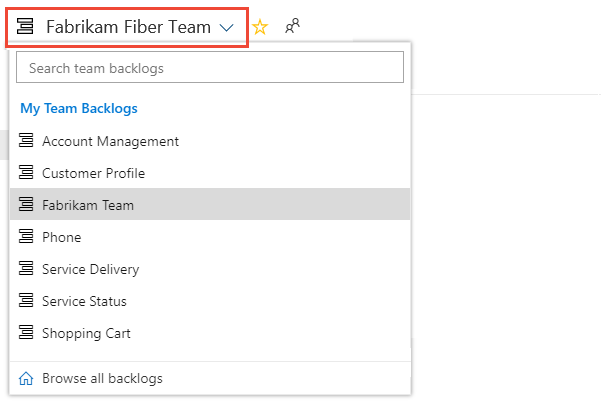
Tip
Select the
 star icon to favorite a team backlog. Favorited artifacts (
 favorited icon) appear at the top of the team selector list.
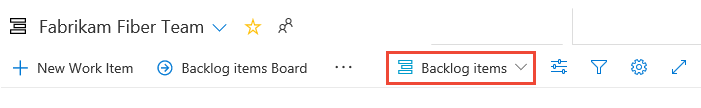
Select Backlog items (for Scrum), Stories (for Agile), or Requirements (for CMMI) as the backlog level.
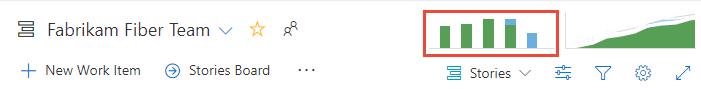
Open the Velocity chart.
For charts to appear, your team must carry out these activities:
- Select sprints for your team.
- Assign backlog items to sprints.
- Estimate backlog items by defining the Effort, Story Points, or Size.
The chart tracks your estimated backlog work (sum of Effort, Story Points, or Size) that is completed (green) in the previous sprints or is in progress (blue).
As the following chart shows, velocity tends to fluctuate from sprint-to-sprint for different kinds of reasons. However, you can quickly determine the average velocity by averaging the values shown in green for each sprint. You can then plug the average into the Forecast tool.
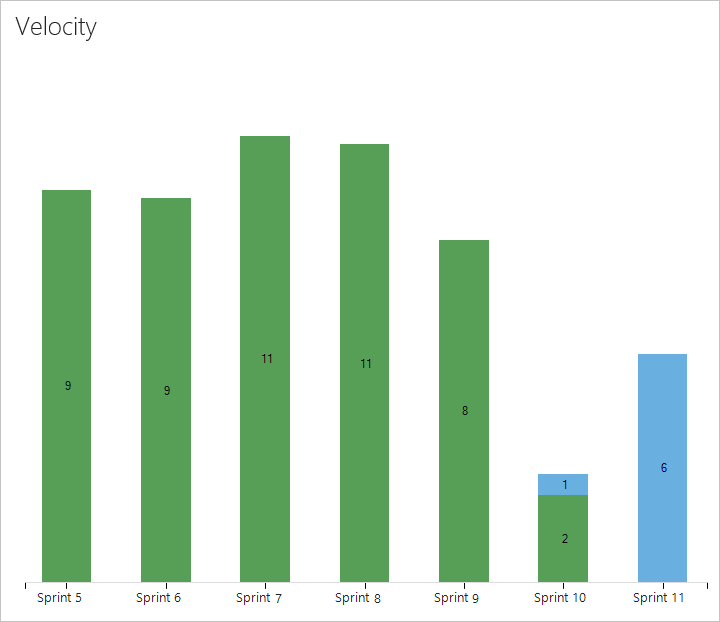
Work items based on the Scrum process get counted in the chart once their State is set to Committed, whereas items based on the Agile and CMMI processes get counted once their State is set to Active. This behavior is set through the workflow states to category state mappings.
Configure the Velocity widget
You can only configure your Velocity widget for a single team. If you want to view the velocity for several teams, then you must configure a portfolio management team that rolls up from several teams. For more information, see Add teams.
If you haven't yet, Add the Velocity widget to your dashboard. For Azure DevOps Server 2019, Enable or install Analytics.
Complete the following steps to configure the Velocity widget.
Select the
 actions icon and select the Configure option to open the configuration dialog.
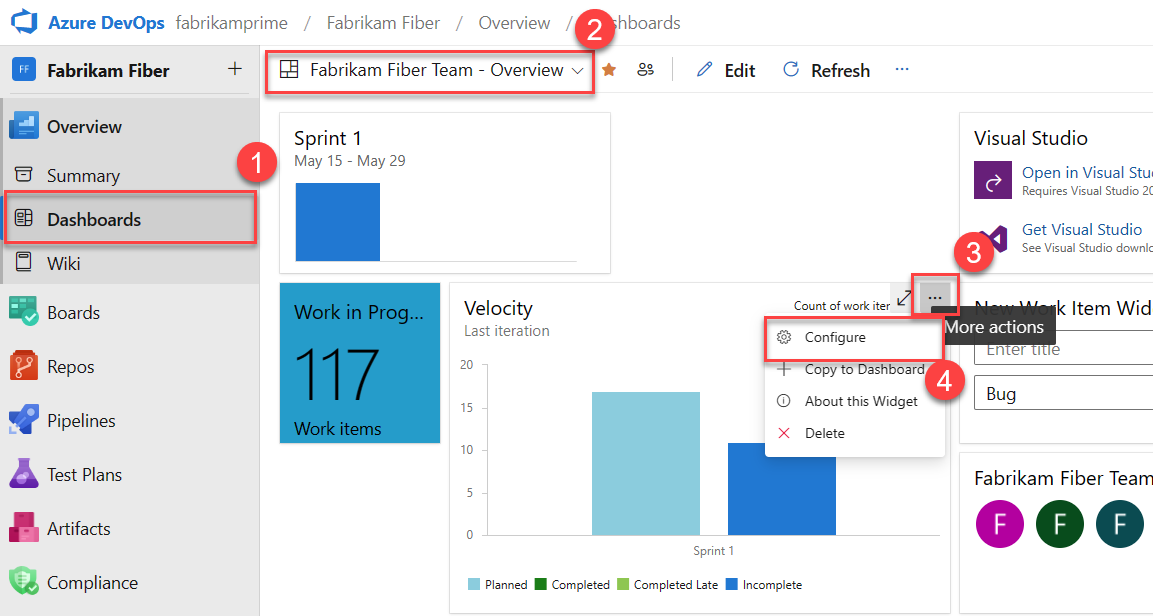
Modify the title, select the team, and then select either the backlog level or work item type to track. Select whether you want to track a count of work items or a sum of a numeric field. The most common summed field is that of Effort, Story Points, or Size.
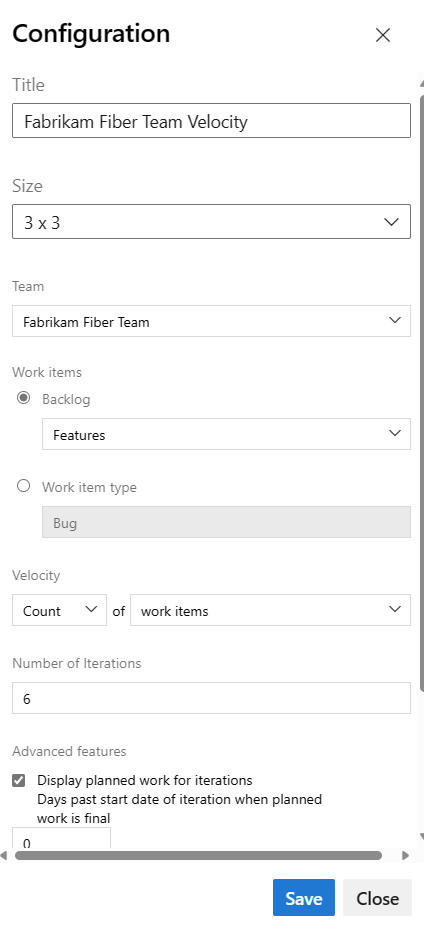
Specify the number of sprints you want to view. The default is 6 and the maximum is 15.
(Optional) Select the check boxes to show additional information for work completed later than planned for each sprint.
- Display planned work for iterations: Check this box to display the amount of work planned for an iteration at the start of the iteration, which is useful for comparing your planned work to actual deliverables. By default, the count of planned work begins on the start date of the iteration.
- Days past start date of iteration when planned work is final: Specify the number of days past the start date for counting planned work. For example, if the first two days of an iteration are for planning, then you can enter
3, and planned work gets counted on the third day. For example, if the iteration starts on01/01/2024, and three backlog items are assigned to the iteration on01/01/2024end-of-day, then those three backlog items are considered as Planned. If your team doesn't complete planning until a few days into the iteration, then you can update the Days past start date of iteration when planned work is final. - Highlight work completed late: Check this box to display work items marked complete after the iteration end date, which is considered to be completed late and show as light green. Highlighting work completed late is useful for spotting a trend where work items are marked complete after the iteration is complete.
- Days past end date of iteration after which work is late: Specify the number of days past which you consider a work item late if its status is still new or is in progress. For example, entering three days gives the team 3 days after the end of an iteration to mark work items complete or done, before considered late.
Select Save. The following image shows Velocity based on Story Points and eight sprints of data.
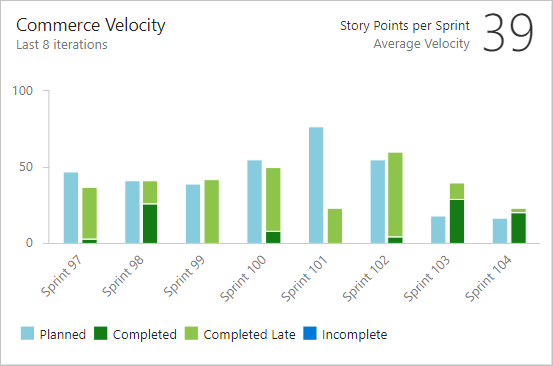
For more information about Planned, Completed, Completed Late, and Incomplete states, see the State descriptions mentioned earlier in this article.
Required and recommended tasks for using Velocity charts
For your team to gain the greatest utility from the Velocity charts, follow these required and recommended tasks.
Required tasks
- Define iteration paths (sprints) and configure team iterations. Ensure sprints are of the same duration.
- Define and estimate backlog items. Items created from the team's backlog are automatically assigned to the current sprint and the team's default Area Path.
- Update the status of backlog items when work starts and completes. Only items with a State of In Progress or Done appear on the Velocity chart or widget.
Recommended tasks
- Define and size backlog items for minimized variability.
- Decide how your team treat bugs. If treated like requirements, bugs appear on the backlog and are included in the Velocity chart and forecasting.
- Set your team's area path. The forecast tool forecasts these settings to include or exclude items in area paths under the team's default.
- Avoid creating a hierarchy of backlog items and bugs. The board, Taskboards, and sprint backlog only show the last node in a hierarchy. Instead, maintain a flat list with parent-child links one level deep. Use Features to group requirements or user stories.
- Update the status of completed backlog items at the end of the sprint. Move incomplete items back to the product backlog for future sprint planning.
- Minimize the size variability of backlog items for improved estimation accuracy. Reducing variability increases the reliability of velocity metrics and forecast results. Estimates are best guesses by the team regarding the effort required to complete an item relative to others on the backlog.
Important
- Deleting Area Paths or reconfiguring Iteration Paths causes irreversible data loss. For example, burndown and burnup widget charts, sprint burndown, and velocity charts for teams with changed Area Paths won't display accurate data. Historical trend charts reference the Area Path and Iteration Path as they were defined at the time for each work item. Once deleted, you can't retrieve historical data for these paths.
- You can only delete area and iteration paths that are no longer used by any work items.
Add other teams
If each team wants their own backlog view, Velocity chart, and forecast tool, you can add a new team. Each team has access to its own set of Agile tools, which filter work items to include only the assigned area paths and iteration paths specific to that team.