Tutorial: connect to a self-hosted Prometheus service on an AKS cluster using a managed private endpoint
This guide walks you through the steps of installing Prometheus, an open-source monitoring and alerting toolkit, on an Azure Kubernetes Service (AKS) cluster. Then you use Azure Managed Grafana's managed private endpoint to connect to this Prometheus server and display the Prometheus data in a Grafana dashboard.
In this tutorial, you learn how to:
- Create an Azure Kubernetes Service Cluster
- Install Prometheus
- Add a private link service to the Prometheus server
- Connect with managed private endpoint
- Display Prometheus data in a Grafana dashboard
Prerequisites
Before you begin, make sure you have the following:
- An Azure account
- The Azure CLI.
- kubectl
- Helm
Create an Azure Kubernetes Service Cluster
Sign into the Azure CLI by running the
az logincommand.az loginIf you have multiple Azure subscriptions, select your Azure subscription with the command
az account set -s <your-azure-subscription-id>.Install or update kubectl.
az aks install-cliCreate two bash/zsh variables, which we'll use in subsequent commands. Change the syntax below if you're using another shell.
RESOURCE_GROUP=myResourceGroup
AKS_NAME=myaks
Create a resource group. In this example, we create the resource group in the West Central US Azure region.
az group create --name $RESOURCE_GROUP --location westcentralusCreate a new AKS cluster using the az aks create command. Here we create a three-node cluster using the B-series Burstable virtual machine type, which is cost-effective and suitable for small test/dev workloads such as this.
az aks create --resource-group $RESOURCE_GROUP \
  --name $AKS_NAME \
  --node-count 3 \
  --node-vm-size Standard_B2s \
  --generate-ssh-keys
This operation may take a few minutes to complete.
Authenticate to the cluster you've created.
az aks get-credentials \
  --resource-group $RESOURCE_GROUP \
  --name $AKS_NAME
You can now access your Kubernetes cluster with kubectl.
Use kubectl to see the nodes you've created.
kubectl get nodes
Install Prometheus
A popular way of installing Prometheus is through the prometheus-operator, which provides Kubernetes native deployment and management of Prometheus and related monitoring components. In this tutorial, we use kube-prometheus-stack Helm charts to deploy the prometheus-operator.
Add the helm-charts repository and then update your repository list.
helm repo add prometheus-community https://prometheus-community.github.io/helm-charts
helm repo update
Install the Helm chart into a namespace called monitoring. This namespace is created automatically.
helm install prometheus \
  prometheus-community/kube-prometheus-stack \
  --namespace monitoring \
  --create-namespace
The helm command prompts you to check the status of the deployed pods. Run the following command.
kubectl --namespace monitoring get podsMake sure the pods all "Running" before you continue. If in the unlikely circumstance they don't reach the running state, you may want to troubleshoot them.
Add a private link service to the Prometheus server
Azure Private Link service enables the consumption of your Kubernetes service through private link across different Azure virtual networks. AKS has a native integration with Azure Private Link Service and helps you annotate a Kubernetes service object to create a corresponding private link service within Azure.
See below the content of the pls-prometheus-svc.yaml file:
apiVersion: v1
kind: Service
metadata:
  name: prom-pls-svc
  annotations:
    service.beta.kubernetes.io/azure-load-balancer-internal: "true" # Use an internal LB with PLS
    service.beta.kubernetes.io/azure-pls-create: "true"
    service.beta.kubernetes.io/azure-pls-name: promManagedPls
    service.beta.kubernetes.io/azure-pls-proxy-protocol: "false"
    service.beta.kubernetes.io/azure-pls-visibility: "*"
spec:
  type: LoadBalancer
  selector:
    # app: myApp
    app.kubernetes.io/name: prometheus
    prometheus: prometheus-kube-prometheus-prometheus # note that this is related to the release name
  ports:
    - name: http-web
      protocol: TCP
      port: 9090
      targetPort: 9090
Run the following command to add the private link service to the Prometheus server.
kubectl --namespace monitoring apply -f pls-prometheus-svc.yamlThe private link service with name
promManagedPlsis created in the AKS managed resource group. This process takes a few minutes.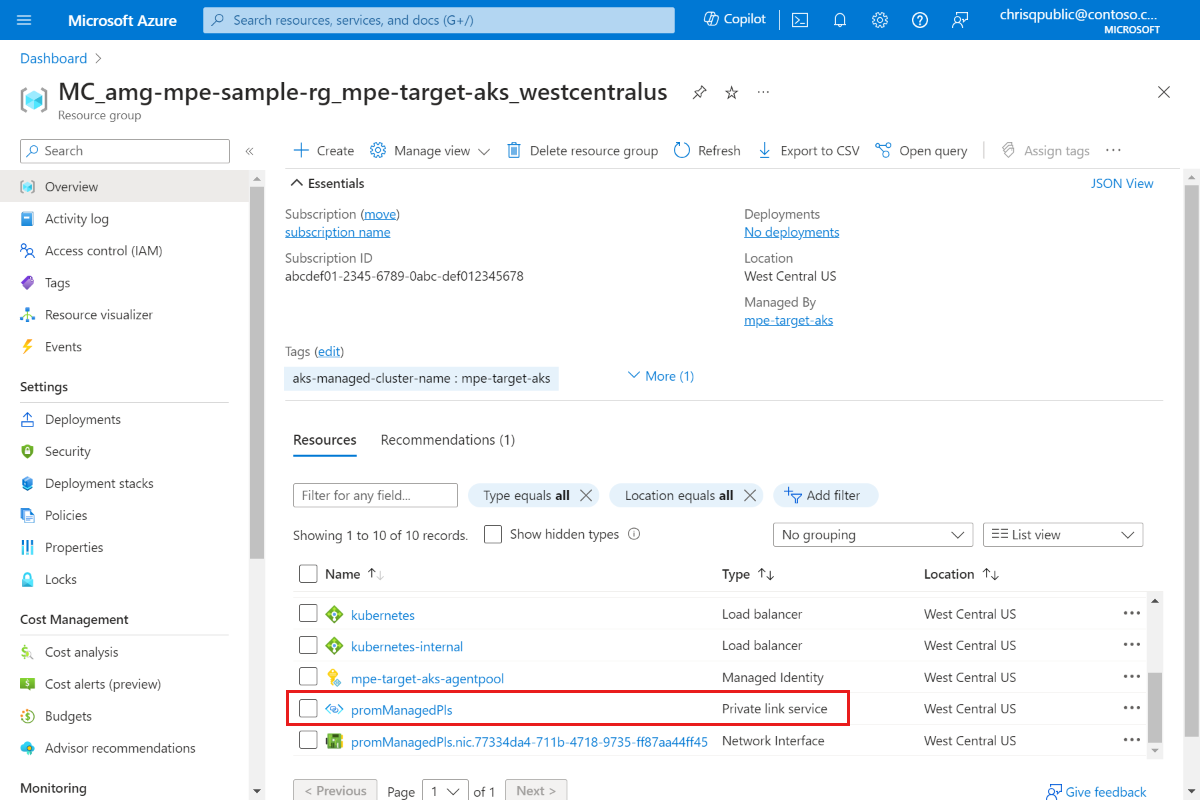
Connect with a managed private endpoint
If you don't have an Azure Managed Grafana workspace yet, create one by following the Azure Managed Grafana quickstart.
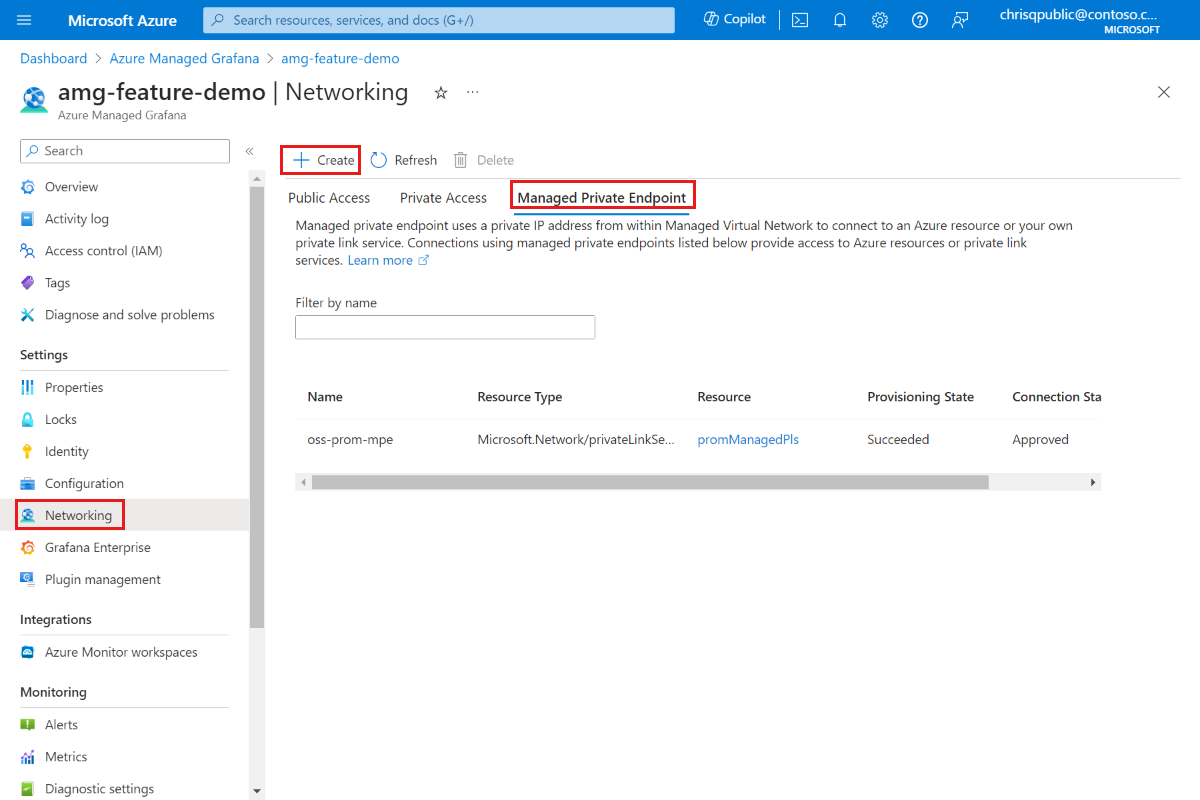
Open your Azure Managed Grafana workspace and go to Networking > Managed Private Endpoint > Create.
Enter a name for your managed private endpoint and select your Azure subscription.
For Resource type select Microsoft.Network/privateLinkServices (Private link services), and for Target resource, select the
promManagedPlsprivate link service created in the above step. Each managed private endpoint gets a private IP address. You can also provide a domain name for this managed private endpoint. The Azure Managed Grafana service ensures that this domain is resolved to the managed private endpoint's private IP inside the Azure Managed Grafana environment. For example, set the domain to*.prom.my-own-domain.com.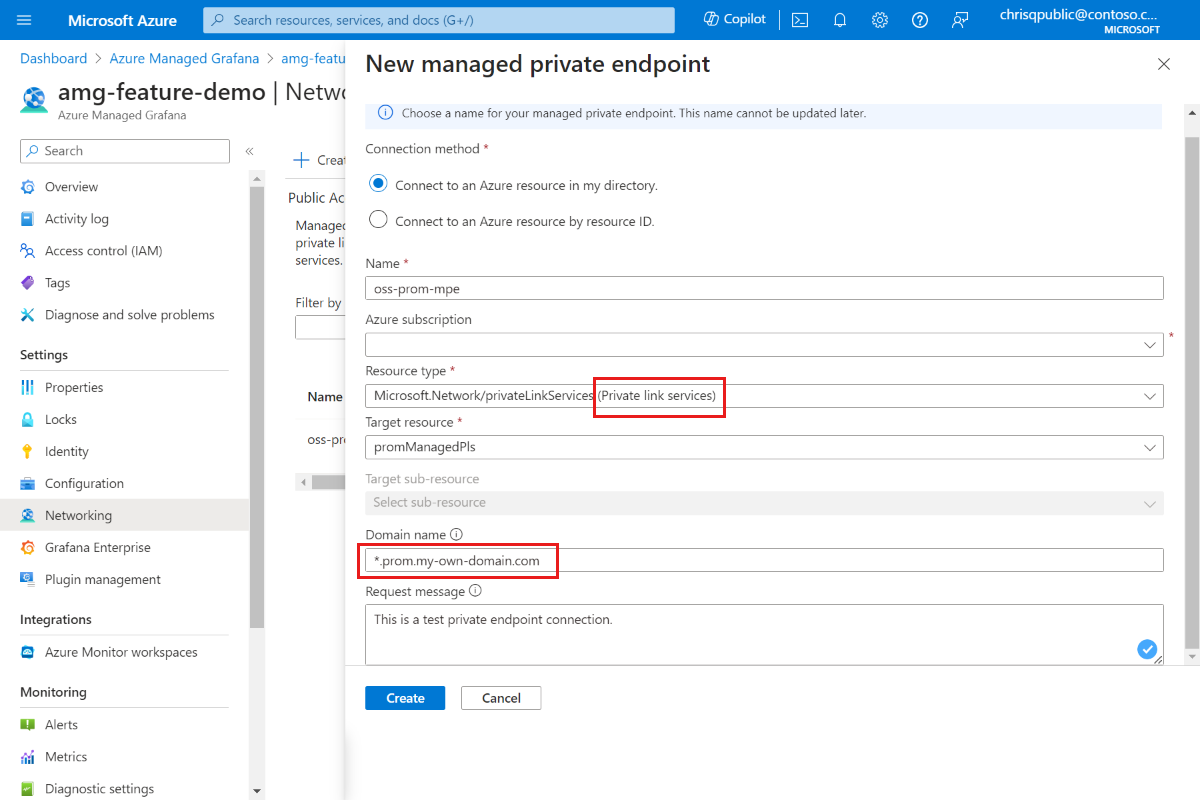
Approve the private endpoint connection by going to the promManagedPls resource. Under Settings, go Private endpoint connections, select your connection using the checkbox and Approve.
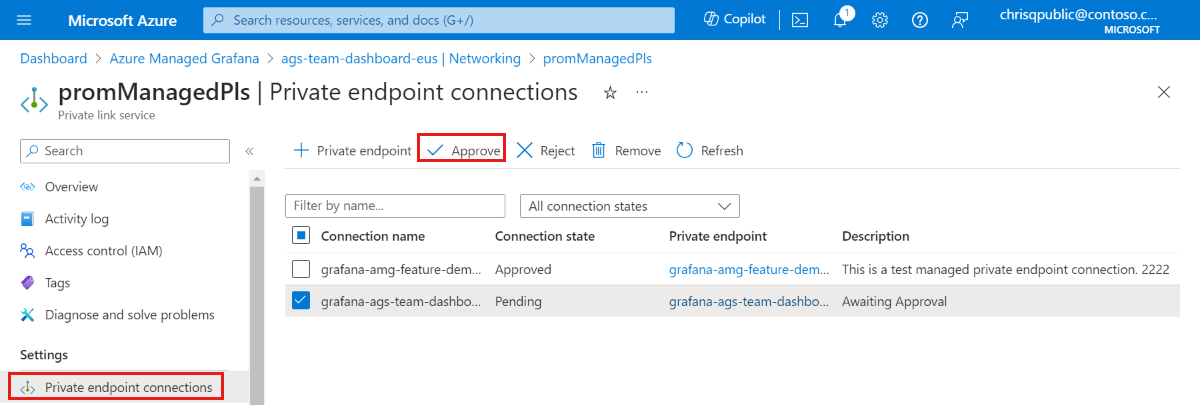
After the private endpoint connection is approved, go back to your Azure Managed Grafana resource and select the Refresh button in the Managed Private Endpoint tab to synchronize the
Connection state. It should now show as Approved.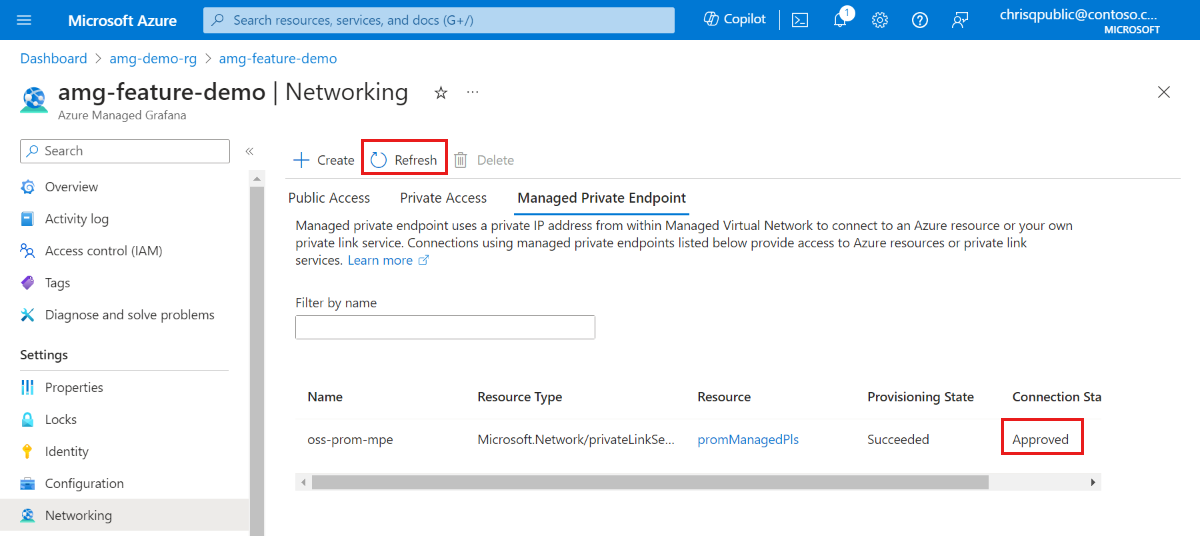
Display Prometheus data in a Grafana dashboard
Add the Prometheus data source to Grafana from your Grafana portal. For more information, go to Add a data source. Our Prometheus URL is
http://prom-service.prom.my-own-domain.com:9090.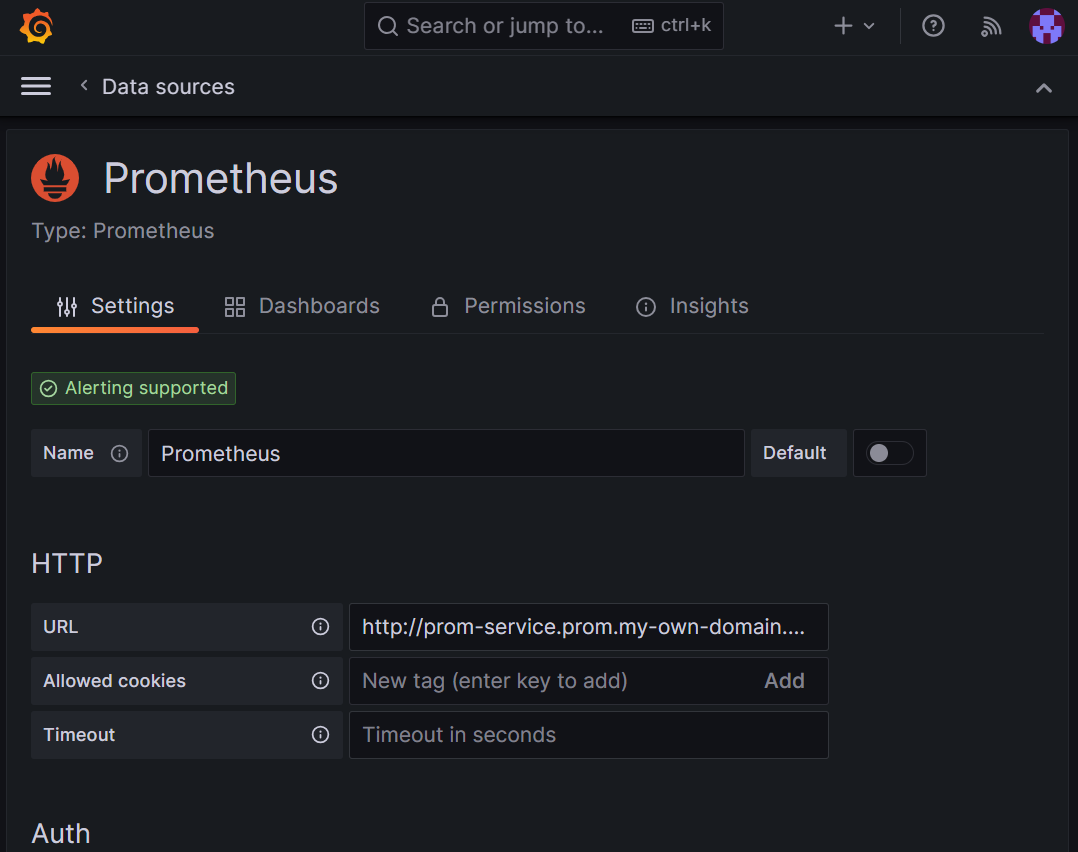
To leverage your self-hosted Prometheus data source, try using the Node Exporter Full dashboard, ID
1860. For more guidelines, go to Import a dashboard from Grafana Labs.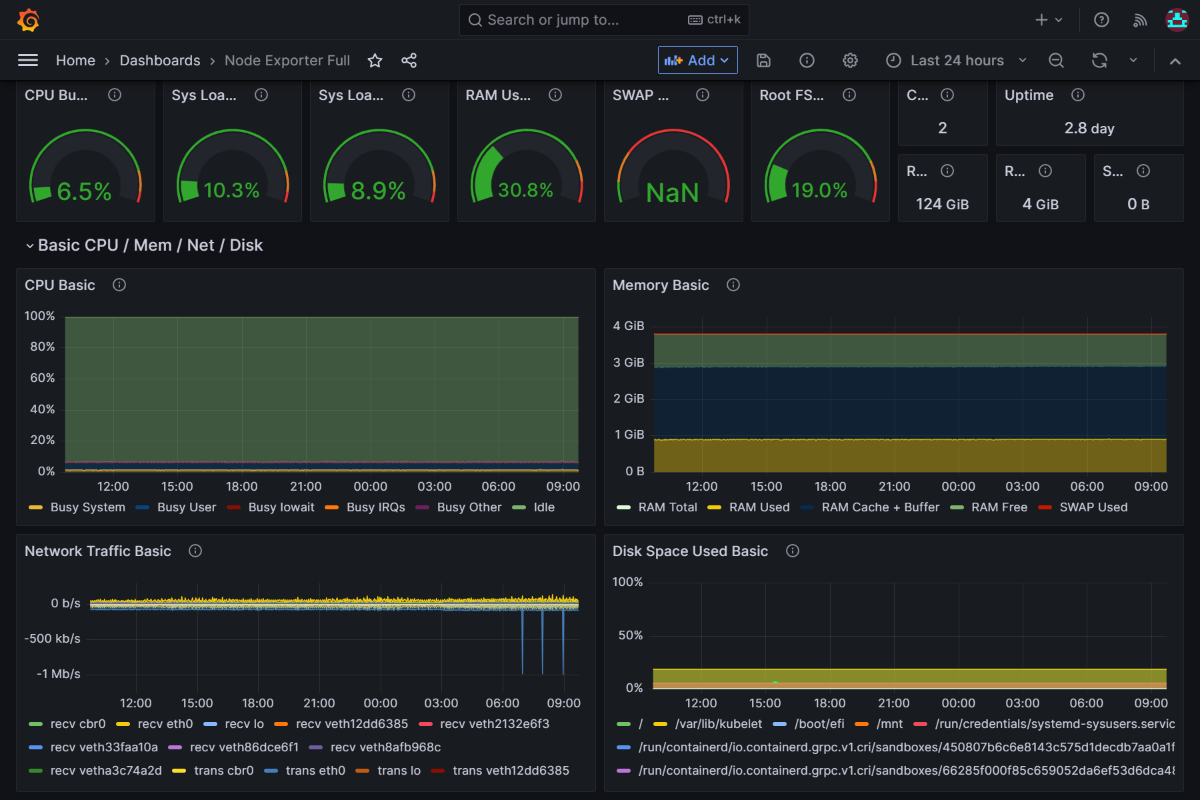
Next step
Learn how to Use service accounts.
Feedback
Coming soon: Throughout 2024 we will be phasing out GitHub Issues as the feedback mechanism for content and replacing it with a new feedback system. For more information see: https://aka.ms/ContentUserFeedback.
Submit and view feedback for