Note
Access to this page requires authorization. You can try signing in or changing directories.
Access to this page requires authorization. You can try changing directories.
APPLIES TO: ![]() Power BI Desktop
Power BI Desktop ![]() Power BI service
Power BI service
In Power BI Desktop and the Power BI service, use Copilot for Power BI to quickly create a narrative about a report with just a few clicks. This narrative can summarize the entire report, specific pages, or even specific visuals that you select. You can curate the tone and specificity of the narrative with suggested and custom prompts, making it extremely versatile.
As this feature is a visual, you need write permissions just as you would for other visual creation. If you don't have write permissions for a report, you can still create a report summary in the Copilot pane.
Note
Keep the following requirements in mind:
- Your administrator needs to enable Copilot in Microsoft Fabric.
- Your Fabric capacity needs to be in one of the regions listed in this article, Fabric region availability. If it isn't, you can't use Copilot.
- Your administrator needs to enable the tenant switch before you start using Copilot. See the article Copilot tenant settings for details.
- If your tenant or capacity is outside the US or France, Copilot is disabled by default. The one exception is if your Fabric tenant admin enables the Data sent to Azure OpenAI can be processed outside your tenant's geographic region, compliance boundary, or national cloud instance tenant setting. You can find this setting in the Fabric admin portal.
- Copilot in Microsoft Fabric isn't supported on trial SKUs. Only paid SKUs are supported.
- To see the standalone Copilot experience in Power BI, your tenant admin needs to enable the tenant switch.
Before you start
You might need to clean up your report. The narrative visual pulls information from what is on the report canvas, not the underlying semantic model, so clearly named visuals and axes are important for the visual to glean highlights, lowlights, and insights from the report. Read the article Update your data model to work well with Copilot to see if you need to modify your semantic model.
In the Power BI service, you need to be in an appropriate workspace to see the Narrative visual with Copilot button in the Visualizations pane. The Copilot visual button is the same as the old smart narrative visual button. Select it, and you see an option to use the old or the new one, with Copilot. For details on what makes an appropriate workspace, see Considerations and limitations in this article.
- The Narrative visual needs content to summarize, so in the Power BI service, select the OneLake data hub, select More options next to a semantic model.
- Select Create report.
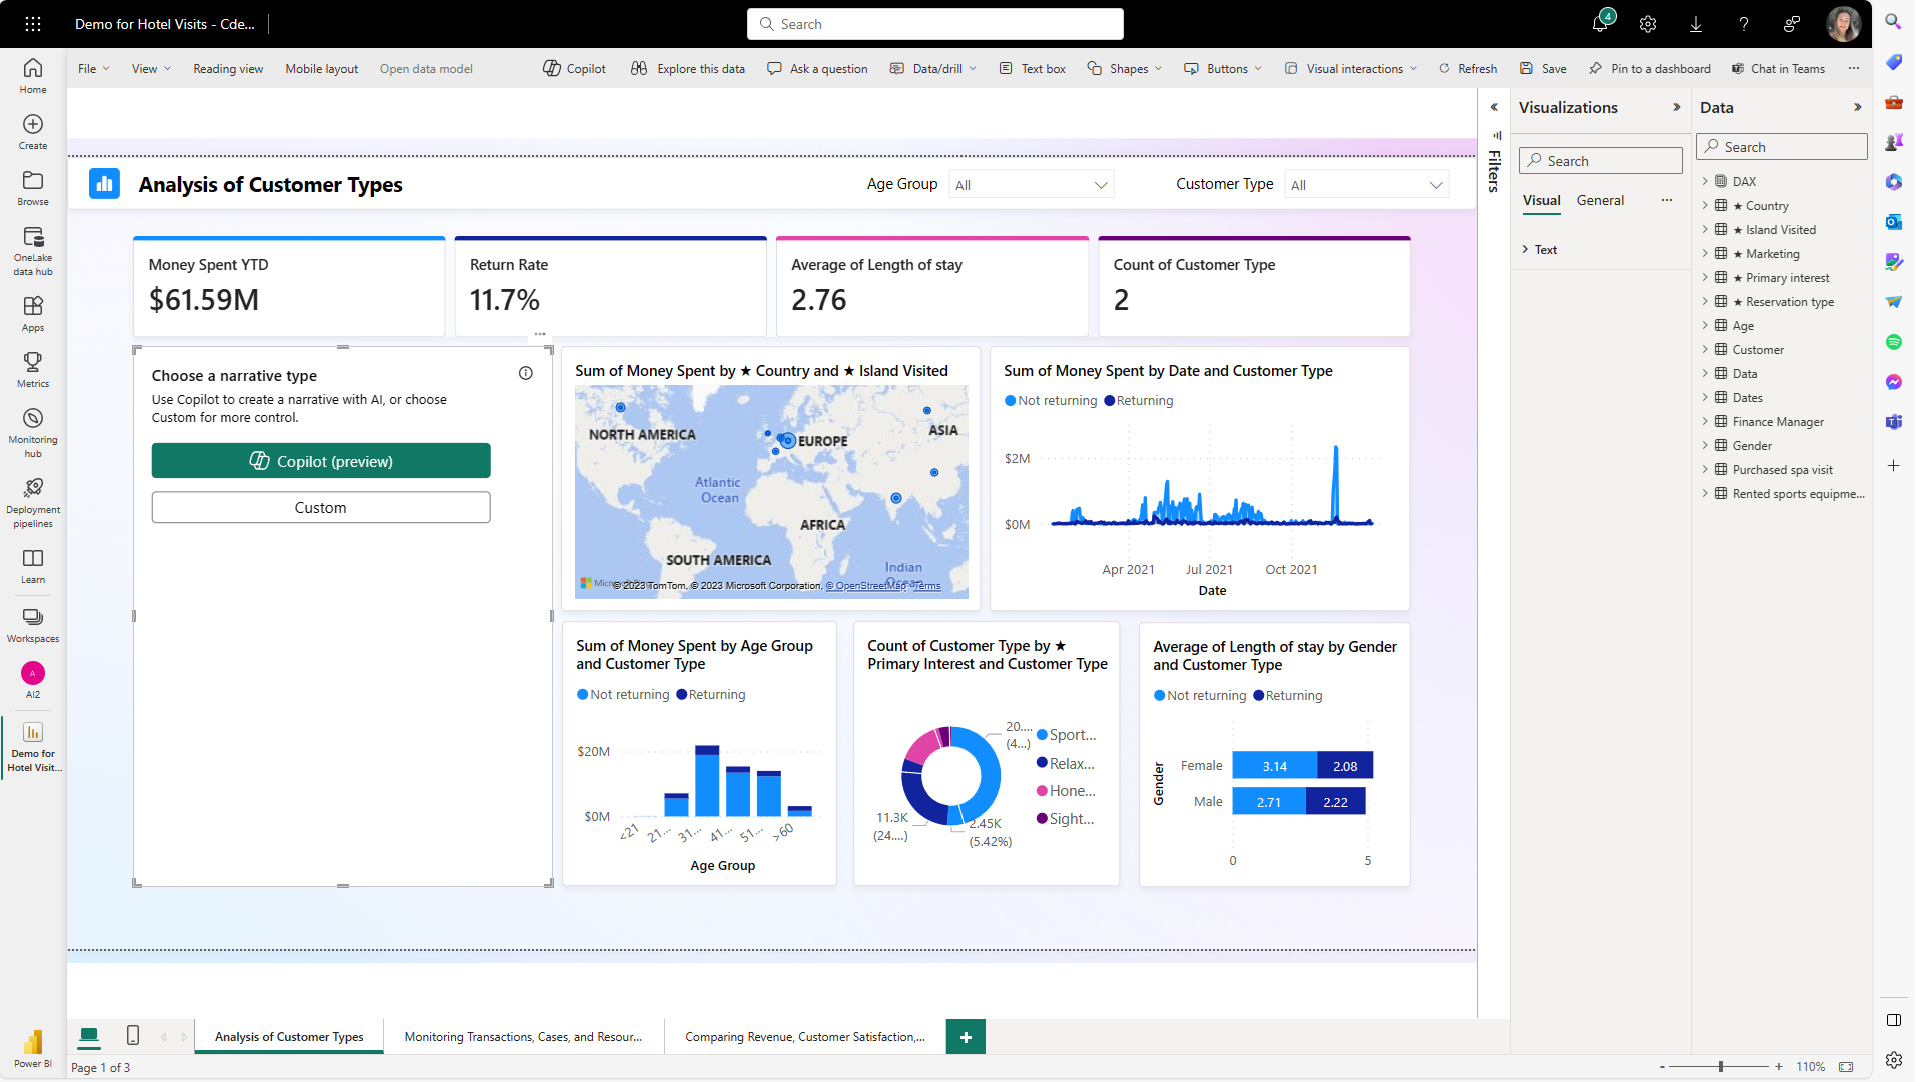
In the Visualizations pane, select the Narrative icon.
In Choose a narrative type, select the Copilot button to use the new narrative visual.
Select an option in the Create a narrative with Copilot dialog, and select Create.
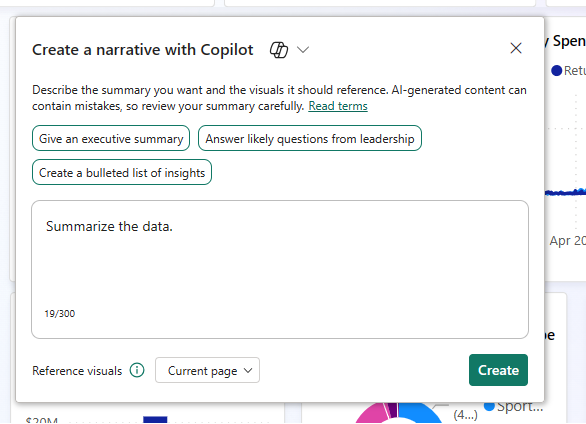
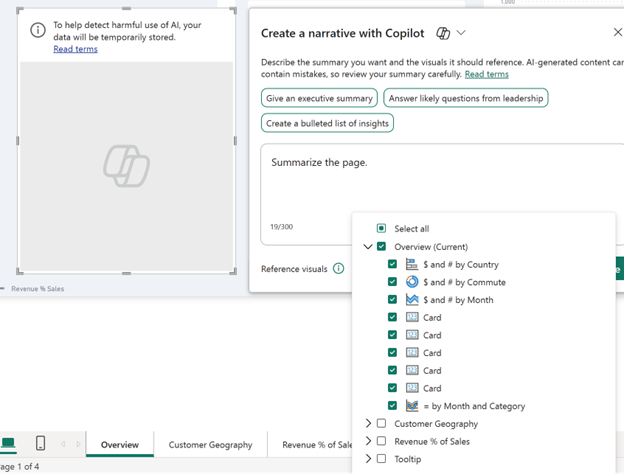
You can include or exclude individual visuals or pages, or summarize the entire report.
Read through the summary to make sure it's accurate.
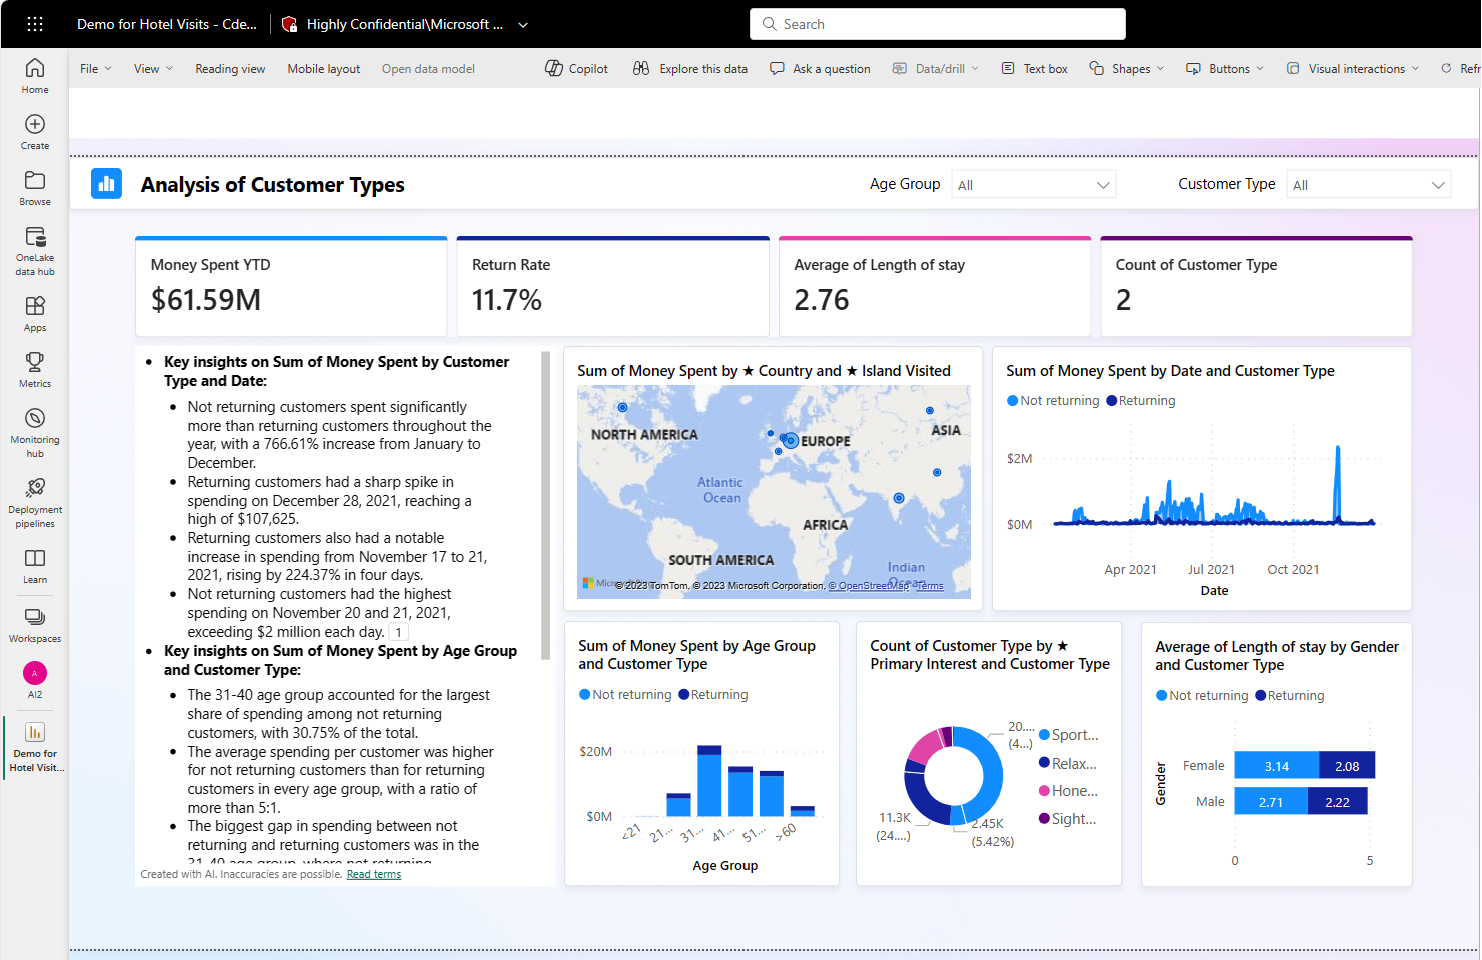
To change the narrative, in the Adjust your summary with Copilot, give instructions to change it, or use one of the suggested prompts.
Select the footnotes to view references to specific visuals in the summary.
Power BI highlights the visual that the footnote refers to.
You can switch back and forth between the previous "smart narrative" visual and the new narrative visual with Copilot by selecting the icon next to the title. The summary content isn't lost when you switch back and forth. Switching might help, as you can't edit the body of the Copilot summary. For control over the generated summary, use custom prompts to specify tone or formatting, direct the summary to specific portions of the report, or clarify requests. You can copy and paste it into the smart narrative body for more involved editing.


Embed the narrative visual
The narrative visual with Copilot supports "embed for your organization" scenarios where the user owns the data and secure embed scenarios.
There are a few embedded scenarios. Only two are supported at this time. This chart makes it clear which scenarios are supported with the Copilot narrative visual.
| Scenario | Supported |
|---|---|
| Embed a report in a secure portal or website Power BI. | Yes |
| Embed in a Sharepoint Site A user embeds a report containing the narrative visual as a Power BI web part in a SharePoint site. Users must authenticate. Embed in a SharePoint site. | Yes |
| User owns data A user embeds a report containing the narrative visual in a solution where users have to sign in. They need a license to sign in. This action is also known as embed for your organization. Note: This scenario does NOT include embedding in PowerPoint at this time | Yes |
| App owns data A customer embeds a narrative visual on a website where users visit, and don't need to sign in. Also known as embed for your customer's application. | Yes |
Follow the instructions in this article to set up Power BI embed and begin embedding your content for your organization: Set up Power BI Embedded.
Save the report
When you're satisfied with the narrative, save the report just like any other report. If you close and reopen the report that Copilot generated in the Power BI service, the report opens in Reading view and you don't see Copilot.
- Select Edit to see the Copilot button again.
View the report
When users view the report, they can slice and dice with filters as they normally would. The narrative visual doesn't automatically update, but there's a refresh button that allows the user to fetch an updated summary according to the applied slicers and filters.
Considerations and limitations
Microsoft is continuously working to improve the quality of the report pages, including visuals, summaries, and synonyms generated by Copilot. Here are the current limitations:
- Copilot stores the selected prompt with report metadata (for example, "summarize sales data") so it can generate the summary each time a report loads.
- Authors: To author a Copilot narratives visual in the Power BI service, the workspace needs a paid dedicated Fabric capacity.
- You can't edit the visual after Power BI generates it. However, you can change it by using prompts. The summary only takes into account the data that's visualized by the selected visuals.
- The summary only takes into account the data that the visual selection editor allows.
- Users need to refresh the summary visual when they update or filter a page, report, or data, to see an updated summary.
- The narrative visual doesn't yet support all visual types. For example, it doesn't yet support key influencers.