Note
Access to this page requires authorization. You can try signing in or changing directories.
Access to this page requires authorization. You can try changing directories.
Important
This feature is part of the Frontier preview program. Frontier connects you directly with Microsoft's latest AI innovations. Frontier previews are subject to the existing preview terms of your customer agreements. As these features are still in development, their availability and capabilities might change over time.
The Overview page is the app's home page. It gives you an at-a-glance summary of how many people in your organization use AI, what it costs, how that cost tracks against your budget, and which services and use cases drive the most spend. From each section of the Overview page, you can go directly to the detailed page for that topic.
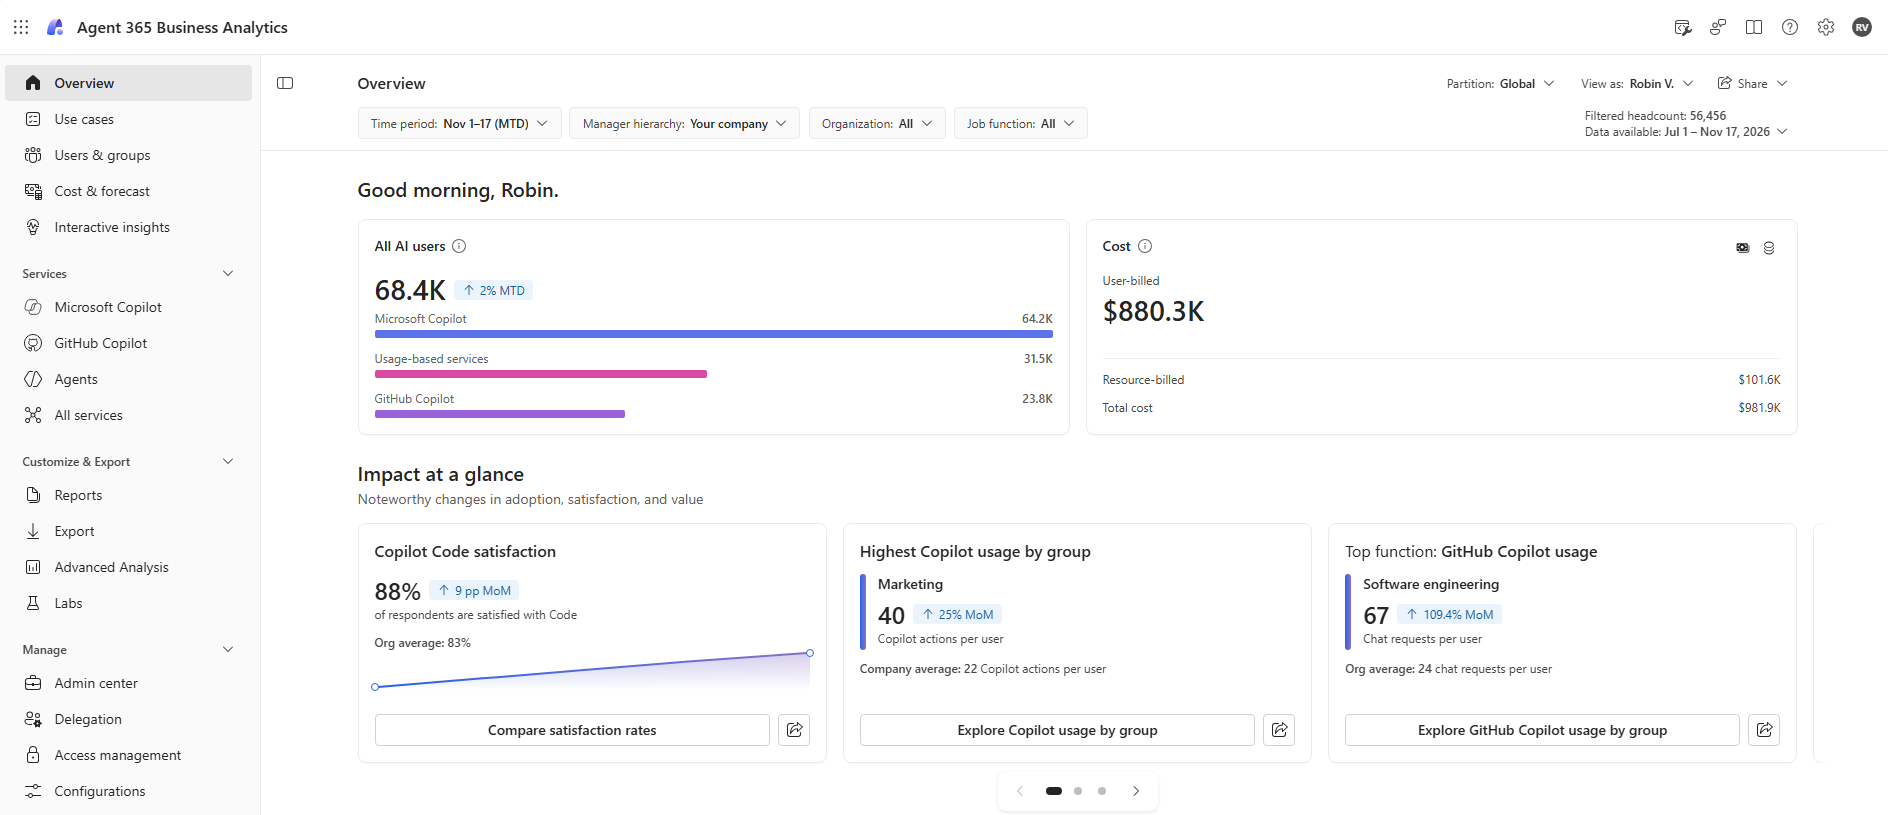
What you see on the Overview page depends on your role, your organization's settings, and whether your organization uses usage-based AI services.
Filters and page controls
Filters at the top of the page apply to all metrics on the Overview page.
| Filter | Description |
|---|---|
| Partition | The data partition you're viewing. |
| View as | Controls the user or role who's viewing the page, including through delegation. |
| Time Period | The date range for the metrics. Defaults to month to date, but you can also set to quarter to date, year to date, all time, or set a custom range. |
| Other filters | Narrow the data by Manager hierarchy, Organization and Job function. |
| Customize filters | At the right, select Customize filters to remove or add additional filters based on whether your tenant has uploaded additional HR attributes. |
Summary
At the top of the page, key metric cards show your organization's overall AI picture. The table below provides more information about these metrics.
| Metric | Description |
|---|---|
| All AI users | The unique number of people number of people who used any Microsoft AI service in the selected period, across Microsoft Copilot, usage-based services, and GitHub. The card also shows the change compared with the start of the time period and splits the total into Microsoft Copilot users, Usage-based services users, and GitHub Copilot users. Because one person can use more than one, the split values can add up to more than the total. |
| Cost | The total cost across usage-based services, agents, and GitHub Copilot. Includes costs billed to users and groups, as well as costs billed to resources, such as Copilot Studio agents. At the top right of the card, select Total credits to view consumption in credits instead of currency. In the credits view, Microsoft AI credits and GitHub AI credits are shown separately. |
Impact at a glance
This section provides insights about how AI is affecting your organization. Each highlight shows a headline insight, a supporting chart, and a link to the page where you can explore the data further. Use the carousel controls underneath to browse the highlights, and select Share on a highlight to share it with others.
The highlights you see depend on your organization's activity:
Organizations with usage-based activity see stories that span AI services, such as cost concentration in top use cases, developer outcomes for AI users versus non-AI users, satisfaction scores for usage-based services, and how often Cowork creates an output file.
Organizations without usage-based activity see stories focused mostly on Microsoft Copilot, such as industry benchmarks, power users, and changes in satisfaction scores for specific groups.
Examples of highlights include:
| Highlight | What it shows |
|---|---|
| Top use cases | The leading use cases for Microsoft Cowork and agents, based on how they are used. |
| Company power-user rate | Percent of Microsoft Cowork power users compared against the industry's average. |
| Satisfaction score | Service showing the largest gain in average satisfaction score over the past month. |
| Work output | The share of Cowork sessions that produced an output file. |
Cost and budget
The Cost and budget section helps you understand your current AI costs, your projected future costs, and your top cost drivers.
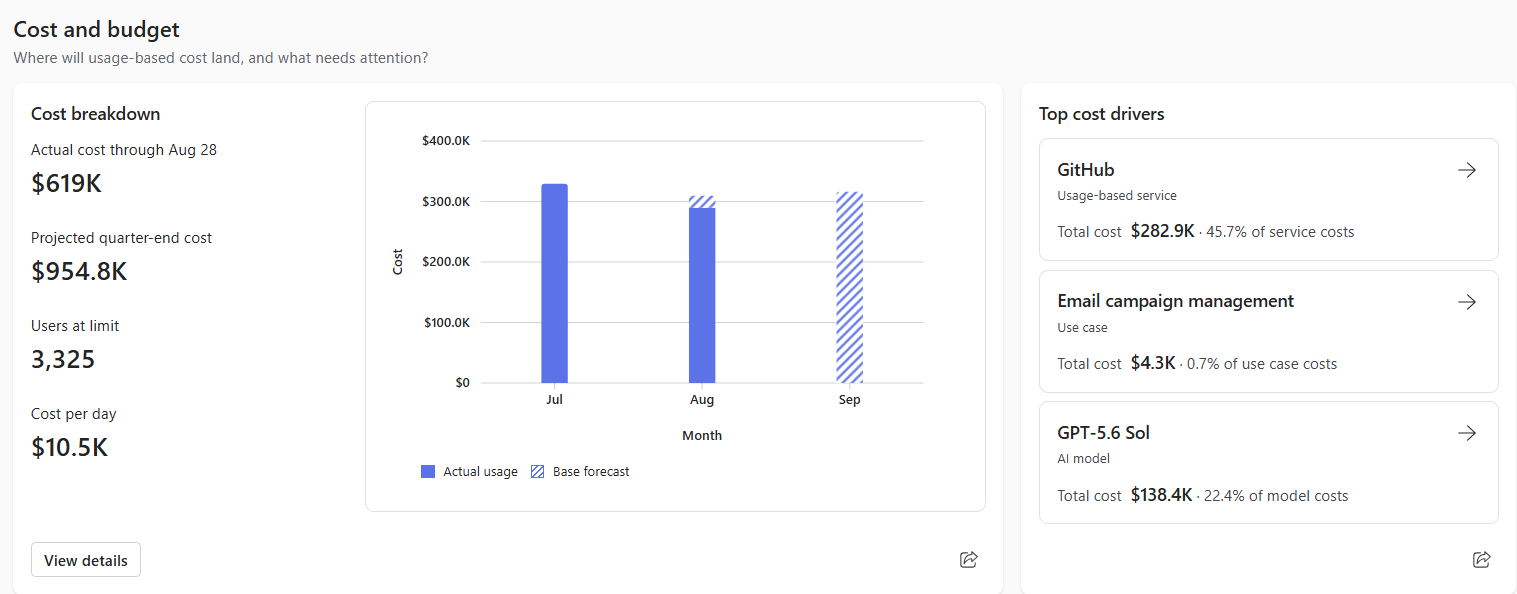
Users at limit
If users have reached their cost limit, the alert shows how many users are affected and what percentage of usage-based users that represents. Select Review user limits to review their policies and usage and determine where limits might be blocking work.
Cost breakdown
The cost breakdown chart shows how cost has built up over the period. The table below provides more information about the data points for the chart and how they're shown.
| Data point | Description |
|---|---|
| Actual cost | The cost incurred from the start of the period through the most recent data date. Shown as a solid line. |
| Forecast | The projected cost at the end of the time period, based on recent usage. Shown as a projected (dotted) line. |
| Policy limit | Your budget for the period, if a policy is selected or a custom budget target has been added. |
| Daily cost per user | The average daily cost per user over the selected time period. |
To explore forecasts in more detail, including forecast types and what-if scenarios, go to the Cost & forecast page.
Top cost drivers
Top cost drivers call out what's driving the most cost in the selected time period. The table below describes the types of drivers that are shown here.
| Driver | Description |
|---|---|
| Service | The AI service with the highest total cost, and its share of total service cost. |
| Job function | The job function with the highest total cost, and its share of total use case cost. |
| AI model | The AI model with the highest total cost, and its share of total model cost. |
Select the button at the bottom left of the cost breakdown card to open the the Cost & forecast page.
Usage and services
The Usage and services section lets you compare the reach, usage, and cost of your organization's top AI services in the selected time period. The section shows the services your organization uses most, such as Microsoft 365 Copilot, agents, and GitHub, and groups all remaining services under Other services.
Each service card shows:
| Metric | Description |
|---|---|
| Active users | The number of people who used the service in the selected time period. |
| Actions or Sessions | The volume of activity for the service. Microsoft 365 Copilot shows actions; usage-based services show sessions. Also includes GitHub Copilot "Chat requests" for GitHub. |
| Costs | The cost of the service in the selected time period. For Microsoft 365 Copilot, cost shows as "Included in license" because it's covered by the per-user license. |
Select a service card to open that service's dedicated page. Other services opens the All services page, which lists every AI service used in your organization, including usage-based services that don't have their own detailed page.