Note
Access to this page requires authorization. You can try signing in or changing directories.
Access to this page requires authorization. You can try changing directories.
Important
This feature is part of the Frontier preview program. Frontier connects you directly with Microsoft's latest AI innovations. Frontier previews are subject to the existing preview terms of your customer agreements. As these features are still in development, their availability and capabilities might change over time.
The Agents page in the Business Analytics app gives leaders, analysts, and other stakeholders one place to understand how agents are used across your organization, what they cost, and what people use them for. It brings together the reporting that was previously split between the Copilot Agent Dashboard and the Agent 365 Dashboard in the Viva Insights web app, and adds new insights for cost, use cases, and AI models.
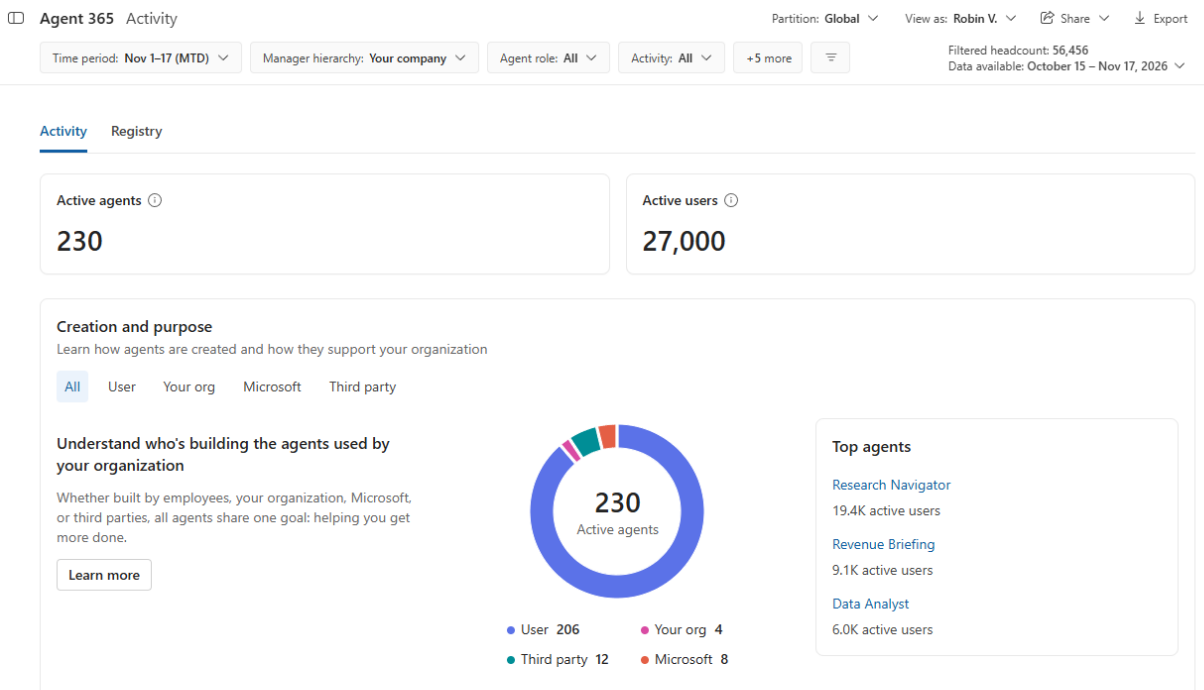
With the Agents page, you can:
Track agent adoption over time across your organization, and see which groups are adopting agents
See the cost of agents that use usage-based and resource-based billing, in U.S. dollars
Understand who's creating the agents that people use, by creator type
Explore what agents are used for, using a detailed use case taxonomy
See which AI model providers drive agent sessions and cost
Search and sort a registry of agents, and open a deep dive page for any agent
It includes two different reporting experiences or views:
Copilot Agent Dashboard - Provides actionable insights into agent adoption. This view of the dashboard provides insights only for agents used within Microsoft Copilot.
Agent 365 Dashboard – Provides actionable insights into agent adoption and sessions, on all supported agents used across Microsoft 365 apps. Its reporting history covers the period after which your organization accepted the terms of use of Agent 365 licensing.
If your organization has fewer than 28 days of history, you'll see an option to navigate to the Copilot Agent Dashboard in an informational banner. Select the link to access the Copilot Agent Dashboard. Some metrics and reporting experiences differ between the two dashboard views.
The Agents page has different tabs depending on the view you're using:
Copilot Agent view
Activity - Agent adoption and usage across the organization, including high-level metrics for active agents, active users, and agent responses, and the most-used agents by creator type
Agent snapshot – Adoption-only list of Copilot agents measured by agent responses
Agent 365 view
Activity - Agent adoption and usage across the organization, including high-level metrics for active agents, active users, and agent sessions, along with insights into who creates the agents used by the organization and the most-used agents by creator type
Registry – Agent-level metrics, highlights, and a searchable list of agents, each linking to its own deep dive page
Note
The analyzed population on the Agents page includes all employees who have had agent activity during the selected time period.
Prerequisites
Your organization must have at least 50 Microsoft 365 Copilot licenses assigned and have agent activity.
To see agent sessions and registry insights for third-party agents, your organization needs Agent 365 licensing.
To see cost and Copilot Credits, your organization must have agents that use usage-based billing, and you must have access to cost insights. Learn more in Who can see cost data.
How to access the Agents page
Open Business Analytics.
On the left, under Services, select Agents.
How automatic access is determined
Using Microsoft Entra ID data
For customers who use Microsoft Entra ID to manage user profile data like organization or manager data, the Agents page is automatically available to a limited number of users. Access is based on Microsoft Entra ID data, specifically the manager hierarchy attribute. Microsoft 365 Global Administrators can disable access at any time.
Users who are senior leaders within large teams, as determined by their Entra ID manager attribute, can automatically view the page. Tenants must meet both of the following criteria to qualify:
The majority of users in the tenant are part of a single reporting line; for example, they report to the same CEO.
The tenant has at least 2,500 users with an Entra ID.
For qualifying tenants, only users who meet all of the following criteria are enabled by default:
The user is in the top three levels in the organization.
The user has a significant portion of the organization in their reporting line.
Users who are assigned the Global administrator role also have access to the Agents page.
Enabled managers who already have team-level access can also access the page. Managers can see agent insights scoped to the teams they're enabled to view.
Note
If you're a Privileged Identity Management (PIM) enabled tenant, global admins might not have access to the Agents page. To give global admins access, add them explicitly.
The criteria above are analyzed weekly to capture any major organization changes. Each week, any new users who meet the criteria gain access. The Microsoft 365 Global Administrator can revoke access for those users through the Microsoft 365 admin center, and they aren't added back unless the admin re-enables them.
Using assigned access
The following types of users also have access to the Agents page:
Analysts with global partition access
Users with delegated access
Who can see cost data
Cost and Copilot Credits data for Agent 365 reporting has separate access requirements from adoption data.
Senior leaders: Cost insights are turned off by default. An admin must turn them on.
General managers: Cost insights are turned on by default.
If you don't have access to cost data, the Agents page still shows every other section you're authorized to see.
Data availability
By default, data on the Agents page covers the current month to date. You can change the time period.
At the top right of the page, Data available shows the most recent date that data is available for. Select the info icon next to it to see data freshness details.
Filtered headcount shows the number of employees included in your current filter selections.
Which agents have cost data
Not all agents incur usage-based charges, so cost isn't shown for every agent:
Agents with usage-based billing show cost in U.S. dollars and Copilot Credits. On an agent's deep dive page, Billing shows Usage-based billing.
Agents that aren't billed by usage don't show cost. In tables, their cost appears as —.
Agents built in Microsoft Copilot Studio are billed at the environment or resource level, so their cost is available at the tenant level only, not for individual users or sessions.
Select the filters for your analysis
Filters you select at the top of the page apply to all the tabs, and to agent deep dive pages.
Manager hierarchy – Defaults to Your company. Choose to view insights for your whole company, your own group, or specific leaders' groups.
Agent creator type – Who created an agent. See Agent creator types.
Agent source – Where an agent was built. See Agent sources.
Organization
License – The type of Copilot license
Job function
User segment – The usage intensity
By default, the Manager hierarchy and Organization filters are based on Microsoft Entra ID. The Job function filter only appears if your admin uploads organizational data that includes job function.
To add more page-level filters, at the right, select Customize filters. If your organization has uploaded additional HR attributes – for example, country or region – you can add them as filters.
Agent creator types
The Agent creator type describes who created an agent:
User: Agents built by users and optionally shareable with others
Your org: Admin-approved agents built by and for your organization
Microsoft: Agents built by Microsoft
Third party: Admin-approved agents built by a third party
Agent sources
The Agent source describes where an agent was built. Options might include:
Agent Builder: A quick and easy interface for end users to build Copilot agents for themselves or small teams
Microsoft Copilot Studio: The full agent building experience with advanced capabilities for building and publishing agents to broader audiences
Microsoft SharePoint: An experience for end users to build agents accessible from SharePoint directly
Microsoft 365 Agents Toolkit: A pro-code suite of tools to build enterprise-ready agents that can be published across multiple channels
Other: Used for agents built on Microsoft platforms when the exact source can't be identified
Copilot Agent tabs
Activity tab
The Activity tab provides an overview of agent adoption and usage across the organization. It shows high-level metrics for active agents, active users, and agent responses, along with insights into who creates the agents used by the organization and the most-used agents by creator type. The Group comparisons section helps you compare agent activity across manager hierarchies, job functions, and users, and view how agent adoption and usage change over time.
Note
To protect individual privacy, agent names and group metrics aren't shown for groups that are smaller than the minimum group size.
Summary metrics
At the top of the tab, cards summarize agent adoption for the selected time period and filters:
Active agents – The number of agents that had activity
Active users – The number of employees who had agent activity
Agent responses – The number of times an agent responded to a user in the selected time period
Creation and purpose
This section helps you understand who's building the agents used in your organization.
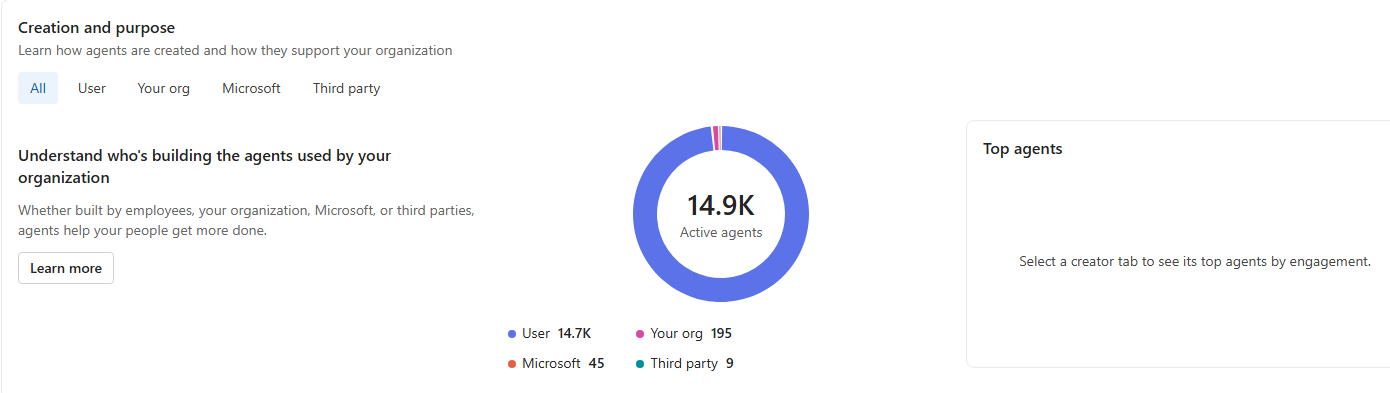
A chart shows the number of active agents by creator type: User, Your org, Microsoft, and Third party.
Select a creator type tab – All, User, Your org, Microsoft, or Third party – to see its top agents by engagement. Select an agent to open its deep dive page.
Group comparisons
This section helps you understand which groups are integrating agents into their workflows and compare their levels of agent activity and engagement.
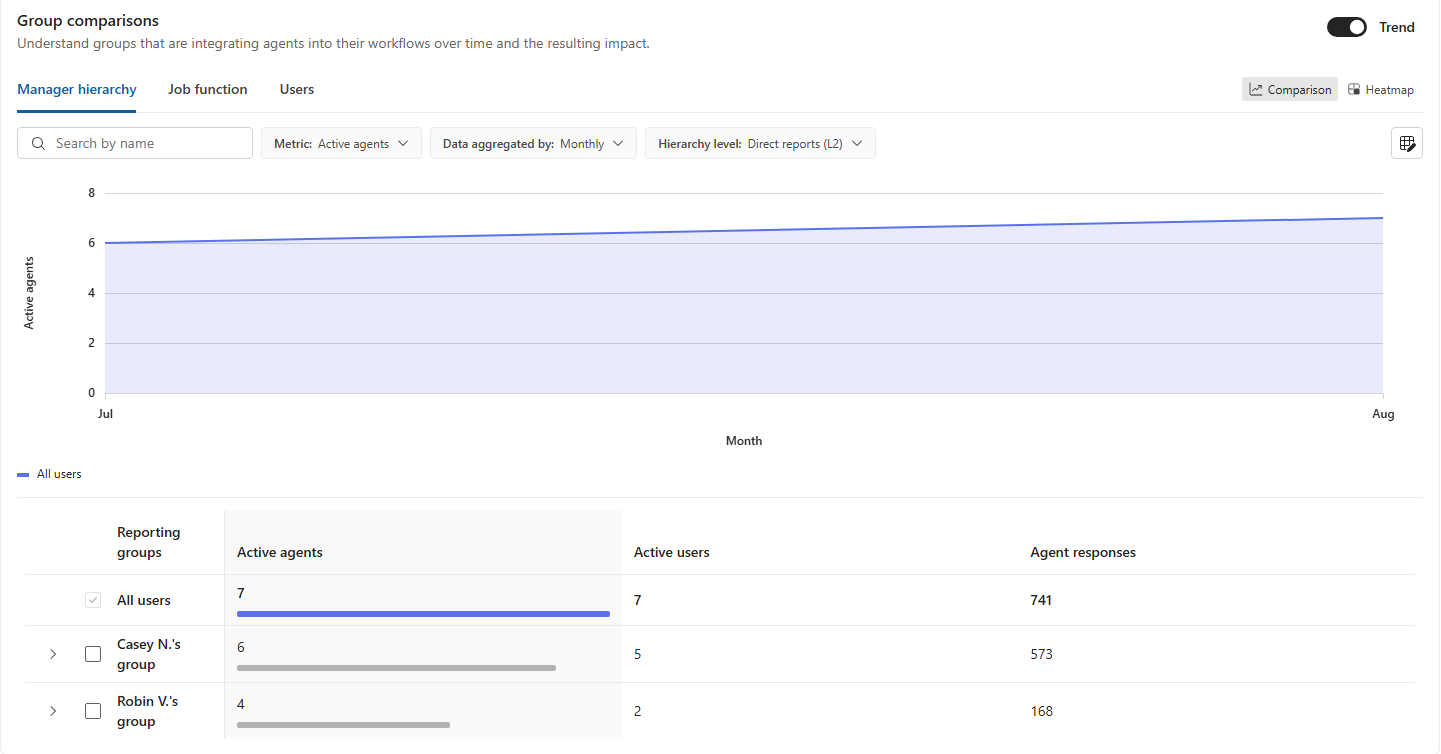
You can:
Compare different populations by manager hierarchy, job function, or individual users.
Select the metric you want to analyze. In the example shown, the selected metric is Active agents.
Adjust how the data is aggregated over time, such as monthly, and, for manager hierarchy, select the hierarchy level you want to examine.
Use the chart to see how the selected metric changes over time. Select or clear Trend depending on whether you want to focus on the trend.
On the right, switch between Comparison and Heatmap views to examine differences between groups.
Select reporting groups in the table to include them in the comparison. The table provides supporting activity metrics for each group, including Active agents, Active users, and Agent responses.
Expand a reporting group to explore its hierarchy in greater detail, or use Search by name to find a specific group.
Together, these controls help you identify differences in agent adoption and activity across different parts of the organization and see how those patterns change over time.
Agent snapshot tab
The insights on this tab help you understand which agents used within Microsoft 365 Copilot are resonating most with your organization, and lets you search and compare those agents.
Agent highlights
These cards show the agents that are especially resonating with users during the reporting period:
Most popular – The agent with the highest number of active users in the reporting period
Most versatile – The agent used by the largest number of job functions in the reporting period. This card only appears when job function data is uploaded.
Most shared – Among agents with a creator type of User, the agent with the highest number of active users in the reporting period. The card also shows how many users and organizations use the agent. This card appears when you select All or User under the Agent creator type filter.
Select an agent name to open its deep dive page. If several agents tie, you can view a list of them and open each one's page.
Agent Snapshot table
The table shows the agents used in Microsoft 365 Copilot in your organization. By default, it shows:
Agent – The agent's name. Select it to open the agent's deep dive page. Hover over an agent's name to see its description.
Created by – The agent's creator type: User, Your organization, Microsoft, or Third party.
Active users – The number of unique users with at least one agent response in the selected reporting period and audience.
Agent responses – The number of responses the agent gave to users in the selected reporting period.
The All row at the top of the list shows totals across all matching agents. By default, agents are sorted by Active users, from highest to lowest. You can also sort agents by % of Copilot users using agents, Returning users, Versatility (Job function used), and Shared across orgs.
To find an agent, enter its name in Search by name. Select a column header to sort the list. To add or remove columns, on the right, select Edit table. Agent and Created by are required columns.
Agent 365 tabs
Activity tab
The insights on this tab help you understand agent adoption and engagement across your organization, the types of work agents support, and the estimated capacity that agents make available.
Note
Use case insights might be available for only a portion of the agent sessions that match your selected time period and filters. The page displays the percentage of sessions covered. Each session counts once toward coverage, even when the session contributes to multiple use cases.
Cowork metrics aren't included in Agent 365 dashboard reporting. For those metrics, go to the Cowork tab on the Microsoft Copilot page.
At the top of the tab, summary cards provide the following metrics:
Active agents: The number of agents with at least one active session in the reporting period.
Active users: The number of distinct users with at least one agent session in the reporting period. User-level details aren't available for all agents.
Sessions: The number of agent sessions in the reporting period. Sessions can represent conversational or autonomous activity. A conversational session is a period of continuous interaction between a user and an agent, with a new session beginning after 30 minutes of inactivity. An autonomous session is initiated by a trigger, such as a schedule or another agent.
Explore agent creation and purpose
This section helps you understand who created the agents used by your organization. The visualization categorizes active agents by whether they were created by users, your organization, Microsoft, or third parties.
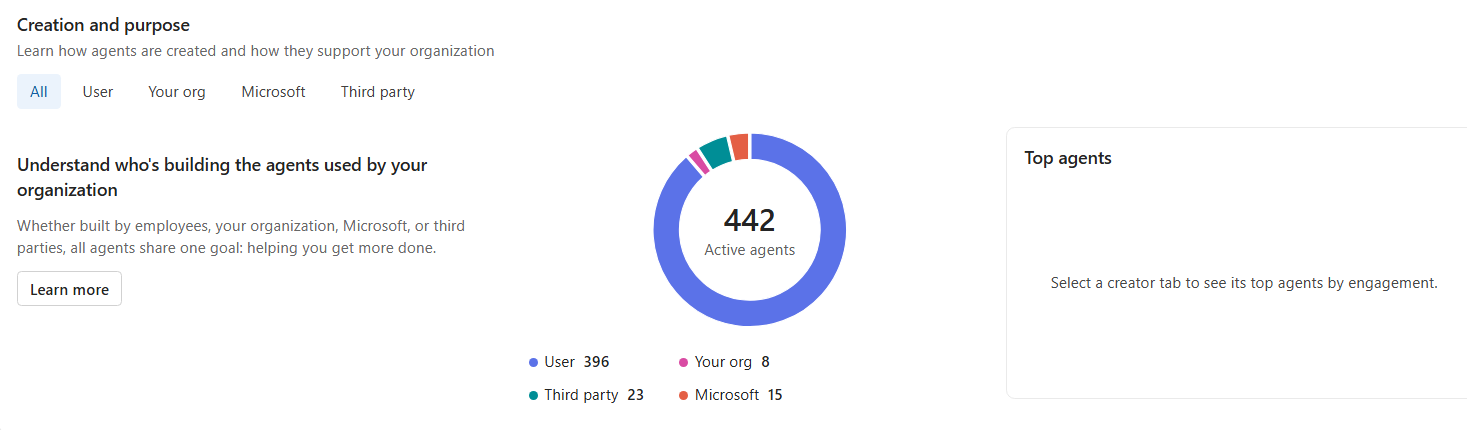
Select a creator category to focus on agents from that source and see its top agents by engagement. Use this section to understand the mix of agent sources contributing to activity across your organization.
Explore use cases
This section helps you understand the types of work agents support by organizing agent activity into domains, categories, subcategories, and use cases.
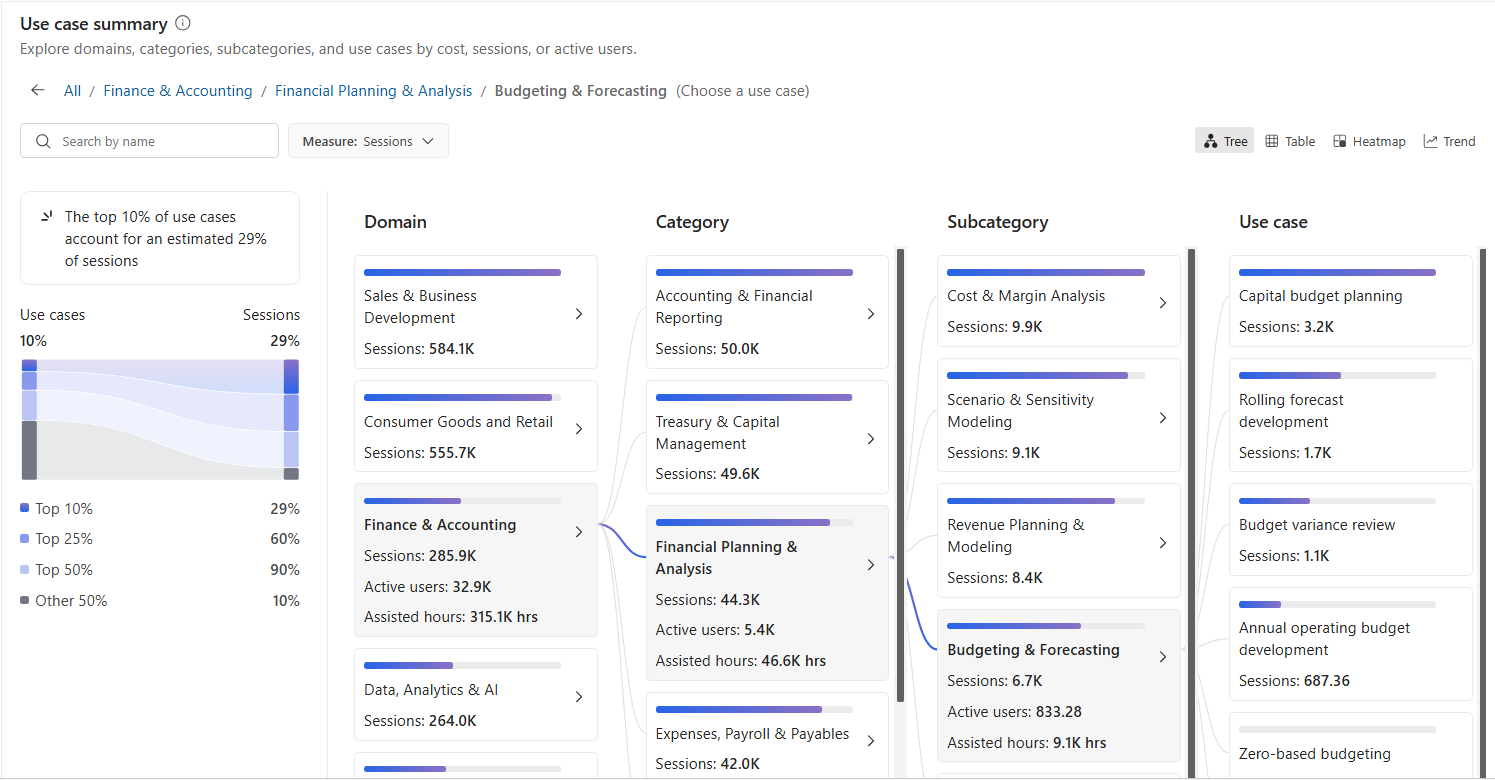
Choose a measure to analyze use cases using the available activity measure, such as Sessions, and select a domain to drill down into its categories, subcategories, and individual use cases. The distribution visualization shows how activity is concentrated across domains, helping you see how much of the selected measure is associated with the top 10 percent, top 25 percent, top 50 percent, and remaining domains.
Use Search by name to find a specific item. On the right, you can also switch between Tree, Table, Heatmap, and Trend views to examine the data from different perspectives.
Compare activity across groups
The Group comparisons section helps you compare how agents are being integrated into workflows across different parts of your organization over time.
Use the Manager hierarchy, Job function, and Users tabs to choose the population you want to analyze. Select a metric and time aggregation for the comparison. When analyzing manager hierarchy, you can also specify the hierarchy level.
The chart shows the selected metric over time, while the table provides supporting activity metrics for each reporting group, including active users, active agents, sessions, and returning users. Select reporting groups to include them in your comparison, expand groups to explore the hierarchy in more detail, or search for a specific group by name.
Use Comparison and Heatmap to change how groups are displayed, and use Trend to examine changes over time. Together, these views can help you identify differences in agent adoption and activity across the organization.
Registry tab
This tab lets you search the agents used in your organization and compare their usage, cost, and quality. At the top of the tab, cards summarize your agents:
Active agents – The number of agents with activity, the percentage of all agents that are active, and the total number of agents.
Sessions – The total number of agent sessions.
Agents without owners – The number of agents that don't have an assigned owner.
Agent highlights
These cards show the agents that are especially resonating with users during the reporting period:
Most popular – The agent with the most active users
Most versatile – The agent used across the most job functions. This card only appears when job function data is uploaded.
Most shared – The agent shared most widely, shown with its number of users and organizations
Most active agent with its own identity – The agent with its own identity that had the most sessions
Select an agent name to open its deep dive page. If several agents tie, you can view a list of them and open each one's page.
Highlights can change based on which agents deliver the most value in the reporting period.
Agent Registry table
The Agent Registry table lists the agents used in your organization. By default, it shows:
Agent – The agent's name. Select it to open the agent's deep dive page.
Created by – The agent's creator type, such as Your organization or Microsoft.
Cost – The cost attributed to each agent in U.S. dollars for the selected reporting period and filters. The All row adds costs across matching agents. Agents without usage-based billing show "—."
Active users
Sessions
To find an agent, enter its name in Search by name. Select a column header to sort the table. To add or remove columns, on the right, select Edit table. On the right, select Include deleted billed agents to show agents that are no longer in the registry, but previously had associated cost activity during the selected time period.
Agent deep dive pages (for Agent 365 view)
Each agent has one deep dive page that you can open from the Creation and purpose section, the Agent highlights cards, or the Agent Registry table. The page shows how that agent is used in your organization.
Agent details
At the top of the page, you'll see the agent's name and description, along with:
Creator type – For example, User
Creator – The name of the person or organization that created the agent
Source – For example, Agent Builder
Billing – Whether the agent uses usage-based or resource-based billing. This card isn't shown when activity isn't billed.
Top-level metrics
Cards summarize the agent's usage for the selected time period and filters:
Active users
Cost – Use the toggle to switch between U.S. dollars and Copilot credits. This card is only populated for agents with usage-based billing and only if you have access to cost data. Select the info icon to see how cost is calculated.
Sessions
Agent assisted hours – The estimated hours this agent helped employees save. Select the calculator icon to see how the estimate is calculated across the agent's use cases.
Breakdown by work type
This section shows the business use cases the agent supports, using the same use case taxonomy as the What agents are used for section.
Select View by to choose the taxonomy level, such as Domains.
On the right, select Tree, Table, or Heatmap to change the visualization.
A summary shows how concentrated the agent's sessions are across use cases – for example, the top 10 percent, top 25 percent, and top 50 percent of use cases.
Select View all to see every work type in a table.
Adoption and impact by group
This section shows trends for the selected agent. Select a tab to group the data by:
Users – Individual users who used the agent, if identifiable user-level insights are turned on.
Groups
Manager hierarchy
Functions
By default, the table shows Sessions, Cost for each row, plus a row for All users. At the top right, select Trend to show the trend chart, select the check box next to a row to add it to the chart, and select Edit table to add or remove columns – for example, Active users or Returning users. Use the additional filters to narrow the data further.
Agent deep dive pages (for Copilot Agent view)
When you select the Copilot Agent dashboard view, an agent's deep dive page shows a simplier set of insights:
Agent details – The agent's name, description, creator type, creator, source, and billing. For example, Microsoft-built agents included with Microsoft 365 Copilot show User subscription license only under Billing.
Top-level metrics – Active users and Agent responses
Adoption and impact by group – Select Groups or Functions to compare groups. The Metric is Agent responses. You can change the Data aggregated by setting, turn Trend on or off, and select Edit table to add or remove columns.
Cost, sessions, work type breakdown, and model details aren't shown on deep dive pages in the Copilot Agent view.
Note
Only agents whose users meet the minimum group size are shown on the deep dive pages. For example, if your organization's minimum group size is 10 and an agent has only six users, that agent doesn't appear, although its activity is still included in the totals on the page.
Important
For Copilot Studio agents, the metrics and values on deep dive pages might differ from those in the Copilot Studio agents report, because the Copilot Studio metrics are tailored.
When insights aren't available
To see insights, there must be enough agent activity to meet the minimum group size. Depending on the data, you might see:
No agent activity – There's no agent activity in your tenant.
Not enough agent activity – There isn't enough activity in the selected time period, or the applied filters return no matching data.
Does not meet minimum group size – A group or agent doesn't meet the minimum group size, so its details are suppressed to protect privacy.
No access – You don't have permission to view a metric, such as cost. Other sections of the page still appear.
— – The metric doesn't apply to this agent – for example, cost for an agent that isn't billed by usage.