Azure Synapse Analytics
An Azure analytics service that brings together data integration, enterprise data warehousing, and big data analytics. Previously known as Azure SQL Data Warehouse.
This browser is no longer supported.
Upgrade to Microsoft Edge to take advantage of the latest features, security updates, and technical support.
' cx='32' cy='32' r='32' /%3E%3Ctext x='50%25' y='55%25' dominant-baseline='middle' text-anchor='middle' fill='%23FFF' %3EP3%3C/text%3E%3C/svg%3E)
Hello,
I am following the below Microsoft document and running the memory query to see the memory usage on the active queries.
I am seeing 10.5 GB of current memory on the synapse pool. I am running a very simple query. Can anyone please give me some insights on the memory usage on the synapse dedicated pools. I am using DW100C
' cx='32' cy='32' r='32' /%3E%3Ctext x='50%25' y='55%25' dominant-baseline='middle' text-anchor='middle' fill='%23FFF' %3EBM%3C/text%3E%3C/svg%3E)
Hello @Pavankumar-3526 ,
Welcome to the MS Q&A platform.
Please correct me if my understanding is wrong. You want to know why your simple query is showing 10.5 GB of memory usage when you are using DW100c
If you look at the synapse architecture, it is built on Massively Parallel Processing engine. The cluster has an n number of nodes.
sys.dm_pdw_nodes_os_performance_counters DMV pulls the data from the cluster. To run a query, internally(on the cluster), some work needs to be done on the cluster nodes
run the below DMV on your synapse dedicated pools, this will give you the actual memory of the queries.
 SELECT
 ssu.session_id,
 Sum( (es.memory_usage * 8) )AS 'MemoryUsage (in KB)',
 exs.login_name AS 'LoginName'
 FROM sys.dm_pdw_nodes_db_session_space_usage AS ssu
     INNER JOIN sys.dm_pdw_nodes_exec_sessions AS es ON ssu.session_id = es.session_id AND ssu.pdw_node_id = es.pdw_node_id
     INNER JOIN sys.dm_pdw_nodes_exec_connections AS er ON ssu.session_id = er.session_id AND ssu.pdw_node_id = er.pdw_node_id
     INNER JOIN microsoft.vw_sql_requests AS sr ON ssu.session_id = sr.spid AND ssu.pdw_node_id = sr.pdw_node_id
     LEFT JOIN sys.dm_pdw_exec_requests exr on exr.request_id = sr.request_id
     LEFT JOIN sys.dm_pdw_exec_sessions exs on exr.session_id = exs.session_id
     --where es.is_user_process = 1
 group by ssu.session_id, exs.login_name
To create the microsoft.vw_sql_requests view
 create schema Microsoft
 Go
 CREATE VIEW microsoft.vw_sql_requests
 AS
 (
     SELECT
         sr.request_id,
         sr.step_index,
         (CASE WHEN (sr.distribution_id = -1 ) THEN (SELECT pdw_node_id FROM sys.dm_pdw_nodes WHERE type = 'CONTROL') ELSE d.pdw_node_id END) AS pdw_node_id,
         sr.distribution_id,
         sr.status,
         sr.error_id,
         sr.start_time,
         sr.end_time,
         sr.total_elapsed_time,
         sr.row_count,
         sr.spid,
         sr.command
     FROM
         sys.pdw_distributions AS d
         RIGHT JOIN sys.dm_pdw_sql_requests AS sr ON d.distribution_id = sr.distribution_id
 )
 GO
reference documents:
https://github.com/Microsoft/sql-data-warehouse-samples/blob/main/solutions/monitoring/scripts/views/microsoft.vw_sql_requests.sql
https://learn.microsoft.com/en-us/azure/synapse-analytics/sql-data-warehouse/sql-data-warehouse-manage-monitor
(or) if your workspace is connected to log analytics, you can track CPU and Memory usage by the below query
 Perf
 | where TimeGenerated > ago(1h)
 | where (CounterName == "% Processor Time" and InstanceName == "_Total") or CounterName == "% Used Memory"
 | project TimeGenerated, CounterName, CounterValue
 | summarize avg(CounterValue) by CounterName, bin(TimeGenerated, 1m)
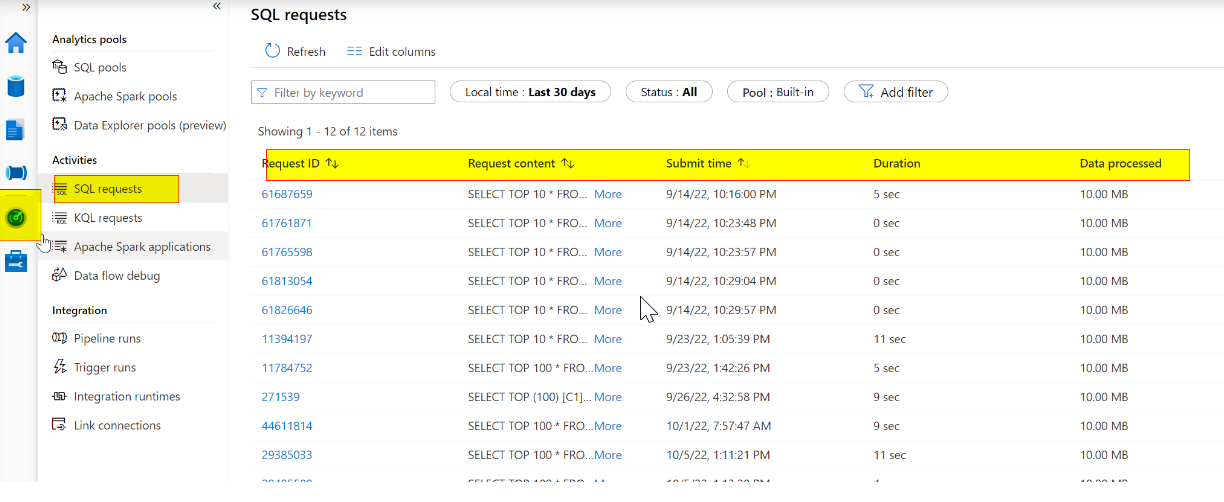
Also, you can monitor using synapse studio.
go to the monitor tab and click on SQL requests, you can see the duration and Data processed for all queries.
The results should be same as running the DMVs
I hope this helps. Please let me know if you have any further questions.
------------------------------
 and upvote
  button whenever the information provided helps you. Original posters help the community find answers faster by identifying the correct answer. Here is how