Azure Virtual Machines
An Azure service that is used to provision Windows and Linux virtual machines.
This browser is no longer supported.
Upgrade to Microsoft Edge to take advantage of the latest features, security updates, and technical support.
' cx='32' cy='32' r='32' /%3E%3Ctext x='50%25' y='55%25' dominant-baseline='middle' text-anchor='middle' fill='%23FFF' %3EVN%3C/text%3E%3C/svg%3E)
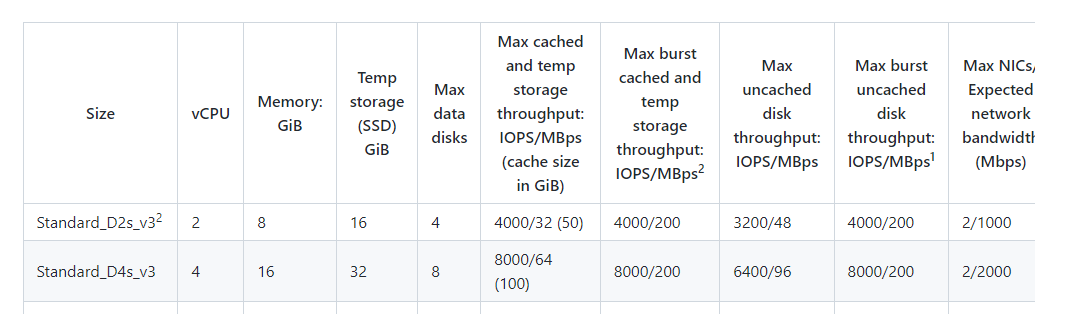
According to the documentation - The Max bandwidth for Standard_D4s_v3 is 2000 Mbps
in Azure portal, VM Monitoring blade, the total network out shows :
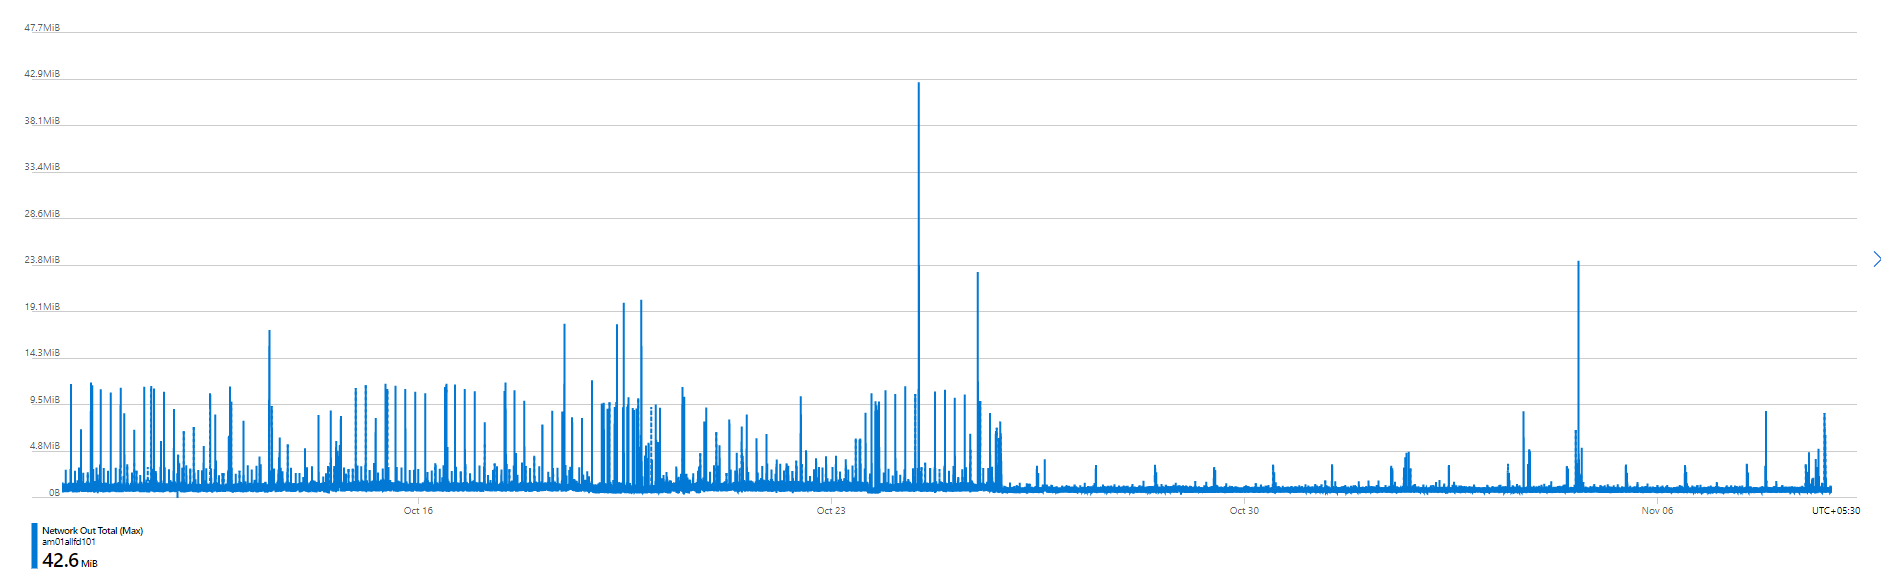
From what i understand - this data in portal is shown at 1 Minute granularity
42.6 MiB is Per Minute = 42.6 /60 = 0.71 MiBps
0.71 MiBps = 5.95 Mbps
But the Max bandwidth is 2000 Mbps
How do i convert 2000 Mbps so that i know the Expected bandwidth in MiBps or GiBps?
Can i get a clarity on how this calculation is done
' cx='32' cy='32' r='32' /%3E%3Ctext x='50%25' y='55%25' dominant-baseline='middle' text-anchor='middle' fill='%23FFF' %3EA%3C/text%3E%3C/svg%3E)
@Vootukooru, Nishanth
I think I understand your issue now. Thanks so much for clarifying that for me. You are expecting the Maximum on your above graph to be closer to the limit, but are only seeing 47.7 MiB. The graph for this metric automatically adjusts the scale and does not show the limit for the VM. The reason you are seeing it maximum at 47.7 MiB is because that is the maximum your VM has used during the period. If you run some throughput testing and fully utilize the bandwidth you should see the graph update to a higher value.
Hopefully that helps to clarify. Let me know if you still have questions.
-------------------------------
Please don’t forget to "Accept the answer" and “up-vote” wherever the information provided helps you, this can be beneficial to other community members.
Thanks deherman , that helps but i just have one more clarification required.
So if i take NetworkOutTotal(Max) / Maximum Bandwidth per Size - The numbers are going over and above 100%...
How can i get the Network Utilization % every hour, like we have the CPU and Memory utilization%
Thanks,
Nisanth.