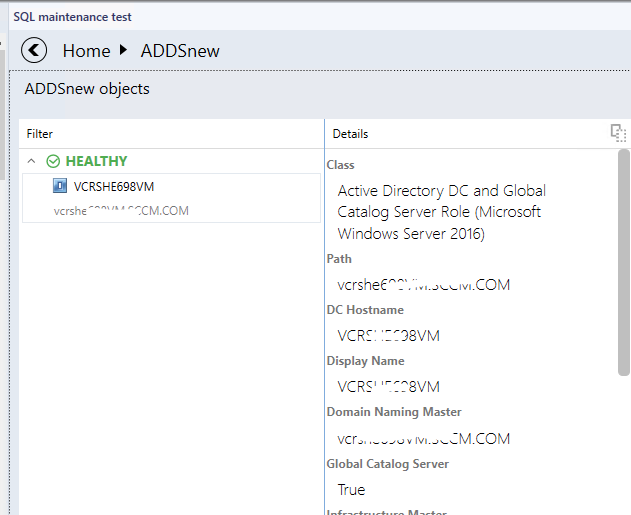
@Christian , Thanks for letting us know the location. Based on my test, I find my DC is in healthy state without maintenance. I will monitor more to see if it will be accidently put into maintenance mode.
On the other hand, we can do SQL query to check the maintenance mode for the server.
dbo.MaintenanceMode.[User] as [User],
Case ReasonCode
When 0 then 'Other (Planned)'
When 1 then 'Other (Unplanned)'
When 2 then 'Hardware: Maintenance (Planned)'
When 3 then 'Hardware: Maintenance (Unplanned)'
When 4 then 'Hardware: Installation (Planned)'
When 5 then 'Hardware: Installation (Unplanned)'
When 6 then 'Operating System: Reconfiguration (Planned)'
When 7 then 'Operating System: Reconfiguration (Unplanned)'
When 8 then 'Application: Maintenance (Planned)'
When 9 then 'Application: Maintenance (Unplanned)'
When 10 then 'Application: Installation (Planned)'
When 11 then 'Application: Unresponsiv'
When 12 then 'Application: Unstable'
When 13 then 'Security issue'
When 14 then 'Loss of network connectivity (Unplanned)'
End as [Reason for Maintenance]

FROM BaseManagedEntity INNER JOIN
MaintenanceMode ON BaseManagedEntity.BaseManagedEntityId = MaintenanceMode.BaseManagedEntityId
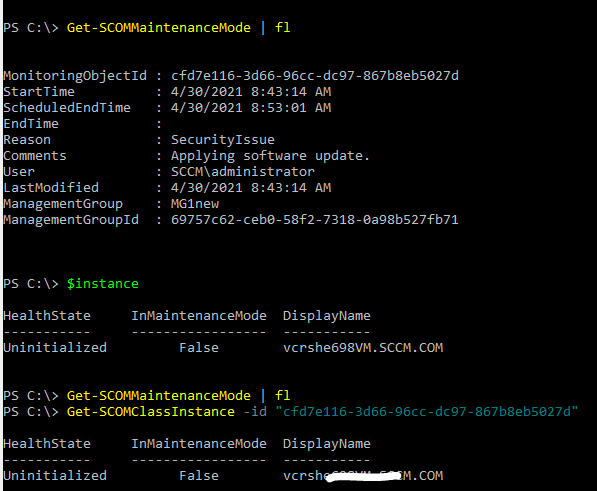
We can also use "Get-SCOMMaintenanceMode" to confirm if the server is really in maintenance mode:
Hope it can help.
If the response is helpful, please click "Accept Answer" and upvote it.
Note: Please follow the steps in our documentation to enable e-mail notifications if you want to receive the related email notification for this thread.
' cx='32' cy='32' r='32' /%3E%3Ctext x='50%25' y='55%25' dominant-baseline='middle' text-anchor='middle' fill='%23FFF' %3EC%3C/text%3E%3C/svg%3E)
' cx='32' cy='32' r='32' /%3E%3Ctext x='50%25' y='55%25' dominant-baseline='middle' text-anchor='middle' fill='%23FFF' %3ECM%3C/text%3E%3C/svg%3E)
' cx='32' cy='32' r='32' /%3E%3Ctext x='50%25' y='55%25' dominant-baseline='middle' text-anchor='middle' fill='%23FFF' %3EC%3C/text%3E%3C/svg%3E)