Hi,
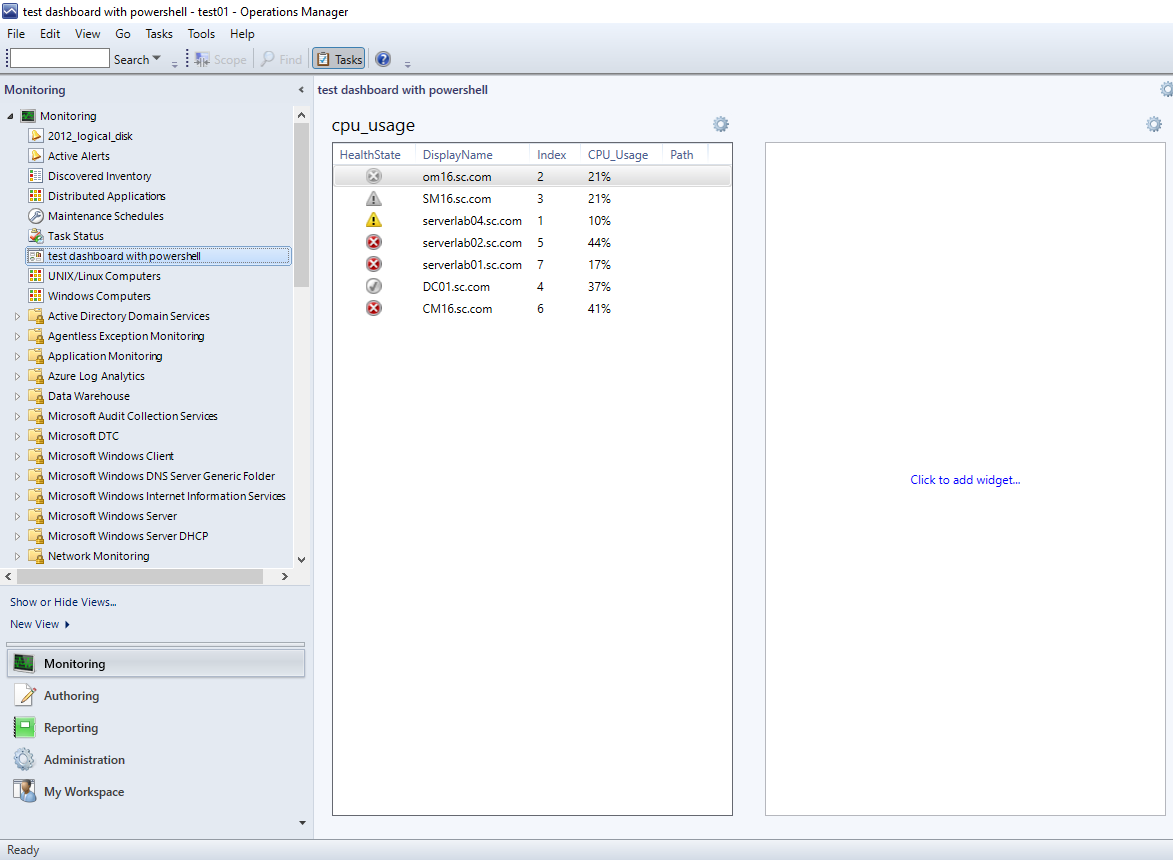
Thank you for asking this. For a quick lab test, I've created a dashboard view with two grid columns and add the PowerShell Grid Widget for one of them. And the powershell is something like this.
$class = Get-SCOMClass -Name Microsoft.Windows.Computer
$computers = Get-SCOMClassInstance -Class $class
$i=1
foreach ($computer in $computers)
{
    $cpu_usage = (Get-WmiObject -ComputerName $computer -Class win32_processor -ErrorAction silentlycontinue | Measure-Object -Property LoadPercentage -Average | Select-Object Average).Average.ToString()+"%"
    $dataObject=$ScriptContext.CreateFromObject($computer,"Id=Id,HealthState=HealthState,DisplayName=DisplayName",$null)
    $dataObject["Index"]=$i
    $dataObject["CPU_Usage"]=$cpu_usage
    $ScriptContext.ReturnCollection.Add($dataObject)
    $i++
}
Note: Get-WmiObject need remote administration permission on target computer. We can set -ErrorAction Stop to see if any errors. If 0x800706BA error appears, check this article:
https://www.vspbreda.nl/nl/server-os/server-2008/error-get-wmiobject-the-rpc-server-is-unavailable-exception-from-hresult-0x800706ba/
Note: the above link is not from MS, just for your reference.
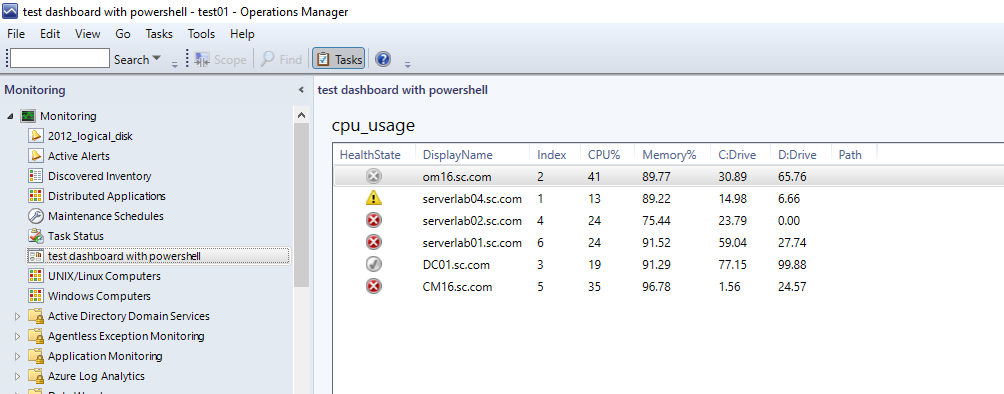
After that, the output is like this:

For more information about dashboard scrip widget, we may refer to:
https://social.technet.microsoft.com/wiki/contents/articles/24595.operations-manager-dashboard-script-widgets.aspx
Alex
If the response is helpful, please click "Accept Answer" and upvote it.


